Java Stack Trace: How to Read and Understand to Debug Code
Time to read: 5 minutes
May 23, 2019
Written by
When things go wrong in a running Java application, often the first sign you will have is lines printed to the screen that look like the code below. This is a Java Stack Trace, and in this post, I'll explain what they are, how they are made, and how to read and understand them. If that looks painful to you then read on...
Java Stack Trace: What It Is and How It Works
A stack trace (also known as a stack backtrace or stack traceback) is an incredibly useful tool when it comes to debugging code. Learn more about what it is and how it works.
What Is a Java Stack Trace?
A stack trace shows the call stack (sets of active stack frames) and provides information on the methods that your code called. Usually, a stack trace is shown when an Exception is not handled correctly in code. (An exception is what a runtime environment uses to tell you that there's an error in your code.) This may be one of the built-in Exception types, or a custom Exception created by a program or a library.
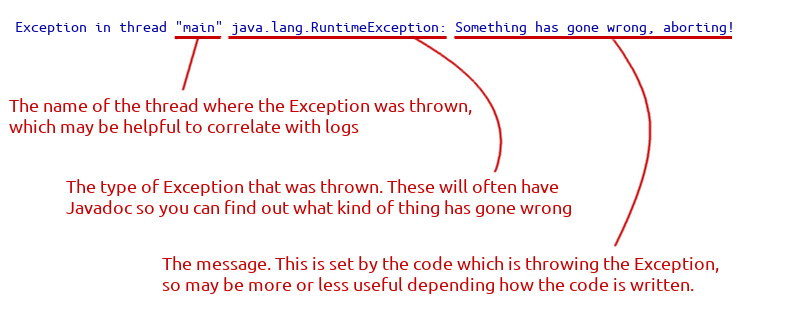
The stack trace contains the Exception’s type and a message, and a list of all the method calls which were in progress when it was thrown.
How to Read a Java Stack Trace
Let’s dissect that stack trace. The first line tells us the details of the Exception:
This is a good start. Line 2 shows what code was running when that happened:
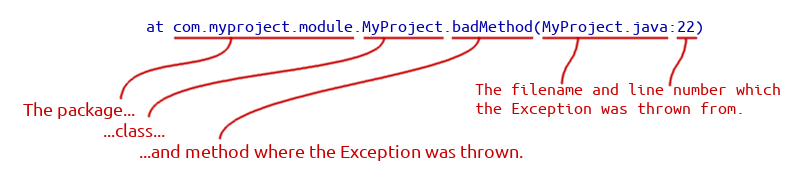
That helps us narrow down the problem, but what part of the code called badMethod? The answer is on the next line down, which can be read in the exact same way. And how did we get there? Look on the next line. And so on, until you get to the last line, which is the main method of the application. Reading the stack trace from bottom to top you can trace the exact path from the beginning of your code, right to the Exception.
What Triggered the Stack Trace?
The thing that causes an Exception is usually an explicit throw statement. Using the file name and line number you can check exactly what code threw the Exception. It will probably look something like this:
This is a great place to start looking for the underlying problem: are there any if statements around that? What does that code do? Where does the data used in that method come from?
It is also possible for code to throw an Exception without an explicit throw statement, for example you can get:
- NullPointerException if
objisnullin code which callsobj.someMethod() - ArithmeticException if a division by zero happens in integer arithmetic, ie
1/0- curiously there is no Exception if this is a floating-point calculation though,1.0/0.0returnsinfinityjust fine! - NullPointerException if a
nullInteger is unboxed to anintin code like this:Integer a=null; a++; - There are some other examples in the Java Language Specification, so it’s important to be aware that Exceptions can arise without being explicitly thrown.
Dealing with Exceptions Thrown by Libraries
One of the great strengths of Java is the huge number of libraries available. Any popular library will be well tested so generally when faced with an Exception from a library, it’s best to check first whether the error is caused by how our code uses it.
For example, if we're using the Fraction class from Apache Commons Lang and pass it some input like this:
If numberOfBars is zero, then the stack trace will be like this:
Many good libraries provide Javadoc which includes information about what kinds of Exceptions may be thrown and why. In this case Fraction.getFraction has documented will throw an ArithmeticException if a Fraction has a zero denominator. Here it's also clear from the message, but in more complicated or ambiguous situations the docs can be a great help.
To read this stack trace, start at the top with the Exception's type - ArithmeticException and message The denominator must not be zero. This gives an idea of what went wrong, but to discover what code caused the Exception, skip down the stack trace looking for something in the package com.myproject (it’s on the 3rd line here), then scan to the end of the line to see where the code is (MyProject.java:17). That line will contain some code that calls Fraction.getFraction. This is the starting point for investigation: What is passed to getFraction? Where did it come from?
In big projects with many libraries, stack traces can be hundreds of lines long so if you see a big stack trace, practice scanning the list of at ... at ... at ... looking for your own code - it’s a useful skill to develop.
Best Practice: Catching and Rethrowing Exceptions
Let's say we are working on a big project that deals with fictional FooBars, and our code is going to be used by others. We might decide to catch the ArithmeticException from Fraction and re-throw it as something project-specific, which looks like this:
Catching the ArithmeticException and rethrowing it has a few benefits:
- Our users are shielded from having to care about the
ArithmeticException- giving us flexibility to change how commons-lang is used. - More context can be added, eg stating that it’s the number of FooBars that is causing the problem.
- It can make stack traces easier to read, too, as we’ll see below.
It isn't necessary to catch-and-rethrow on every Exception, but where there seems to be a jump in the layers of your code, like calling into a library, it often makes sense.
Notice that the constructor for MyProjectFooBarException takes 2 arguments: a message and the Exception which caused it. Every Exception in Java has a cause field, and when doing a catch-and-rethrow like this then you should always set that to help people debug errors. A stack trace might now look something like this:
The most recently thrown Exception is on the first line, and the location where it was thrown is still on line 2. However, this type of stack trace can cause confusion because the catch-and-rethrow has changed the order of method calls compared to the stack traces we saw before. The main method is no longer at the bottom, and the code which first threw an Exception is no longer at the top. When you have multiple stages of catch-and-rethrow then it gets bigger but the pattern is the same:
Check the sections from first to last looking for your code, then read relevant sections from bottom to top.
Libraries vs Frameworks
The difference between a Library and a Framework in Java is:
- Your code calls methods in a Library
- Your code is called by methods in a Framework
A common type of Framework is a web application server, like SparkJava or Spring Boot. Using SparkJava and Commons-Lang with our code we might see a stack trace like this:
OK that is getting quite long now. As before we should suspect our own code first, but it's getting harder and harder to find where that is. At the top there is the Framework's Exception, at the bottom the Library's and right in the middle is our own code. Phew!
A complex Framework and Library can create a dozen or more Caused by: sections, so a good strategy is to jump down those looking for your own code: Caused by: com.myproject... Then read that section in detail to isolate the problem.
Java Stack Trace Takeaways
Learning how to understand stack traces and read them quickly will let you home in on problems and makes debugging much less painful. It's a skill that improves with practice, so next time you see a big stack trace don't be intimidated - there is a lot of useful information there if you know how to extract it.

If you have any tips or tricks about dealing with Java stack traces, I'd love to hear about them so get in touch with me and let's share what we know.
mgilliard@twilio.com
For more resources on debugging code and applications, check out these articles:


Related Resources
Twilio Docs
From APIs to SDKs to sample apps
API reference documentation, SDKs, helper libraries, quickstarts, and tutorials for your language and platform.
Resource Center
The latest ebooks, industry reports, and webinars
Learn from customer engagement experts to improve your own communication.
Ahoy
Twilio's developer community hub
Best practices, code samples, and inspiration to build communications and digital engagement experiences.