Monitoring Your Website's Core Web Vital Performance
Time to read: 12 minutes
November 30, 2020
Written by
Reviewed by

Web performance used to be easy. You’d time how long a page takes to load, easy.
But the rise of client-side JavaScript has introduced bold new ways for websites to be frustratingly slow. Measuring this new slowness will take new metrics. Google calls them the Core Web Vitals.
Each of the Core Web Vitals measures a different aspect of how a web application responds. This post will take a look at each of these metrics, what they measure, and how to use them. You’ll also take a look at my Really Slow Webpage™ and implement a basic performance monitoring script to see just how bad it really is. Finally, you’ll see how to interpret performance data to decide what your performance goals should be.
What you’ll learn
In this tutorial you’ll learn about:
- Some of the different ways modern websites can have poor performance.
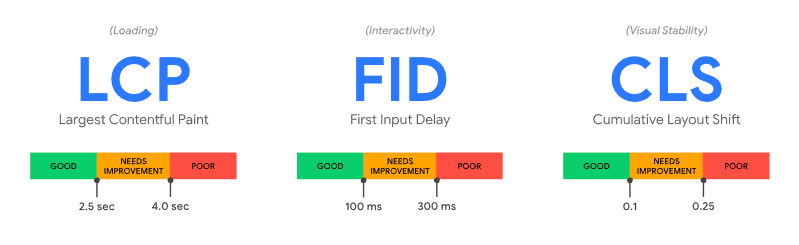
- The new emerging metrics for web performance, the Core Web Vitals, and what they measure.
- How to collect Core Web Vitals in your own application.
Contentful Paint
Once a web browser has downloaded and parsed your content, it will render and paint the content to the screen. For simple web pages, this happens only once: the HTML is downloaded, and the content is shown. But for many modern web applications, content will be broken into many smaller chunks and assembled asynchronously with JavaScript. In cases like this, there can be dozens or even hundreds of paint events.
Each paint event could be important for your application, but generally you care about two of them: the first time content was rendered, and the time the largest amount of content was rendered. These are called the First Contentful Paint and the Largest Contentful Paint.
First Contentful Paint
The First Contentful Paint (FCP) is the time between when the user starts navigating to a URL, via a link click or entering the address, and the time the first content is drawn on the screen.
This time represents the first visible indication to the user that their request has been received and that the content is coming. It’s important to show the user something quickly to keep their attention and feel fast.
For example, let’s take a look at the site for a major US retailer, Target.com. Here is the First Contentful Paint today:
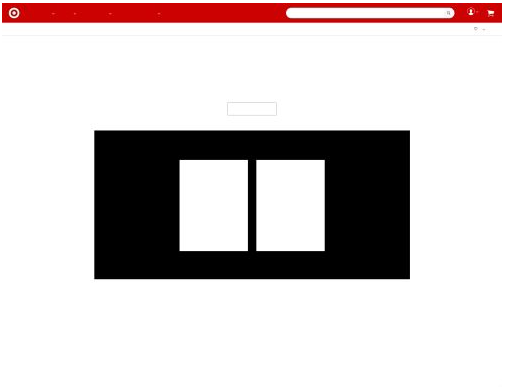
The initial document request contains a basic skeleton of the page, which can be painted to the screen very quickly. In a typical case, about 300ms, which is noticeable, but feels very quick. It doesn’t give the user anything to do yet, but they know that something is coming.
Largest Contentful Paint
The Largest Contentful Paint (LCP) is the time since navigation started when the largest amount of content is drawn on the screen, measured by pixel area.
This time is a proxy for when the user thinks the page is substantially complete, and that they can proceed with their task. Hopefully, this has occurred quickly enough that they aren’t distracted yet.
Return to Target.com. As the page continues to load, the Largest Contentful Paint draws the screen out to this:
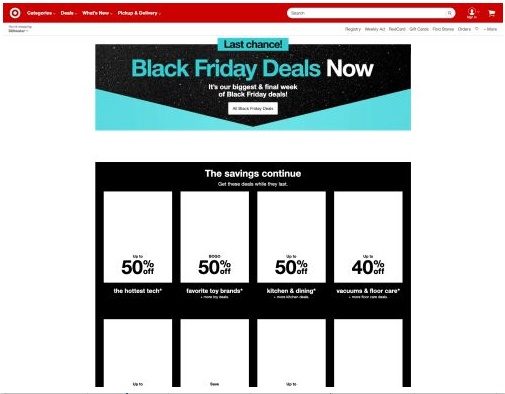
The page is much more complete, showing that it knows about the user, their location, and the discounts Target wants to offer. This data came from various back-end services that returned asynchronously. The page is not quite done, as some images have not yet loaded, but the user would probably start interacting with the page at this point, which is 2 seconds after start.
Wait, isn’t LCP just like the old onload metric? Not exactly. onload is a specific event the browser triggers when everything known has been downloaded, parsed, and rendered. However, many websites will continue downloading more content after load, which can trigger more paint events.
Because the LCP value will be updated as larger paint events occur later in the page’s lifetime, it may not be as useful for single-page applications that do a lot of client-side routing and rendering. The Largest Contentful Paint could come many minutes after the page was initially loaded, as large parts of the screen are repainted.
Both the LCP and onload are still valuable, and you should measure what is most meaningful for how your web application loads.
Cumulative Layout Shift
The Cumulative Layout Shift (CLS) is a measurement of how much elements move around due to late-rendered content. A common example is banner ads loading on a news website. You go to click on a headline, but a new ad gets rendered that pushes all the content down, and you miss-click. That frustrating movement is layout shift.
Unlike other performance metrics, layout shift cannot be measured as time. Instead, each layout shift is given a score based on the percent of the current viewport that changed, and the distance that elements moved. Google has more details on how this is calculated.
A large, asynchronous site like Target.com will have lots of layout shifts as the content is rendered. The Cumulative Layout Shift is simply the sum of all the layout shift scores. This score is a measurement of all the times the webpage moved around on the user.
First Input Delay
Once the page has painted something to the screen the user will try to interact by clicking. But the browser might be busy downloading and parsing obscene amounts of JavaScript or other assets. The delay between when the user first interacts and when the browser can trigger the event is called the First Input Delay (FID).
This performance metric is a little harder to understand. It’s not a measurement about your code performance directly. It’s a measurement of when the user thinks they can interact, and how much work the browser is still doing.
Consider Target.com again. After the Largest Contentful Paint event, the page looks ready to use. But the browser is still downloading images and executing JavaScript.
If you click on a coupon, which triggers an onClick event, the browser has to stop what it’s doing and publish the event to any JavaScript listeners, which does not happen instantly. This delay is the First Input Delay.
FID is a measure of both when the user thinks the page is ready and how much stuff is still being done.
Compatibility and limitations
Google is the driving force behind the Core Web Vital metrics, and has said the Core Web Vitals will be search ranking indicators starting in 2021. The metrics have been implemented in Blink, and so are available in Chrome, Edge, and Opera.
Web Vitals are currently a draft in the W3C, and have not started the Standardization Process. There will continue to be changes as other organizations review and adopt the proposal.
If you decide to start capturing performance data, Web Vital metrics will only represent the behavior of newer Chrome users, which may not be representative of your user base.
Lab Performance vs. Field Performance
As you build your website, you probably have an intrinsic feeling for how fast it is. Maybe you’ve even run some performance profiling tools like Chrome Lighthouse to gather metrics about your performance. That’s great! This is called “Lab Performance”. It’s the performance of your website to you in your local controlled environment.
But what is more relevant is how fast your users experience your website in the real world, where browsers are unpredictable and networks are not infallible. Gathering performance metrics from real users is called “Field Performance” because it shows you how your website really works in the field.
In the next section you’ll see how you can gather field performance data from your website.
Case Study: The Really Slow Website™
This tutorial has a demonstration website, and it’s really slow. It’s a single page that loads navigation links and content dynamically to illustrate how a page that loads fast can still feel really slow.
You’re going to write a performance monitoring script for the website that captures field performance data for the Core Web Vitals: First Contentful Paint, Largest Contentful Paint, Cumulative Layout Shift, and the First Input Delay.
You can use your own website for this exercise if you prefer.
Prerequisites
The Really Slow Website™ consists of some static content served from a Node.js service with Express. You’ll need the following tools and resources to implement the performance monitoring code in this tutorial:
- Git and a Github account – To clone the example repository.
- Node.js. This example uses the current LTS version, 14.15.0
- Google Chrome. – Version 87 or higher.
- Visual Studio Code – or the code editor of your choice.
You should have a working knowledge of Git, HTML, and JavaScript. See other posts listed in the Additional Resources section if you need a refresher.
If you get stuck along the way, the complete solution is in the complete branch of the companion repository on GitHub.
Getting started
If you’re going to use my Really Slow Website™, you’ll need to clone the repository from Github and get it running on your computer. Start by executing the following commands in the directory where you’d like to create the project directory:
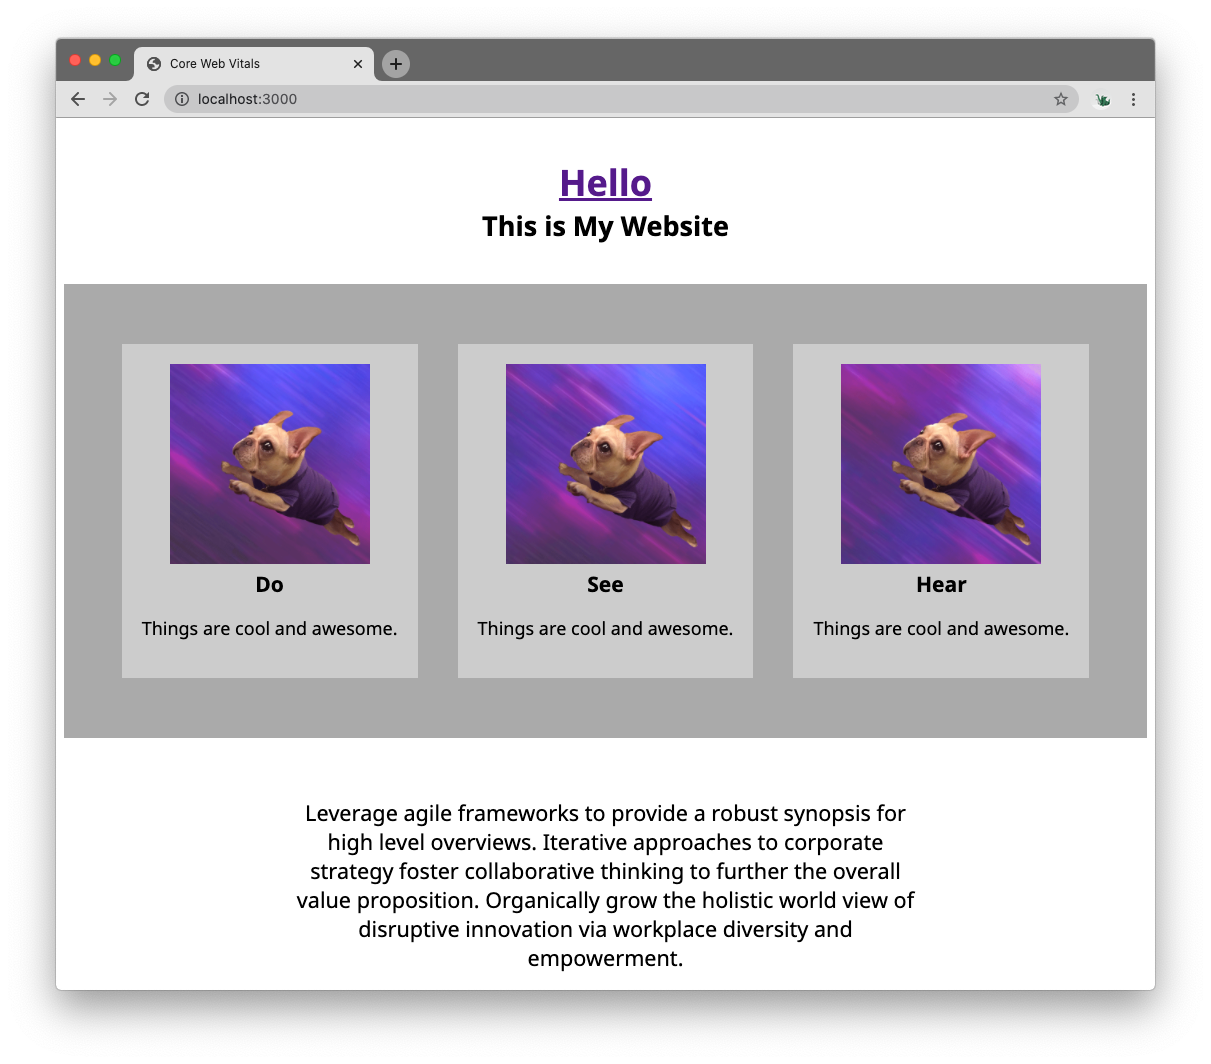
This will install the dependencies for the website and start the server at http://localhost:3000/. Open that URL in Google Chrome and you should eventually see a page with a title, three awesome navigation elements, and some content text.
If you prefer to use your own website for this exercise, make sure you have it running locally and that you can modify the HTML and add JavaScript files to it easily.
Troubleshooting
Here are some solutions to common problems you might encounter:
Command not found: git– Make sure you have Git installed correctly and added to your PATH.Command not found: npm– Make sure you have Node.js installed correctly and added to your path.- npm errors – Make sure you are running a current version of Node.js. The example is based on the current long-term support version, 14.15.0.
Creating the performance monitoring script
Go to the monitoring-core-web-vitals/public directory and create a new file called perf.js and insert the following JavaScript code:
The code creates an IIFE, an immediately invoked functional expression, to isolate this code from the global namespace. It creates an object to hold performance data and writes an initialization message to the console.
Go to index.html in the public directory and add the following <script> element after the existing <script> elements:
Open Chrome and navigate to http://localhost:3000/. Open the Developer Tools by pressing F12. Refresh the page and you should see the following output in the console:
The perf.js script is working!
Monitoring First Contentful Paint
FCP, like many of the Core Web Vital metrics, is exposed via the PerformanceObserver API. To use it, you create an instance of the observer to listen for paint events, and provide a callback to save the responses.
Go to the perf.js file and add the following code after the console.log statement:
This creates a PerformanceObserver that will observe paint events. The buffered option allows fcpObserver to receive events that may have already happened before the observer was created. When paint actions have completed, the handleFCP function will be called with a performance entry list.
Fill in the body of the handleFCP function by replacing the // TODO comment with:
The getEntries() function converts the contents of the entryList argument to an array, but may return null in some instances. To protect against that, entries defaults to an empty array. The function then loops over the entries looking for one with the name first-contentful-paint, which contains the required value.
Go back to Chrome and refresh the page. You should see the new FCP value written to the console, probably about 2000ms.
Monitoring Largest Contentful Paint
Just like FCP, the LCP is exposed via the PerformanceObserver API with a different entry name. Strangely, the LCP is not a paint event, but it’s own type, largest-contentful-paint.
Other than the names, the code is very similar. Go back to perf.js and add the following lcpObserver below the fcpObserver you created previously:
The difference between FCP and LCP is that you don’t necessarily know which paint is the largest until all the paint events have occurred. The observer will call the handler for each paint event that is the largest so far. The code checks to make sure that the startTime of the paint event is after any previously saved value before saving it.
Refresh the page in Chrome. In addition to the previous console messages, you’ll see one or more additional messages about saving the LCP value.
Monitoring Cumulative Layout Shift
The Cumulative Layout Shift is also available with a PerformanceObserver, but you need to do a little more work. The observer will tell you when layout shifts happen, and what the score was, but you need to add them all together to make it cumulative.
You also need to check to see if the layout shift is in response to a user action. If the user clicks on a button and a form unfolds, that’s not an unexpected layout shift and you don’t count it in CLS.
Fortunately, there’s an API for that.
In perf.js, add the following below the lcpObserver:
Refresh the page in Chrome again. You’ll see several additional messages as each layout shift happens during the loading process. In a representative trial the total CLS was about 0.138.
Monitoring First Input Delay
As you might expect, as a Core Web Vital, the First Input Delay is exposed with a PerformanceObserver. And just like the other metrics, there is a quirk in how it is captured. Rather than providing the delay value directly, the PerformanceObserver API provides an object with multiple timestamps that you need to calculate.
In perf.js, add the following below clsObserver:
The delay in first-input is the difference between when the entry started and when the entry started processing the first event handlers.
Refresh the page in Chrome. You won’t see the FID console message yet though. You need to interact with the page first. Click on the background body somewhere. As soon as you click, you’ll see the FID recorded.
Play around with clicking at different phases of the loading process. When you click before the content is loaded, the FID could beover 800ms. But if you wait until the page is done, the delay is only about 50ms. This illustrates how important it is to give the user indications of when the page is ready, especially if it's slow.
Sending the Data with a Beacon
Now that you have some performance metrics, you need to save them somewhere. A great way to do this is with the Beacon API. The Beacon allows you to send small amounts of data after a page has been unloaded.
This works particularly well for performance data because it guarantees that all the performance metrics are in their final state, rather than picking an arbitrary time to send the data.
To use the Beacon, you wait for a beforeunload event, then call navigator.sendBeacon with a URL and data. The Really Slow Website™ example has an endpoint called /vitals that prints out the values into the server console.
Add this below the observers in perf.js:
Go back to the site in Chrome and refresh it a few times. You probably don’t see anything different. Why? Remember that the Beacon sends the data after the page has been unloaded, right before the Dev Tool console gets cleared.
If you want to see the values in Chrome, you can turn on the “Preserve Log” function in the Console or Network tabs. That should allow you to see the call to /vitals being made.
Or, you can pop over to the terminal where you started the website. Each time /vitals was called with your performance data, the data should be sent to the console window.
Understanding the Data
As you saw with the Really Slow Website™ case study, field performance metrics are hard to gather and interpret. Running a performance script will capture hundreds or thousands of data points that need to be distilled to understand the real performance of your website.
Some of the data you receive will be from users with really fast computers and networks. Some of the data will be on a 3G connection in Siberia with a broken antennae. The truth is somewhere in the middle.
For the Core Web Vitals, Google has some general advice about the target ranges for the metrics. They recommend that you look at the 75th percentile of your field data, which means what value do 75% of your users do better than.
But this is just a starting point!
You need to decide for yourself what is appropriate for your website, your audience, and your users. Charting your metrics over time can be helpful to see how performance changes as you release new code. For example, here is a Web Vital histogram and distribution chart from Request Metrics, a web performance tool.
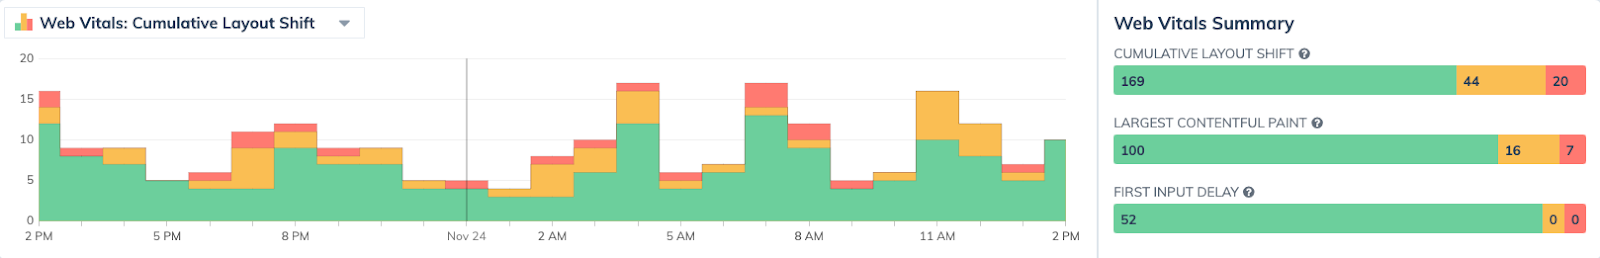
You may also want to combine the Web Vital data with more traditional metrics like page load, hits, unique users, or page size to give you a more complete picture of field performance. No one metric tells the entire story.
Summary
In this post you learned about the new Core Web Vital performance metrics, what they measure, and how to use them. You looked at an example website and wrote a simple script for gathering field performance metrics from real users and how to interpret them.
Web Performance is a complex topic and you should learn more about it. Developers need to lead in making the web fast and accessible for everyone. There are lots of projects and tools that can help you along the way. Check out the Additional Resources section below for some recommendations.
Additional resources
Dive deeper into the topics discussed in this post with the following links:
Getting started with Git and Github – Refresher on how to use Git and Github to interact with the case study.
You Don’t Know JS Yet: Getting Started – Wonderful book series by Kyle Simpson to help understand and master JavaScript.
Improving Web Performance Training on Frontend Masters – 1-day online training from the author about web performance, setting goals, and measuring data.
Open-source performance monitoring scripts:
- Google Web Vitals – A more-complete script for gathering the Core Web Vital data from web pages.
- Boomerang.js – A full performance monitoring script from Akamai. It’s big, but very complete and broadly compatible.
Performance monitoring tools and analysis:
- Request Metrics – Low cost commercial service that gathers performance data and provides easy reports and simple alerts.
- OpenSpeed Monitor – Open source Java tool that you can run to give you basic performance charting.
Todd Gardner is a curmudgeonly web developer and conference speaker who advocates for simple design and balancing complexity against risk. He is the president and co-founder of TrackJS error monitoring, Request Metrics performance monitoring, and the producer of PubConf developer comedy show. You can find him online at @toddhgardner on Twitter or email him at todd@trackjs.com.
Related Resources
Twilio Docs
From APIs to SDKs to sample apps
API reference documentation, SDKs, helper libraries, quickstarts, and tutorials for your language and platform.
Resource Center
The latest ebooks, industry reports, and webinars
Learn from customer engagement experts to improve your own communication.
Ahoy
Twilio's developer community hub
Best practices, code samples, and inspiration to build communications and digital engagement experiences.