Lazarus: Twilio’s Cloud Scale Automated Microservice Remediation System
Time to read: 14 minutes
February 05, 2018
Written by

Is there anyone who likes being on call, waking up in the middle of the night to a buzzing pager, then having to execute a remediation runbook while half-asleep?
Most startups operate like this during the early phases of their company growth. As a company grows, this model of operation is neither sustainable nor an optimal use of engineering resources. To truly scale, you will need to look at automating frequent – and potentially risky – operational tasks. At Twilio, we built Lazarus, a command and control system to respond to events and automate runbooks.
Automating Frequent Remediation Tasks
At Twilio, we run thousands of microservices and over tens of thousands of instances. These microservices are owned and operated by many small teams. We strongly believe this is the best way to design and operate a large scale distributed system. An individual team is closest to the problem space and they can make the proper judgments for operational excellence. Incentives are aligned to build robust systems that can be easily maintained.
Service remediation is a common problem seen across all engineering teams. Most of the time, these remediation tasks consist of executing a set of steps (often documented in a runbook) for the service. Although these steps are not complex to execute, doing them consistently during high-stress events and outages is error-prone.
At this scale, system failure is not an exception but the norm. As service remediation is a complex problem space, it is impossible to solve 100% of your problems. Automating a select few key remediation tasks takes you a long way towards your goals. We could make 80% of the remediation pain go away by addressing just 20% of the problems.
By automating the frequently occurring remediation tasks, engineers are free to dedicate their time to solving complex business problems. In addition, engineer job satisfaction levels increase when they have fewer distractions from operational DevOps responsibilities.
Background: Nagios and the Path to Automated Host Replacement
Our journey towards automated remediation at Twilio began when we analyzed how to automatically restart a failed host. At Twilio, we use Nagios, a widely used system for host monitoring and alerting. Nagios allows you to remotely execute the Nagios plugin that can be used to monitor all the services running on a host.
At Twilio, all hosts have a healthcheck endpoint which answers the question: Should this host be in the load balancer?
The healthcheck endpoint aggregates the result of multiple checks running on the hosts. The healthcheck of the host is healthy if the status of all the checks on the host is OK. If the status of any check becomes CRITICAL, the host healthcheck becomes unhealthy. The initial idea was to replace a failed host when Nagios detected either a host failure or a healthcheck failure.
Unfortunately, this simple and straightforward idea ran into the realities of a large scale distributed system. For example, when there was a network partition, Nagios would incorrectly conclude that the host failed and trigger an errant host replacement.
The situation is aggravated further when multiple instances fail together. Many times in a distributed system the host healthcheck failure is a reflection of backend failures. In such cases, taking action on the host exhibiting the failure is not going to recover the service. When the healthcheck failure is caused by a backend failure, often all the hosts providing a particular service fail together. Any naive approach to replace a host may result in replacing every host for the service and ultimately result in a total service outage.
Working through those challenges, we realized we needed an advanced approach to automate failed host replacements.
Rising to the Remediation Challenge: Twilio’s Lazarus
Lazarus is the command and control cluster automation system we deployed at Twilio to address the challenges we were facing. When we started building Lazarus, we set out to predict when a failed host could be replaced. This system needed exposure to real world events to make the design robust against system and network failures in our large scale distributed cloud infrastructure.
The hardest part of the design was deciding when to pause remediation on hosts exhibiting a healthcheck failure. We first ran Lazarus in production with notification-only mode, sending out notifications when it ‘would’ have taken action. We then compared those Lazarus recommendations with what the on-call engineers did – or didn’t – do to remediate the failure.
This process revealed a lot of false positives where Lazarus’ actions were overly aggressive. Some of the issues uncovered during this process were:
- Downstream failures often resulted in multiple concurrent upstream service failures.
- External services outages on services like S3, DynamoDB, or DNS caused cascading failures where a significant number of services were affected.
- Network partitioning issues where Nagios triggered a false positive event.
- Multiple alarms received for the same entity. For example, occasionally Nagios fired multiple events on a single host (one for each NRPE check on the host).
- Healthcheck failures which service owners wouldn’t normally remediate. For example, when a host becomes unhealthy because of high system load, removing the host can cause a cascading load issue making things worse. In such cases, you want an alert with no remediation.
Designing Lazarus to Compliment Runbooks
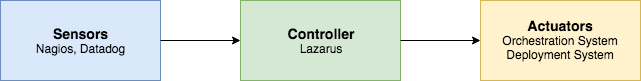
Lazarus is an event-driven remediation and runbook automation system. It works in conjunction with other platform components to provide an end-to-end remediation service. Lazarus acts as a command and control system for the network events generated by sensor systems like Nagios, Datadog and other application monitors and modifies service cluster state via our orchestration and deployment system.
As a command and control system for network events, Lazarus provides the following functionality:
- stale event filtering
- rate limiting
- circuit breaking
- resource locking
- precondition validation
- workflow execution
- user notifications
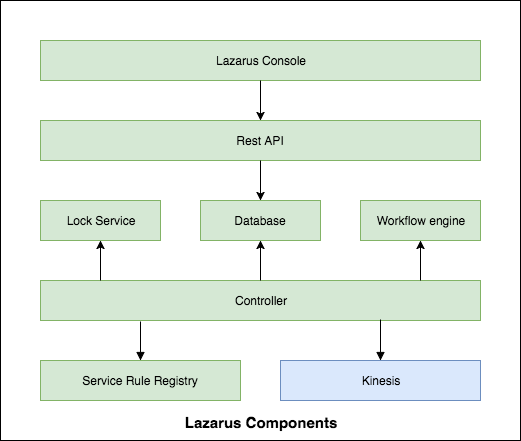
Following is a component diagram of the various subsystems of Lazarus:
Sensors: Feeding Events into the Lazarus Decision Engine
One of our system design goals was to keep failure detection independent of failure remediation. By decoupling the two, both the sensor systems and the remediation systems can evolve independently. It also provides a balance of power by distributing failure determinations over multiple systems. If all decisions are made by Lazarus, any systematic error in it can have a catastrophic effect on the total cloud infrastructure. Having multiple independent systems coming to a consensus mitigates the risk of one system reaching an incorrect conclusion. This reduces the probability of false positive actions on the service components.
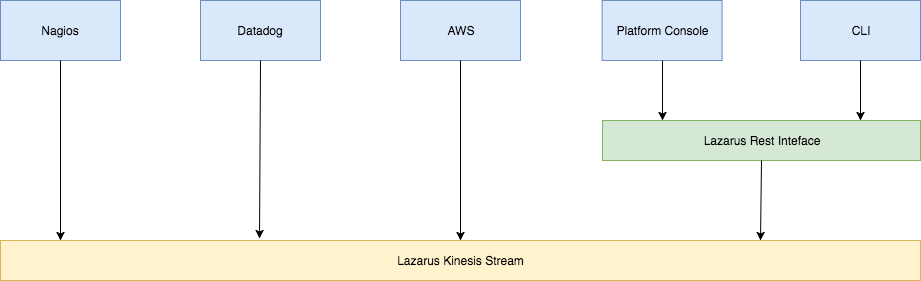
Lazarus is the gateway for all the network events for the purpose of remediation and automation. It accepts events from various sensors like Nagios, Datadog, command line tools, the platform console and AWS scheduled events. It handles various types of network events, for example HostDown, Healthcheck failure, AWS scheduled events and auto scaling events.
Lazarus has an easily extendable architecture. The support for future new event types can be easily added as we solve the next generation of remediation problems.
Lazarus accepts events over the following interfaces:
- AWS Kinesis stream: This is the primary destination for all incoming events. In each deployment region, Lazarus has a Kinesis stream which receives events in that region from various sensor systems.
- REST Interface: Events can be submitted to Lazarus over the REST interface. These events are deposited into the Kinesis stream of that region.
Specifying Lazarus’s Rules
Lazarus is an automation platform for multiple services. Actions for each service can be configured by specifying a set of rules. A rule is a YAML document that specifies how Lazarus is going to match and process an incoming event for that service.
Here is a sample rule for host replacement on a Nagios host down event:
Every rule has three sections.
Criteria
Each service is configured with a set of rules. The criteria section in the rule specifies how an event is matched with a rule. Some examples of parameters used in the criteria are:
- Event Type: NagiosHostAlarm, HealthcheckDown, AWSScheduledEvent
- Environment: dev, stage, prod
If none of the rules matches the event, the event is immediately escalated to the on-call engineers.
Precondition Checks
The precondition checks section specifies a set of guard conditions. All checks MUST pass before the action associated with the rule is scheduled. Examples of precondition checks are:
- MinActiveHosts: This check verifies if the number of instances in the service cluster is above the minimum active host threshold.
- MaxActiveHosts: This check verifies if the number of instances in the service cluster is below the maximum active host threshold.
- HealthCheckDown: This check verifies if the host healthcheck is unhealthy or unreachable. This is a critical check and helps avoid false positive actions in the case of network partitioning. Lazarus verifies the healthcheck of an instance from three different availability zones.
- PeerCheck: This check verifies if the healthcheck on the other service instances are healthy. This is the main guard against downstream failures like a database failure. When such an event happens, the healthcheck on all the instances of the service will fail simultaneously and they will start alerting together. This check fails if other hosts in the service cluster are also reporting failures simultaneously.
Action
When all precondition checks pass, the action associated with the rule is scheduled on the workflow engine for execution.
Lazarus’s Workhorse: Workflow Engine
The Workflow Engine is a critical component of Lazarus and is used to execute all the remediation workflows. For example, the replace host workflow does the following:
- Acknowledge the page.
- Take the failed hosts out of load balancer.
- Clone the failed host and boot the replacement host.
- Once the replacement host is running, verify the host healthcheck is fine.
- Put the new host into the load balancer.
- Put the failed host into forensics state which can be later examined by the on-call engineers.
- Resolve the page.
- If there is any error in executing any of the above steps, escalate the page.
If everything goes well, on-call engineers will never see a page. Lazarus remediates the failure and restores the cluster state.
The workflow is specified as a YAML document and it is represented as a Directed Acyclic Graph of a set of remediation steps. The Workflow Engine executes the steps in the workflow document.
In most scenarios, the service owner never needs to implement any workflow. Each service is configured with a set of pre-defined rules and workflows. However, some services have unique requirements and implement customized workflows to extend Lazarus behavior to address their specific needs.
The Power Trio: Event Processing Logic
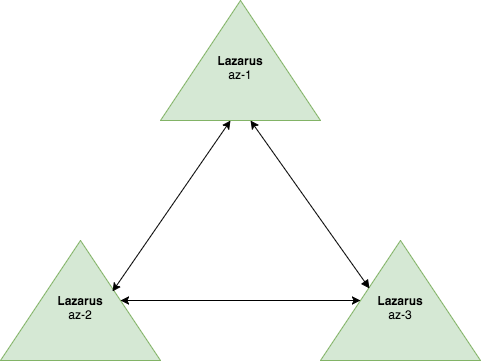
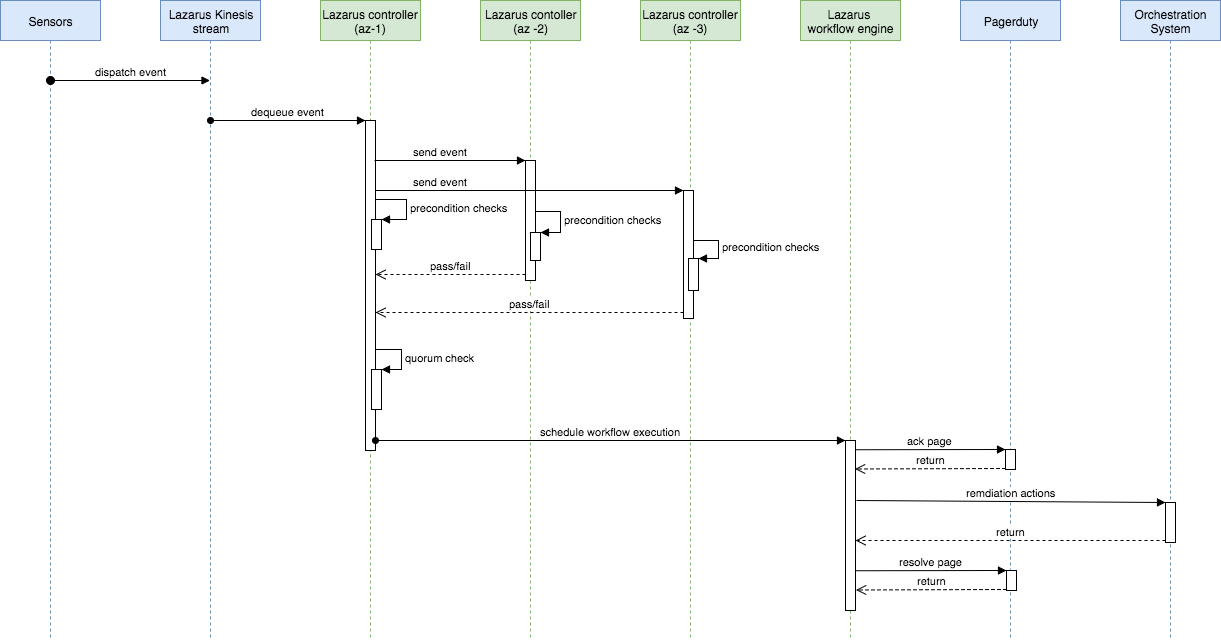
In every region, Lazarus deployment has three nodes. These three nodes form a cluster and collectively make a decision whether to trigger the workflow to remediate a failure.
All Lazarus nodes are symmetric in nature. Any Lazarus node can dequeue an event from the Kinesis stream. The Lazarus node which dequeues the event becomes the coordinator for that event and coordinates with the other two Lazarus nodes to make a decision on whether the workflow can be executed safely.
The event processing logic works as follows:
- One of the Lazarus nodes dequeues the event from the Kinesis stream and becomes the coordinator for that event.
- The coordinator node sends the event to the rest of the Lazarus nodes in that region.
- All Lazarus nodes process precondition checks independently and send the result back to the coordinator node for that event.
- The coordinator node waits for the minimum number of successful results as specified by the quorum parameter (in our 3 node deployment clusters, we use 2 as the quorum parameter)
- If the number of successful results meets the quorum parameter, the workflow associated with the rule is scheduled.
- If the number of successful results is fewer than the quorum parameter or timeout occurs while waiting for the result, no action is taken and the event is escalated to the on-call engineers.
World of Chaos: Multiple Failures and the Service Rate Limit
Under normal operating scenarios, the chance of multiple instance failures for any given service concurrently or within a short period is very low. Some scenarios where you may see a higher level of service failures are:
- Downstream failures: In a downstream failure scenario, the healthcheck on multiple instances starts failing simultaneously.
- Packet loss across different regions: In this case, backend systems are not reachable.
- Systematic error in the service software.
Multiple failures on any service is usually a sign of a complex problem and hard to automatically remediate. Lazarus does not attempt to take any action when multiple failures are seen for a service. Lazarus has two safety mechanisms to deal with this scenario and restrict its activities during this chaos.
First, wherever applicable, Lazarus rules include the PeerHealth check which ensures that other instances in the service cluster are healthy before taking action on the failed instance. This check restricts the remediation action when concurrent service failures happen.
Another safety mechanism is implemented through service rate limits. Lazarus monitors the event rate for the service over a 10-minute rolling window. When the incoming event rate for any given service exceeds a predefined threshold, the per-service rate limit kicks in and all Lazarus actions on that service are temporarily suspended until the service failure rate falls below the threshold.
The Apocalypse: A Circuit Breaker for Nightmare Outage Scenarios
Everything fails all the time in distributed cloud systems. Some failures are particularly catastrophic.
Think of a nightmare scenario such as an S3, DynamoDB or DNS outage. This results in a multitude of service failures occurring in totally unexpected ways. It’s impossible for any human to comprehend the dependencies baked into a large scale distributed system.
What should any remediation system do in such a scenario? Each service should be designed to be resilient against such failures and recover automatically after the outage is through. However, from the remediation system point of view, the best course of action is to take no action and wait for the turbulence to subside.
Lazarus monitors the incoming rate of events across all services. When the number of unique service failure exceeds a certain threshold, the circuit breaker opens and all actions are temporarily suspended until the event rate falls below the threshold. Lazarus uses a 10 minute rolling window to monitor incoming events. The circuit breakers are scoped per AWS region.
Such apocalyptic failures are rare. However, from time to time we do see the circuit breaker kicking in. In such scenarios, Lazarus starts escalating events right away and lets human operators take over the recovery process.
Keeping It Exclusive: Resource Locking
All sensors work independently and it’s possible that multiple events can be generated concurrently for the same resource. To avoid multiple actions on the same resource, Lazarus rules specify a lock type to acquire before executing an associated workflow. Lazarus currently supports the following lock types:
- Host lock: When host lock is used, only one action can be scheduled on a particular host. For example, the HostDown Rule acquires an exclusive lock on a host before triggering the host replacement workflow.
- Service lock: When service lock is used, only one action can be placed on the particular service. For example, scaling event acquires an exclusive lock on the service so that multiple scaling events cannot be processed in parallel.
Proxy for Everyone: Parallel Pager Management
Pager management resilience is important when operating a large scale cloud infrastructure. In Twilio, we use Pagerduty for pager management. When we started integrating Lazarus with Pagerduty and looking at pager suppression, we had two choices on how to manage our pagers.
On one hand, we could let all events flow through Lazarus and have it decide whether to handle an event. If Lazarus could remediate the problem, it wouldn’t pass through a page. Otherwise, it would create a page and escalate the event to the on-call engineers. Unfortunately, that would put Lazarus in the pager escalation critical path. It is suboptimal to use this approach as paging must continue to flow even when Lazarus itself is not available.
Our second option (and the one we chose to use) is to have sensors and monitoring systems create the page directly and notify Lazarus in parallel. The event payload submitted to Lazarus contains the incident key. As Lazarus receives the event, it uses the incident key to correlate the event with a page and act on the page to acknowledge and resolve it only if it can address the issue.
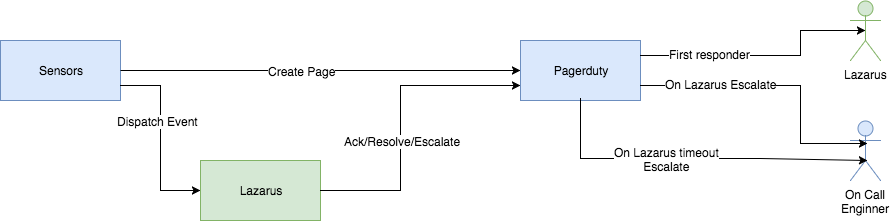
Lazarus is a user in the Pagerduty system. In all Pagerduty escalation policies, Lazarus is present as the first responder. On-call engineers are next in the escalation policy.
Lazarus has 60 seconds to acknowledge a page. When Lazarus receives an event, it first runs its precondition checks. If the checks pass, Lazarus acknowledges the page and schedules the remediation workflow. Otherwise, it will escalate the page to the next level in the escalation policy. If Lazarus fails to acknowledge or escalate the page because of an unexpected scenario, Pagerduty will automatically escalate the page after the 60 second timer expires. This method keeps Lazarus out of the critical path of paging delivery.
Fighting “Yet Another Tool Syndrome”: Configuration Management
Platform tools are complex. You need to have a flexible and configurable architecture to meet your current needs and still plan to accommodate future changes. This flexibility often comes at the expense of the configuration complexity in a system. Our goal was definitely not to build yet another tool™ where the developers go through a lengthy configuration process and are reluctant to onboard the service.
Lazarus has a flexible configuration management framework. Of course, in reality, when you are running thousands of services flexibility in configurations becomes another nightmare when onboarding new services and maintaining those configurations as new features are added.
We took an opinionated approach to solve our service configuration management. Instead of on-boarding each service one at a time, we categorized the services in various buckets with similar remediation requirements. Each such bucket is called a profile. Some examples of remediation profiles are:
- stateless
- stateless_with_standby_pivot
- elastic_search
- cassandra
We have kept the Lazarus onboarding process simple. With just a few clicks you can enable your service for Lazarus remediation by opting into one of the above profiles.
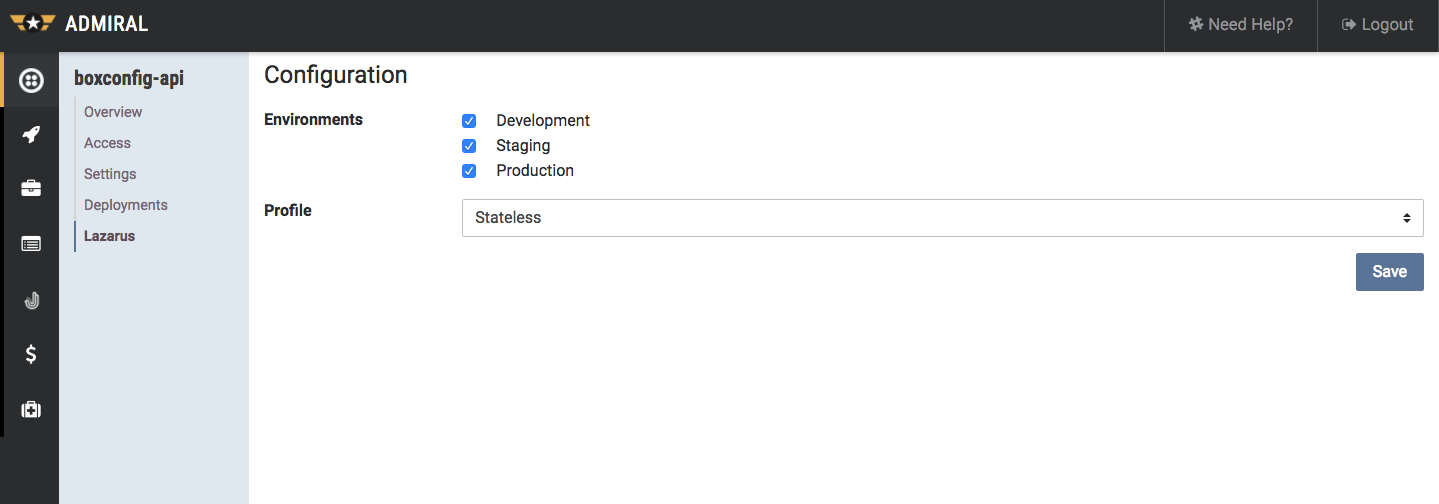
Each profile comes with a prepackaged set of template rules and workflows. For example, in the stateless profile, we have rules like:
- HostDown
- HealthCheckDown
- AWSScheduledEvent
All the rules and workflows for the service are automatically generated from the profile template.
Another benefit of using a profile based approach is when we enhance these profiles with new rules and features all the services subscribed to them automatically receive the refreshed configurations.
Each profile has a set of customizable parameters that can tune Lazarus’s behavior for a service-specific need. These parameters have appropriate defaults targeting “good enough” behavior for a variety of services. However, in some cases, these parameters need an override. For example, the default value for workflow_timeout is 30 minutes. If a workflow takes longer than that, the service owner can set a higher value for workflow_timeout.
We have made an extensive effort to keep the configuration interface of Lazarus simple. We’ve adopted the philosophy of convention over configuration. In most scenarios, all you need to do is to subscribe to a profile which matches your service. This approach has resulted in effortless Lazarus adoption and currently 70% of services and 90% of hosts in Twilio’s infrastructure are running with the Lazarus remediation service.
How Lazarus Handles Notifications
Service owners may not want to wake up in the middle of the night – however, they do want to know what’s going on with their services. Lazarus comes with a notification engine which supports notification over:
- Slack
- Pagerduty
Lazarus generates notification messages at critical steps of the remediation process, for example, when the event is acknowledged, resolved or escalated. By default, Lazarus automatically configures each service with team based notifications. The notification channels can be further customized for each service as needed.
Lazarus Remediation Auditing & Reporting
Lazarus maintains a detailed record of all events received and actions performed. These events and the action traces are available via a REST interface. Twilio’s platform console provides an aggregated view of Lazarus events across various AWS accounts and AWS regions.
Lazarus Event List Page
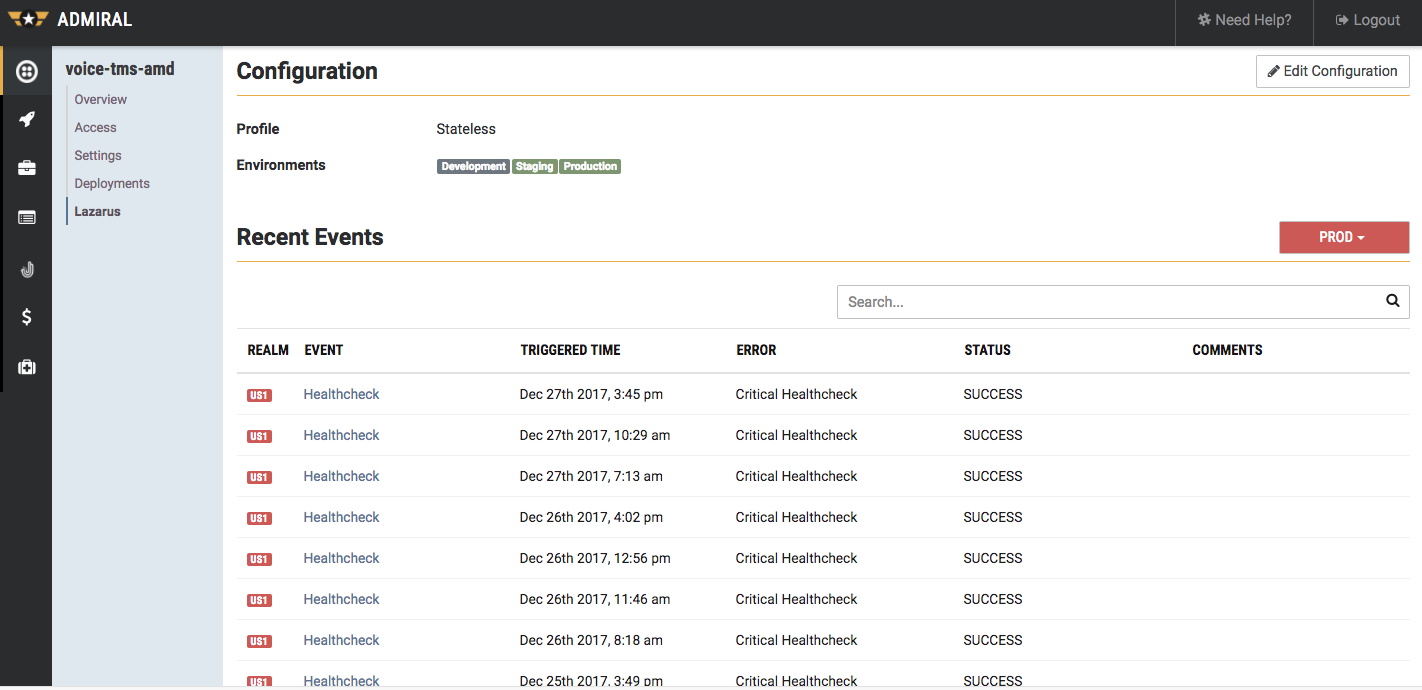
The event details page provides vital insights into any service failure and remediation steps. Many times this provides important inputs for critical failure postmortems.
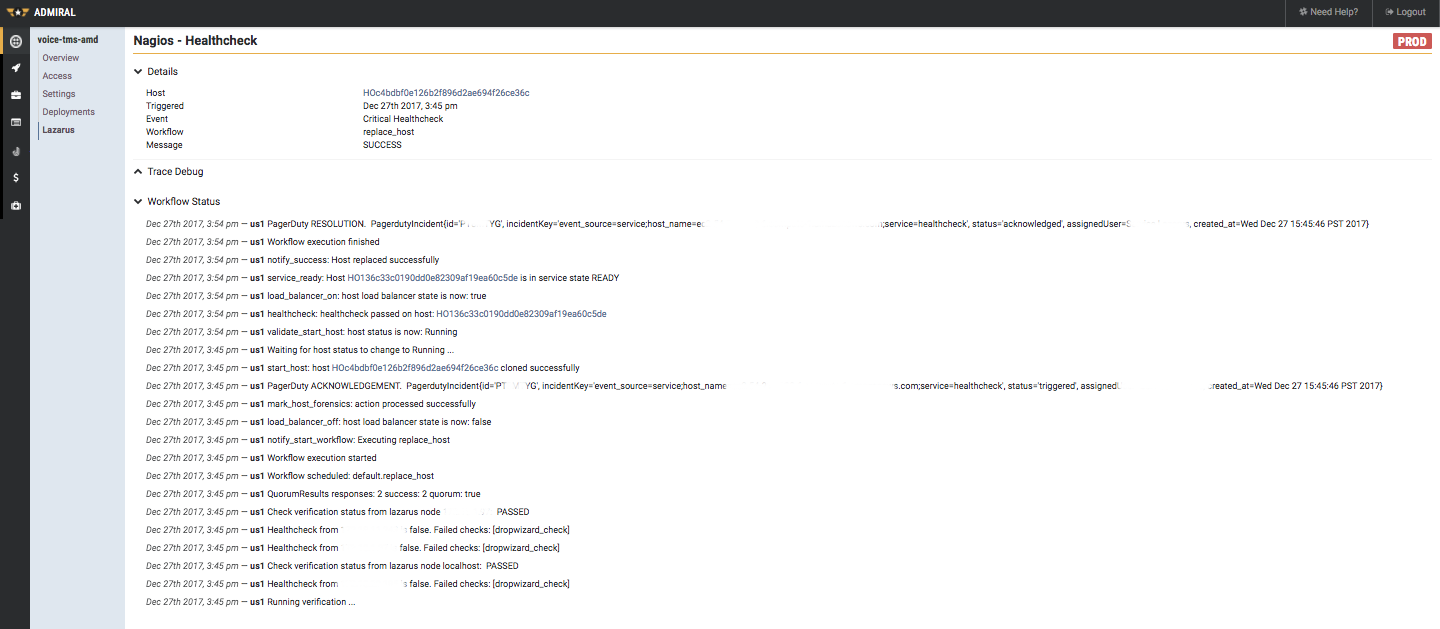
Lazarus Event Details Page
Lazarus: Building Cloud Scale Automated Remediation for Microservices
As Twilio grew in size, the need for a tool which automated some of our runbooks and provided automated remediation was a necessity. Without a tool like Lazarus, engineers develop pager fatigue as the frequency of midnight pages adds up. That engineering expertise is best used to solve complex problems… not to repeatedly perform mundane host recovery tasks. Working at cloud scale means you need a robust, easily maintainable system which can automate common recovery tasks.
Of course, an isolated event is far easier to act upon and automate for remediation. A multitude of events in parallel is a sign of complex failure and something you only want to approach delicately, if at all. These complex failure scenarios are hard to automate and often best left for on-call engineers to fix. Twilio’s approach therefore was to concentrate our effort on building a system which:
- Avoids false positive cases: the remediation system is incorrectly executing the remediation workflow when the service is healthy.
- Minimizes true negative cases: the remediation system did not handle the recovery where the system has failed and hence it resulted in escalation.
We have been running Lazarus in production for the last two years with great success. Currently, 90% of the instances in the Twilio cloud infrastructure are running with Lazarus remediations enabled. Lazarus works hand-in-hand with our on-call engineers to make Twilio’s services significantly more resilient. Our engineering team is happy with Lazarus’ capabilities and ability to tread through the unpredictable landscape of system and network failures in distributed systems at cloud scale.
Thank you to the Platform Orchestration Team, and especially Leads Gireesh Sreepathi and Sushil Prasad, for your efforts bringing Lazarus to life. Learn more about work on Lazarus from SaraAnn Stanway, who interned with the team.
Sushil Prasad is a lead development engineer for Lazarus on Twilio’s Platform Orchestration Team. He loves to work on challenging distributed system problems at scale. You can get in touch with him at sprasad@twilio.com.


Related Resources
Twilio Docs
From APIs to SDKs to sample apps
API reference documentation, SDKs, helper libraries, quickstarts, and tutorials for your language and platform.
Resource Center
The latest ebooks, industry reports, and webinars
Learn from customer engagement experts to improve your own communication.
Ahoy
Twilio's developer community hub
Best practices, code samples, and inspiration to build communications and digital engagement experiences.