Video Insights
Warning
This documentation is for reference only. We are no longer onboarding new customers to Programmable Video. Existing customers can continue to use the product until December 5, 2026.
We recommend migrating your application to the API provided by our preferred video partner, Zoom. We've prepared this migration guide to assist you in minimizing any service disruption.
Video Insights brings self-service tooling to the Twilio Console to provide analytics and aggregations for observing your application, discovering trends, and troubleshooting rooms and participants.
Some of the key capabilities are as follows:
- Dashboard - Usage and quality metrics across all your rooms and participants.
- Detected issues - Rooms and participants are tagged based on quality metrics observed during the call.
- Quality metric graphs - Per-interval quality metric graphs for all participants.
Video Insights is free for Group, Peer-to-Peer, and WebRTC Go Room developers and is available for any applications built with Twilio Video's Javascript, iOS, and/or Android SDKs.
Visit the Video Insights Dashboard in the Twilio Console to get started.
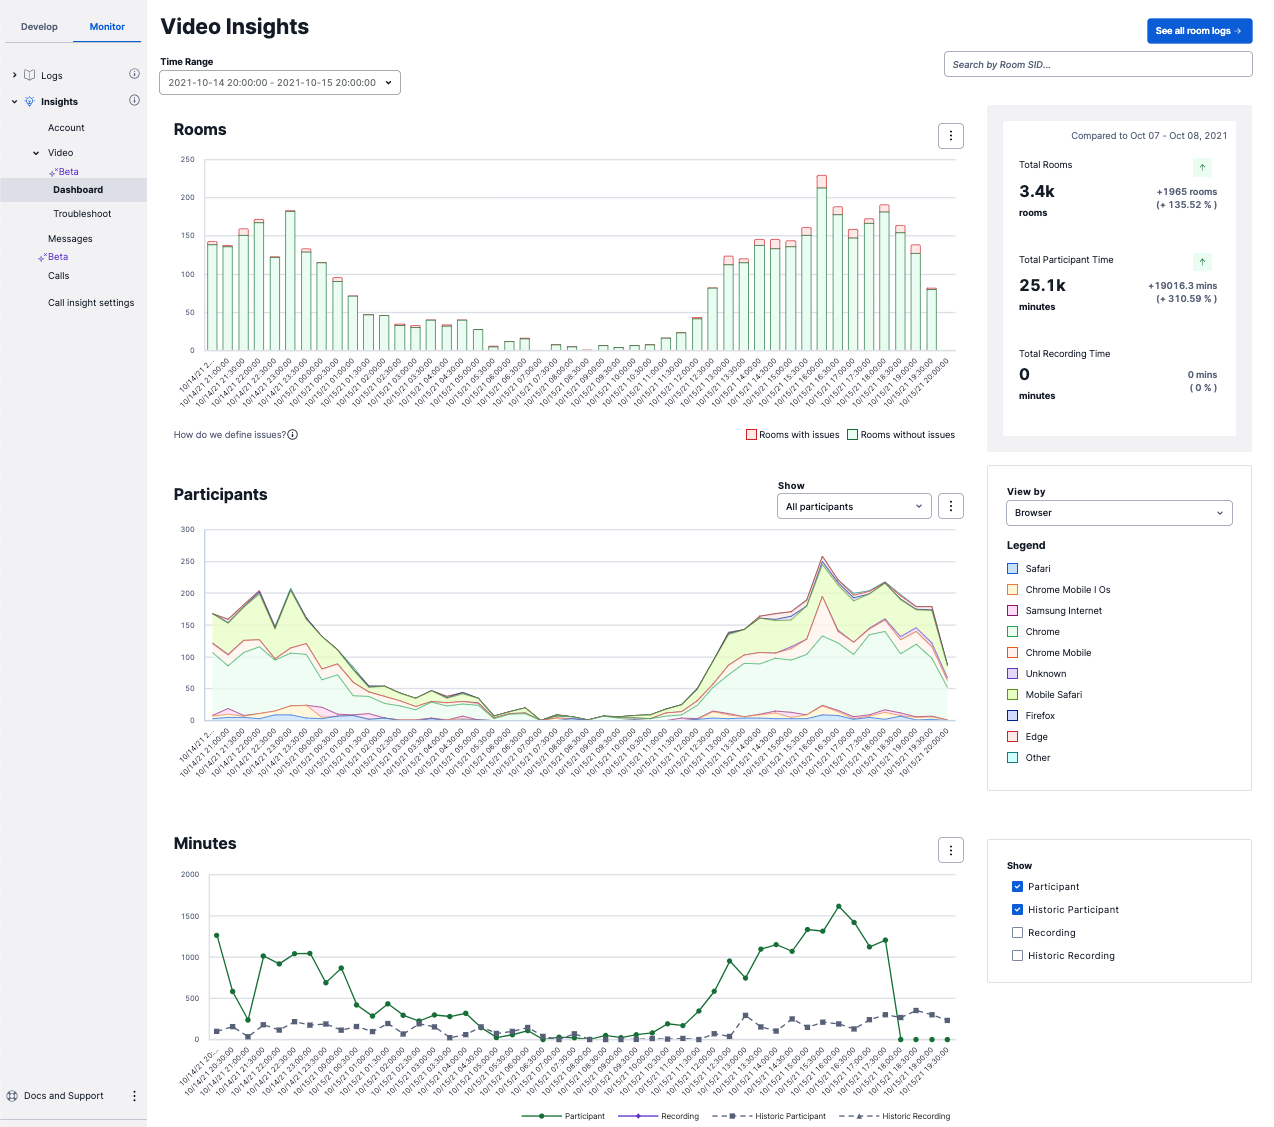
The Video Insights Dashboard provides a bird's-eye view of usage and quality metrics across all the rooms and participants associated with a given account SID. The dashboard provides aggregations that help teams move from being completely responsive to end-user complaints to observing quality and troubleshooting proactively. It also allows you to segment your participants by device and software characteristics such as browser or operating system, track week-over-week growth, or better understand day-of-week or time-of-day usage.
Info
All insights are tied to the account_sid that is associated with your Video Rooms. If you have subaccounts, each subaccount will have a unique Insights Dashboard.
The first graph provides the number of rooms that your account has created over time, with a distribution of rooms tagged as potentially having degraded quality. Please refer to the Detected Issues section for more information on the current list of issues that Twilio could detect and the associated thresholds used.
You can use this graph to monitor the distribution of rooms being tagged and then quickly dive into the rooms with issues.

The participant graph allows you to segment your participants by the characteristics of their device and software setup, and filter for those tagged with issues to discover trends that you can act on.

You can segment the area graph by:
| Device Manufacturer | The device manufacturers used by the participants in the time filter |
| Operating System | The operating systems used by the participants in the time filter |
| Browser | The browsers used by the participants in the time filter |
| Twilio SDK | The Twilio SDKs used by the participants in the time filter |
| Signaling region | The signaling regions used for the participants in the time filter |
| End Reason | The end reason observed for the participants in the time filter |
Info
Twilio parses the user agent to determine the Device Manufacturer, OS, and Browser. "Unknown" for these values means the user agent available did not have the information.
You can filter the graph by:
| Participants with issues | Participants tagged with one or more issues. See Detected Issues for the current list and the associated thresholds. |
| Participants without issues | Participants not tagged with any Detected Issues. |
The minutes graph provides the number of participant and recording minutes over time, along with historical data from the previous period, to observe week-over-week growth and better understand day-of-week or time-of-day usage.
Info
The minutes provided are aggregated by the participant durations in seconds, and thus are not 1:1 with the minutes you will be billed for. Learn more about how billing works.
The Rooms page allows you to filter and explore your rooms from the past seven days for Group and P2P Rooms, and from the past two days for WebRTC Go Rooms.
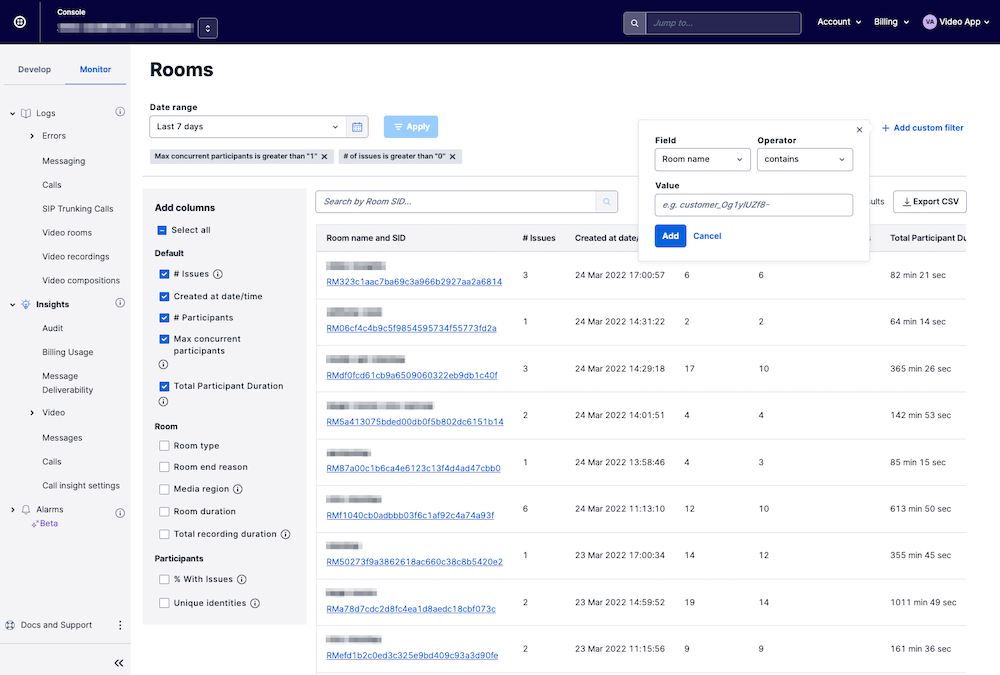
Editing the columns displayed
To the left of the table in the image above, you can see an "Add columns" section, which you can use to add and remove the columns displayed in the table.
Adding custom filters
In addition to filtering by datetime and searching by the Room SID, the rooms page offers flexible filtering to enable you to discover usage and quality trends in your rooms. When adding a custom filter, you select a field, an operator, and an expected value. Here is an example of how to add a custom filter to query for rooms that have Max concurrent participant = 1:

Below are the fields you can filter on using the custom filter:
| Field | Description |
|---|---|
| Room SID | The unique string that Twilio generates to identify the Room resource. |
| Room Name | The application-defined uniqueName for the Room resource. |
| Room type | The application-defined room type. |
| Media region | The media region that was used by Twilio's Selective Forwarding Unit (SFU) to exchange media between participants. Only applicable to Group rooms. |
| Room end reason | The reason for the room ending. |
| Room duration | The room's duration. Units required for filtering are seconds. |
| # Participants | The number of participants that connected to the room over its lifetime. Note that a "Participant" is an instance of a connection to the room, meaning that if an end-user leaves and rejoins the room, there will be a new Participant SID generated and this will count as 2 distinct Participants. |
| Unique identities | The number of distinct application-defined uniqueIdentities across all the Participants that connected to the room. |
| Max concurrent participants | The maximum number of participants that were in the room at the same time. |
| Total participant duration | The total duration that participants were connected to the room, summed across all participants. Units required for filtering are seconds. |
| Total recording duration | The total recording duration, summed across all the recording tracks in the room. Units required for filtering are seconds. |
| # of issues | The total number of Detected Issues observed in the room, summed across all participants. |
| # of participants with issues | The total number of participants in the room that were tagged with Detected Issues. |
| Issue type | The type of Detected Issues observed in the room. |
Saving and sharing queries
As you add columns and adjust the filters, the URL is updated to depict the state of the page. This means you are able to bookmark queries/selected columns and share link(s) with teammates.
The Room Summary provides metadata about the Room, surfaces any Detected Issues, and lists the room's participants.
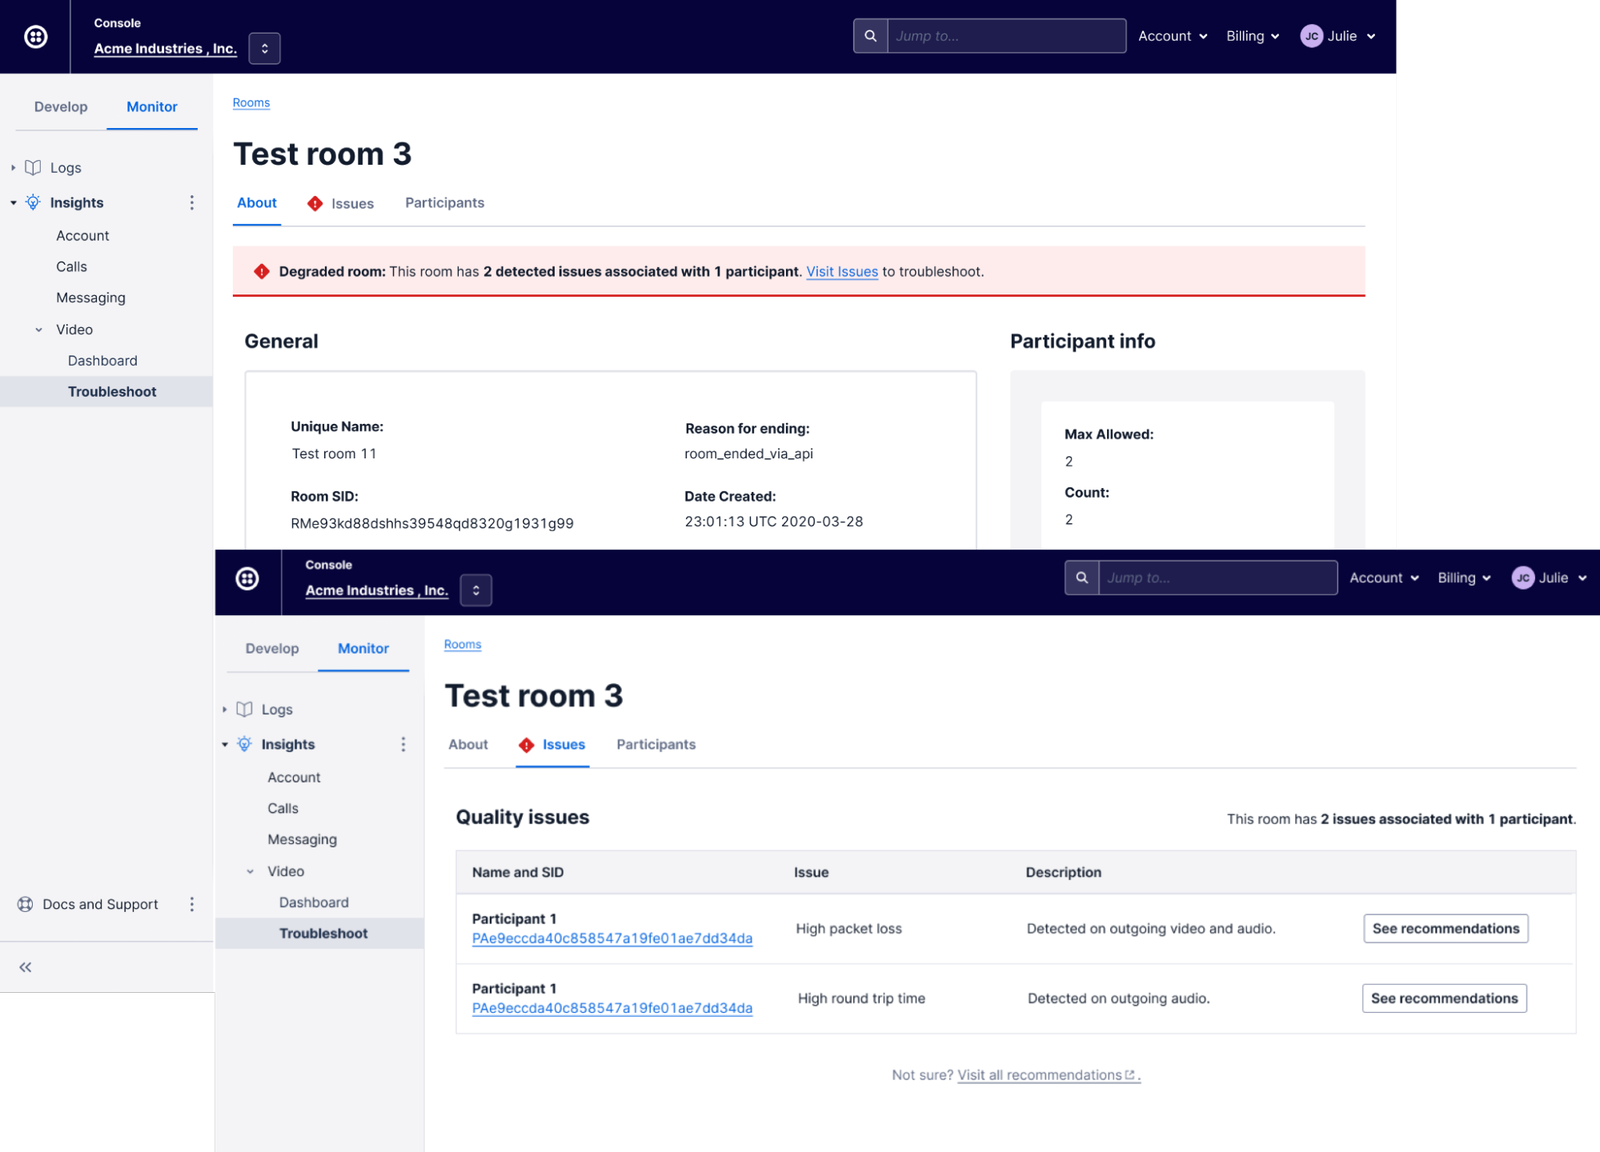
The Participant Summary provides details to help you troubleshoot issues and assess the media quality for individual users. For each participant, you are provided relevant participant characteristics (ex. OS, Browser, SDK versions) as well as per-interval quality metrics (bitrate, packet loss, round trip time) for the duration of their time in the Room.

Quality metrics are provided on a per room, per participant basis and are displayed in 10 second intervals. On the send (publishing) side, metrics for bitrate, packet loss, and round trip time (rtt) are provided on a per track basis to assess the quality of the participants outgoing audio or video. On the receive (subscribing) side, the total inbound bitrate for the connection is provided to help you diagnose when a participant has low downlink bandwidth.
A few things to note:
- Quality metrics are sourced client-side from the WebRTC getStats() function and then processed
- You may see multiple video tracks for a given participant. This will happen if
- you implement the behavior of unpublishing / publishing tracks when an end-user turns their camera off, or
- an end-user shares their screen
- If you are using simulcast, the layers are merged to provide one metric for a given track. Please refer to the below sections for how these are calculated.
Send Tab (outgoing metrics)
Bitrate
Bitrate refers to the rate at which data (measured in bits) can be transferred between two endpoints in a given period of time. Low uplink bandwidth can lead to video freezing, video downscaling, frame-rate drops, and choppy audio. In addition, exceeding the available bandwidth of a receiver can overwhelm their network, cause degradation of the media quality, and potentially lead to dropped connections.
As mentioned above, bitrate is provided on a per track basis on the send side. Please refer to the Minimum Bandwidth Requirements documentation to better understand the bitrates required for the associated track characteristics.
If you have simulcast enabled, the bitrate you will see with video tracks is based on the sum of the bandwidth for all the layers.
Packet Loss
Packet loss is the measurement of packets that are expected but never arrive. High packet loss can result in frequent video freezing, video frame rate drops, and choppy audio. Packet loss is usually caused by overloaded routers or high CPU load on the machine. Packet loss might also occur if there is a large number of routers in the connection path between a Participant and Twilio's servers.
If you have simulcast enabled, packet loss for video tracks is calculated by summing the packets lost and packets sent across all layers then applying the formula: (packets lost /( packets lost + packets sent)) * 100. This means that it's possible that the individual streams forwarded by the SFU to subscribers may have varying levels of packet loss.
Round trip time
Round trip time is the time a packet of data takes to travel from sender to receiver and back. High round trip time is the cause of lag in media playback and occasional video freezing and drops in video frame rate. It can lead to end-users talking over one another. Round trip time is usually attributed to slow or overloaded networks. High round trip times can also occur when a Participant connects to a Twilio server that is far from their location. See Video Regions and Global Low Latency for more information.
If you have simulcast enabled, the round trip time (rtt) displayed is the maximum round trip time of all the individual layers. This means that it's possible that certain streams forwarded by the SFU, based on the receiving participants downlink bandwidth, will experience less round trip time than what is displayed.
Receive Tab (incoming metrics)
Bitrate
The bitrate provided on the receive side is the total inbound bitrate received from the peer connection. Consistently low incoming bitrate can lead to video freezing, video downscaling, frame-rate drops, and choppy audio, regardless of the quality of the publisher's media.
If you are using Group rooms, the Selective Forwarding Unit (SFU) acts as the peer connection, so this metric will represent the total bitrate received from all participants for all subscribed tracks. If you are using P2P rooms, you will see the inbound bitrate received for each peer connection.
Info
The configured maxSubscriptionBitrate can impact this metric.
The Participant Summary provides characteristics about each participant that may be helpful for diagnosing issues. Some useful characteristics to look for are as follows:
| OS | The operating system and associated version used by the Participant. |
| Browser | The browser and associated version used by the Participant. |
| Device | The device manufacturer and model used by the Participant. |
| SDK | The SDK and the associated version used by the Participant. |
| Tracks Published | Number of published tracks of the participant. |
Info
Twilio parses the user agent to determine the Device Manufacturer, OS, and Browser. "Unknown" for these values means the user agent available did not have the information. It is also possible, based on the platform, that the user agent available is not 100 percent accurate. For example, you can only distinguish Windows 10 vs Windows 11 using an experimental API, User Agent Client Hints (UA-CH), and most browsers are incompatible with UA-CH.
Video Insights processes metrics and events and surfaces any potential issues detected by Twilio. The issues detected by Twilio are not exhaustive, but rather, are meant to provide a mechanism for easily identifying common issues and to assist in addressing issues in a more proactive manner. To start, Twilio is focusing on quality-related tagging on participants based on their published tracks (outgoing media). If any participants in the room are tagged with issues, then we will classify the room as having issues as well. The current list of detected issues is as follows:
| Issue | High Threshold | Issue Metadata |
|---|---|---|
| Participant Packet Loss | Cumulative packet loss >= 5% | Whether it was detected on the outgoing audio, video, or both. |
| Participant Round Trip Time | Average round trip time > 300 ms | Whether it was detected on the outgoing audio, video, or both. |
A few things to note:
- If packet loss or round trip time is detected on any of the outgoing tracks, then the participant is tagged as having an issue.
- It is possible that participants' metrics will exceed the thresholds for portions of their time in video call but will not be tagged with an issue. Tagging is based on the entire duration of the track to avoid over-tagging in cases where there are blips of poor quality but ultimately, the overall experience was acceptable. You can visit the Participant Summaries to further analyze the per-interval metrics over the course of their time in the room.
- Packet loss and round trip time are objective metrics that can be used to predict when an end-user could have had a degraded quality of experience. Quality of experience is subjective and thus, it's possible we detect an issue but the end-user was happy with the experience (or vise versa).
Detected Issues are used throughout the Video Insights product:
- Providing the distribution of rooms with issues in the Dashboard
- Providing the ability to filter by participants with issues in the Dashboard
- Providing the ability to filter by rooms with issues in the Rooms view
- Aggregating and surfacing any detected issues in the Room Summary
The data retention policy for Video Insights is as follows:
| Insights Dashboard | Rooms and Participants | |
|---|---|---|
| Group and P2P Rooms | 14 days* | 7 days |
| WebRTC Go Rooms | 2 days | 2 days |
* Filtering is available up to 7 days in the past. Historical data from the previous week is also available, but not filterable.