Queues stats monitoring in Flex
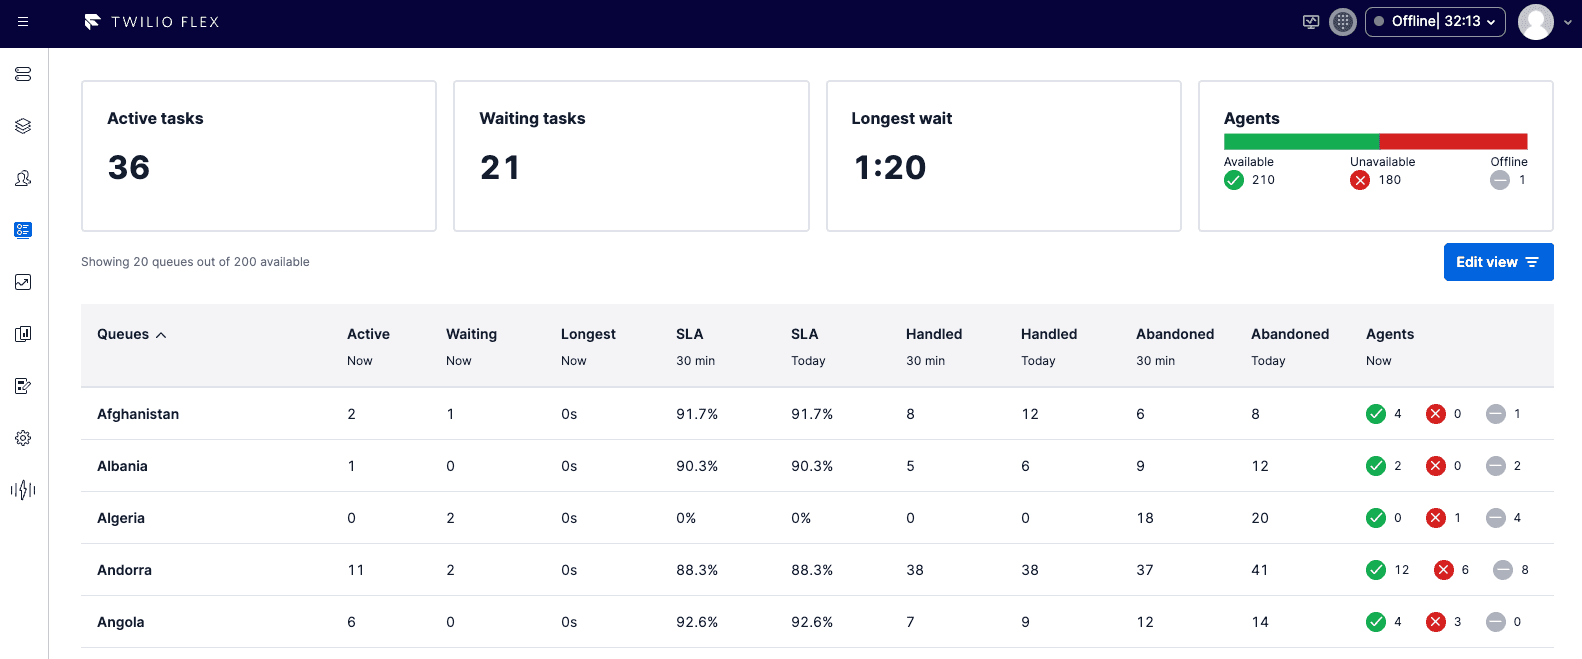
The Queues stats monitoring page displays metrics for inbound and outbound tasks for individual queues and across queues. These metrics are visible to users with the supervisor or admin role.
Info
All preferences can be configured directly in the Flex admin menu: Service Level Preferences.
View filters are available in Flex UI 2.4.0 and later.
Use the Edit view option to filter your view to just the queues and metrics that they want to monitor.
When you access the Real-Time Queues View page for the first time, the Edit View panel opens automatically to the right.
Once you've selected your view settings, they are saved in your web browser. If you close the browser, log out, or even delete cookies or browser history, your settings remain saved. However, if you use a different web browser, you must select your settings again in that browser.
In Flex UI 2.5.0 and later, you can choose which summary metrics you would like to highlight in the cards that appear above the table.
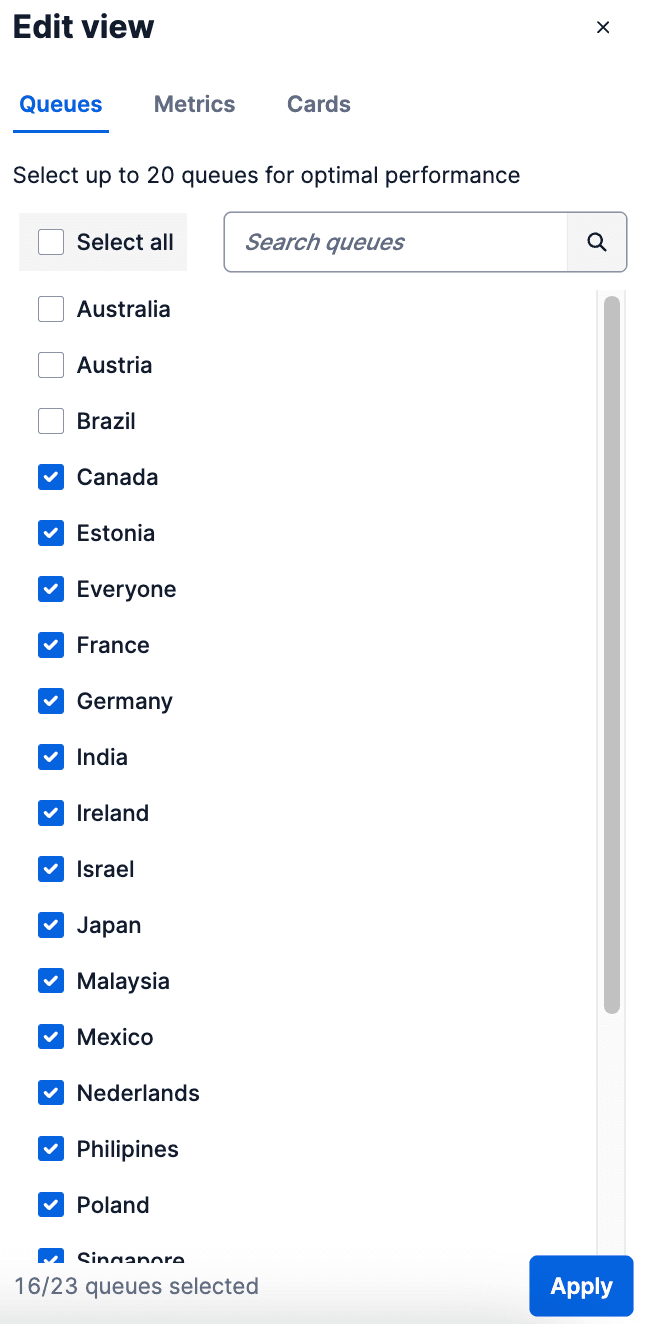
On the Edit View > Card tab, select the cards that you want to see. To avoid horizontal scrolling, select 6 or fewer cards. You can change the order in which the cards are displayed by clicking the six-dots move icon on the right side of the metric category name and dragging it up or down the list.
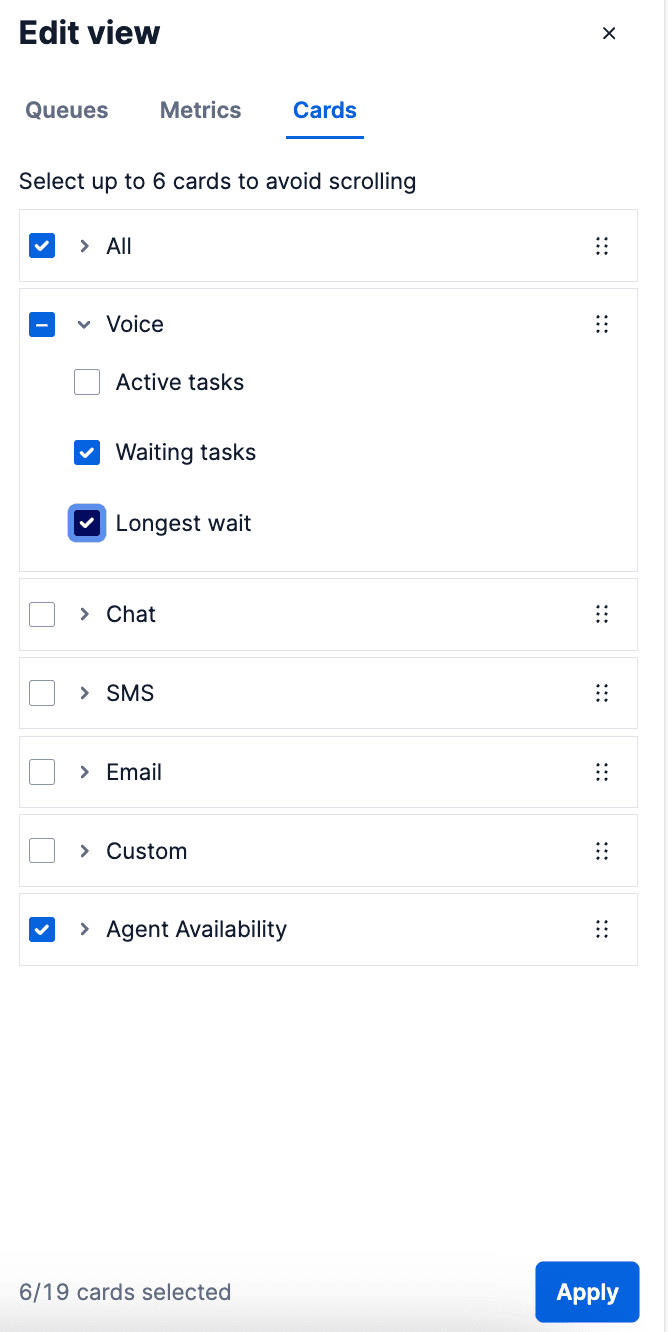
On the Edit View > Queues tab, select the queues that you want to see on this page. Use the search field to quickly find queues. When you're done, click Apply to save your changes.
-
Select 20 or fewer queues to avoid performance or latency issues.
- If you have 20 or fewer queues in your account, they are all selected by default.
- If you have more than 20 queues, the first 20 are selected automatically.
-
Only active queues are shown.
On the Edit View > Metrics tab, select the metrics that you want to view and monitor. When you're done, click Apply to save your changes.
-
Select 8 or fewer metrics. This best practice helps your users avoid horizontal scrolling.
-
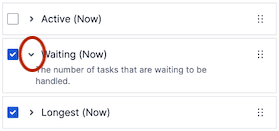
To see a description of a metric, click the arrow next to the metric name.
-
Change the order in which the metrics are displayed by clicking the six-dots move icon on the right side of the metric and dragging it up or down the list. The metrics table automatically updates to match the order of the metrics in the Edit view list.matches the order of the metrics in the Edit view list.
-
If you upgraded to Flex UI 2.4.x or later from an earlier version, the new metrics will appear on the dashboard after at least one call, SMS, or chat task in your Flex account after the upgrade.
These metrics reflect the current state of your contact center and are refreshed every 1-3 seconds.
The top of the page provides a consolidated view of Now metrics across the queues that you are monitoring. The table shows metrics for individual queues.
These Now metrics show inbound and outbound traffic:
- Active Tasks: The number of tasks that are currently being handled.
- Waiting Tasks: The number of tasks that are waiting to be handled.
- Longest Wait:The amount of time in seconds for the longest waiting task.
These Now metrics show agent availability:
- Available Agents: The number of agents that are currently in a state that enables them to accept tasks. This includes agents in all states that are set as available. You can have any number of custom statuses that are counted as available.
- Unavailable Agents: The number of agents that are currently in a state that prevents them from receiving tasks. This includes agents in all states that are set as unavailable, except for states that are set as Offline.
- Offline Agents: The number of agents that are in an Offline state or logged out of Flex.
One agent can be assigned to multiple queues. This means that the sum of agents in individual queues may not equal the total number of agents in the aggregate metric. If one agent is assigned to two different queues, the agent is counted in two queues in the table, but only counted once in global statistics.
For information on custom and default agent states, see Activity Resource.
These metrics are shown for individual queues:
- SLA: SLA is the ratio of connected conversations within a set SLA threshold out of all waiting customers in the queue. Short abandoned are not included and have no negative impact on SLA.
- Handled (Flex UI 2.4.x and earlier) or Accepted (Flex UI 2.5.0 and later): Number of customers connected to agents. Customers that were connected in the given time frame are included. The name of this metric changed to Accepted in Flex UI 2.5.0.
- Abandoned: Number of customers that have not connected to an agent. Customers who left the queue in the given time frame are included. Short abandoned are not included in this metric.
- Average Speed of Answer (ASA): The average amount of time a task waits in a queue before an agent accepts it. Available in Flex UI 2.4.0 and later.
- Average Handle Time (AHT): The average time, from start to finish, that a task was connected with an agent. This includes talk time, hold time, and wrap-up time. Available in Flex UI 2.4.0 and later.
- Missed Invitations: The number of tasks missed by agents. Available in Flex UI 2.4.0 and later.
- Average Abandon Time: The average amount of time a task spends in a queue before the customer disconnects without being connected to an agent. Available in Flex UI 2.4.0 and later.
- Average Talk Time: The average amount of time that a customer was connected with an agent. Available in Flex UI 2.6.0 and later.
- Rejected Invitations: The number of tasks declined by agents. Available in Flex UI 2.6.0 and later.
- Average Wrap up Time: The average amount of time a task is in wrap-up (after-call work) mode. Available in Flex UI 2.6.0 and later.
- No. of tasks: The number of tasks that entered the queue. Available in Flex UI 2.6.0 and later.
- Accepted within SLA: The number of tasks accepted by agents within the queue SLA. Available in Flex UI 2.6.0 and later.
- % accepted within SLA: Not recommended. Instead, use SLA, which shows the same information. This metric will be removed in a future release. The percentage of tasks accepted within the queue SLA out of the total number of tasks that entered the queue. Available in Flex UI 2.6.0.
- Short abandoned: The number of tasks in the queue that were abandoned by customer within the short abandon time. Available in Flex UI 2.6.0 and later.
- % abandoned: The percentage of tasks abandoned by customer before agent could answer out of the total number of tasks that entered the queue. Available in Flex UI 2.6.0 and later.
- % short abandoned: The percentage of tasks abandoned by customer within the short abandon time out of the total number of tasks that entered the queue. Available in Flex UI 2.6.0 and later.
- Completed (30 minutes) and Completed (Today): The number of tasks completed in the last 30 minutes or today. Available in Flex UI 2.7.0 and later.
These metrics are available in the following time frames:
- Last 30 Minutes: The metric calculated on customers that left the queue in the floating window of the last 30 minutes. Customers that left the queue more than 30 minutes ago are not included in this time frame.
- Today: The metrics calculated on customers that left the queue since the start of the day. The start of the day can be set using SLA Preferences and can occur once during a 24-hour day.
It is not possible to create a custom time frame.
These metrics are refreshed every 15 seconds.
You can sort the table with queue metrics by all columns except Available Agents. Click the header of the column or the time frame to sort the table by it. The table is sorted by the queue level metrics. Individual channels are not used for sorting.
You can customize how SLA and other metrics are calculated.
Info
These SLA preferences apply to Real-Time Queues View metrics only. If you want to modify SLA preferences for Flex Insights Historical Reporting, see Flex Insights SLA metrics.
The following preferences are available on the queue level:
- Reset Time: The time of day in the given time zone when metrics in the Today time frame are reset.
- Reset Time Zone: The time zone that should be used for the reset time.
The following preferences are available on queue-level combination:
- SLA Threshold: Waiting time that is a threshold for waiting time that is considered to be within SLA.
- Short Abandoned Time: Waiting time that is considered to be too short. All customers waiting less than this threshold are considered short abandoned. Short abandoned customers do not have any negative impact on the SLA.
Real-time queues stats can be customized programmatically using the Configuration API.
You can add additional columns to the Real-Time Queues View to show static data or dynamic data from Twilio APIs or other data sources. For more information, see Real-Time Queues View Programmability.
Public beta
Alerts is currently available as a public beta product and the information contained in this document is subject to change. This means that some features are not yet implemented and others may be changed before the product is declared as generally available. Public beta products are not covered by a SLA.
Alerts inform you when a metric, queue, or channel on the queues stats monitoring page has reached a critical or warning threshold.
- Warning: An issue is developing.
- Critical: An issue requires you to take immediate action.
Each alert is for a specific metric, channel (if applicable), and queue. Only admins can create and manage alerts.
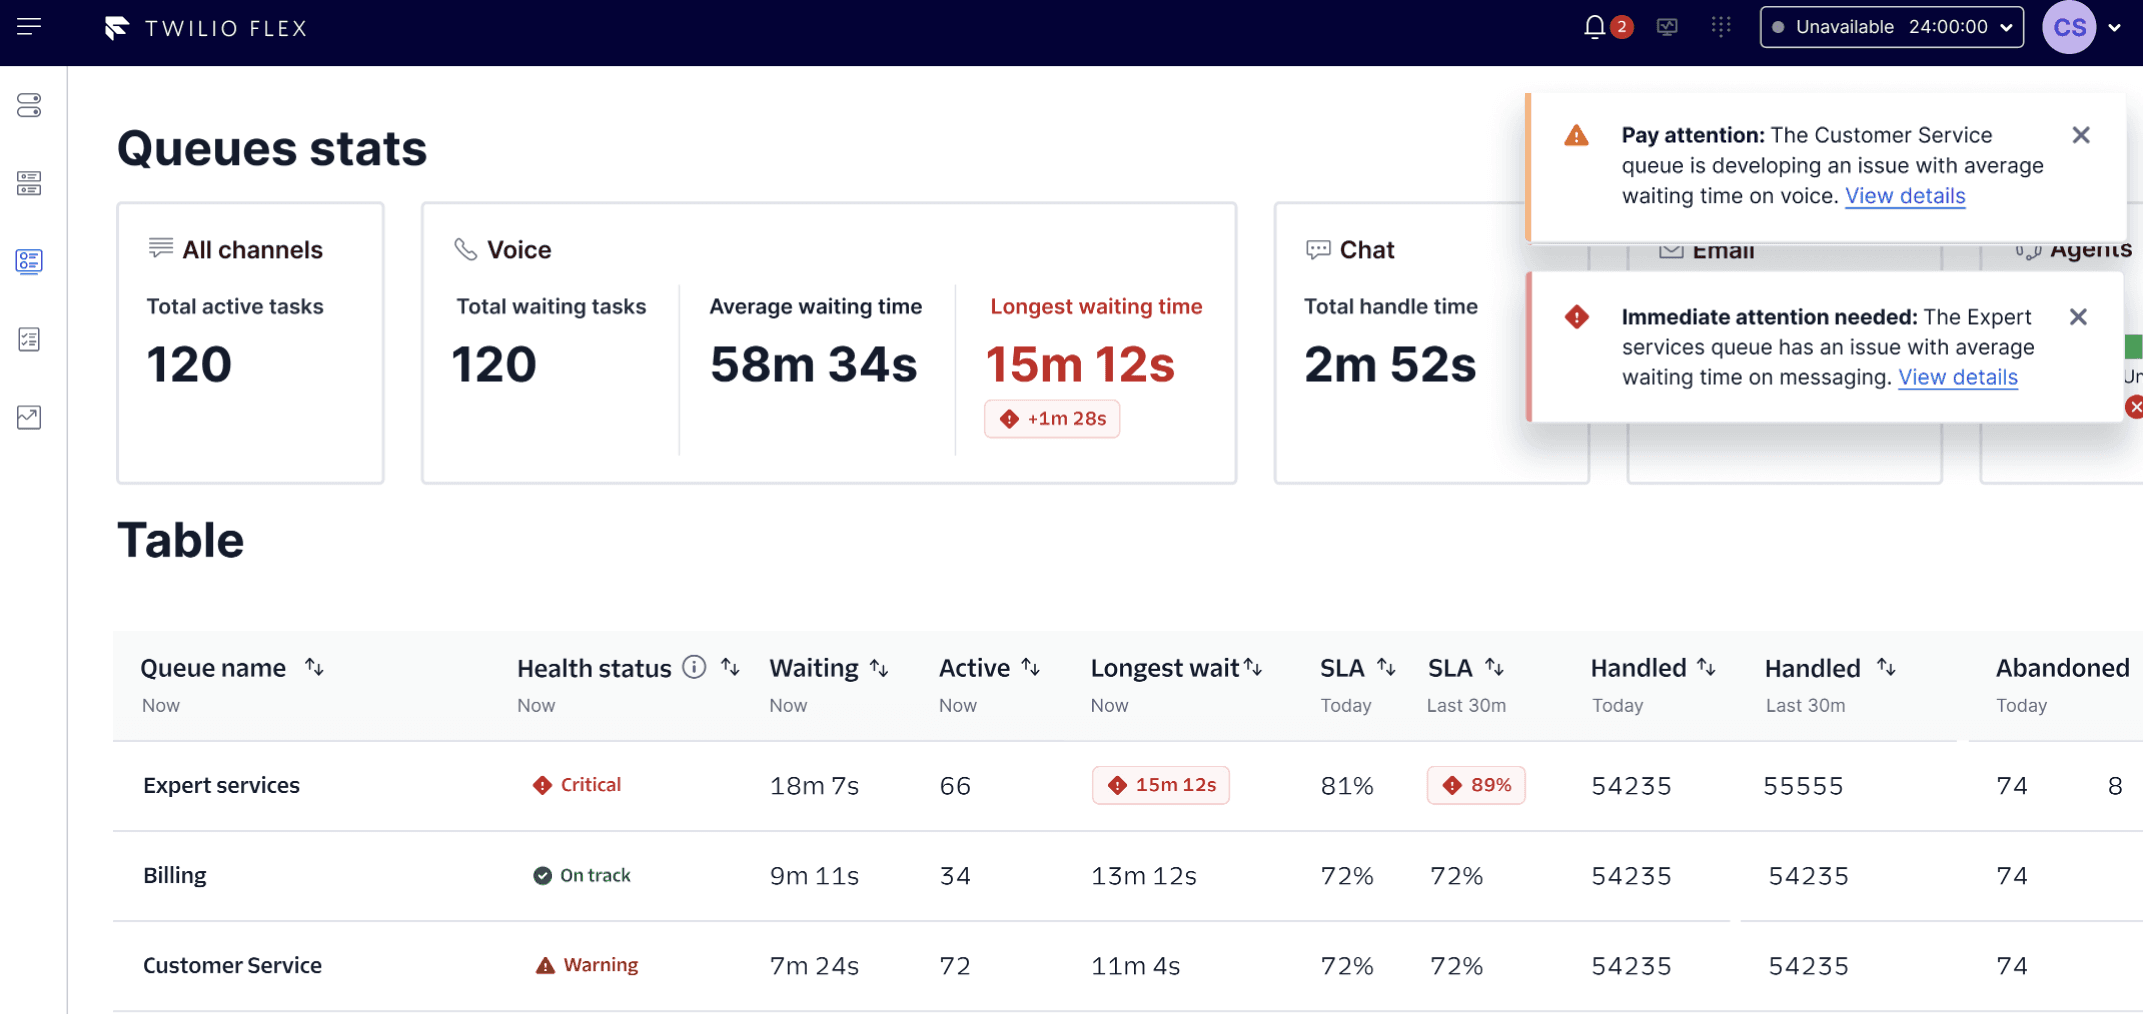
If a queue has multiple channels, alerts only appear for individual channels. Alerts won't appear at the queue level.
The Health status column shows the overall health of the queue based on the number and severity of ongoing alerts for the queue. Health status can be On track, Warning, or Critical.
If a queue contains only warning alerts, the health status of that queue is Warning. If a queue has one or more critical alerts, the health status for the queue is escalated to Critical.
If a queue has multiple channels, such as chat and SMS, then the queue's overall health status represents the combined health of all its channels. Metrics at the top queue level are not highlighted. Instead, alerts appear at the individual channel level. You can view health status at the channel level when you click into a queue.
Metrics that don't appear by default on the queues stats page can still have alerts. In this case, hold the pointer over the additional information icon next to the Health status severity. You'll see additional metrics that require attention. To select the metrics that you want to display on the dashboard, click Edit view > Metrics.
When a metric exceeds its threshold, you may see notifications in some or all of the following places, depending on your contact center settings:
- Flex inbox notification
- Pop-up message in Flex
- Browser push notification (appears if you're away from your Flex UI browser tab)
- Slack message
Notifications can only be turned on, turned off, or changed by an admin.
Rollup metrics aggregate data across the filtered queues and appear at the end of the Monitored queues table. Rollup metrics are available for the following queue metrics:
- Rollup shows the sum of the metric values
- Active (Now)
- Waiting (Now)
- Completed (30 mins) and Completed (Today)
- Abandoned (30 mins) and Abandoned (Today)
- Accepted (30 mins) and Accepted (Today)
- Shows the maximum value of the metric across filtered queues:
- Longest (Now)
- Shows the weighted average of the metric values:
- SLA (30 mins) and SLA (Today) , weighted by accepted and abandoned tasks
- Avg. Speed of Answer (30 mins) and Avg. Speed of Answer (Today), weighted by accepted tasks
To turn on the rollup feature, navigate to [Contact center settings] (https://console.twilio.com/us1/develop/flex/settings/features/ga) in Twilio Console and turn on Rollup metrics on Queue Stats Monitoring page.