Analyze email performance
Email Insights gives you near real-time visibility into email deliverability and recipient engagement. It brings aggregate email analytics into three prebuilt dashboards: Overview, Delivery Errors, and Audience Health. Email Insights is included at no additional cost.
To open Email Insights when logged into the Twilio Console, go to Monitor > Insights > Email.
Email Insights shows trends across all your emails.
To investigate a specific message, use Email Logs. If the messages are within the Email Logs retention period, click View Logs on a supported aggregate in Email Insights. This opens Email Logs with the same date range and filters pre-applied to that specific group of messages.
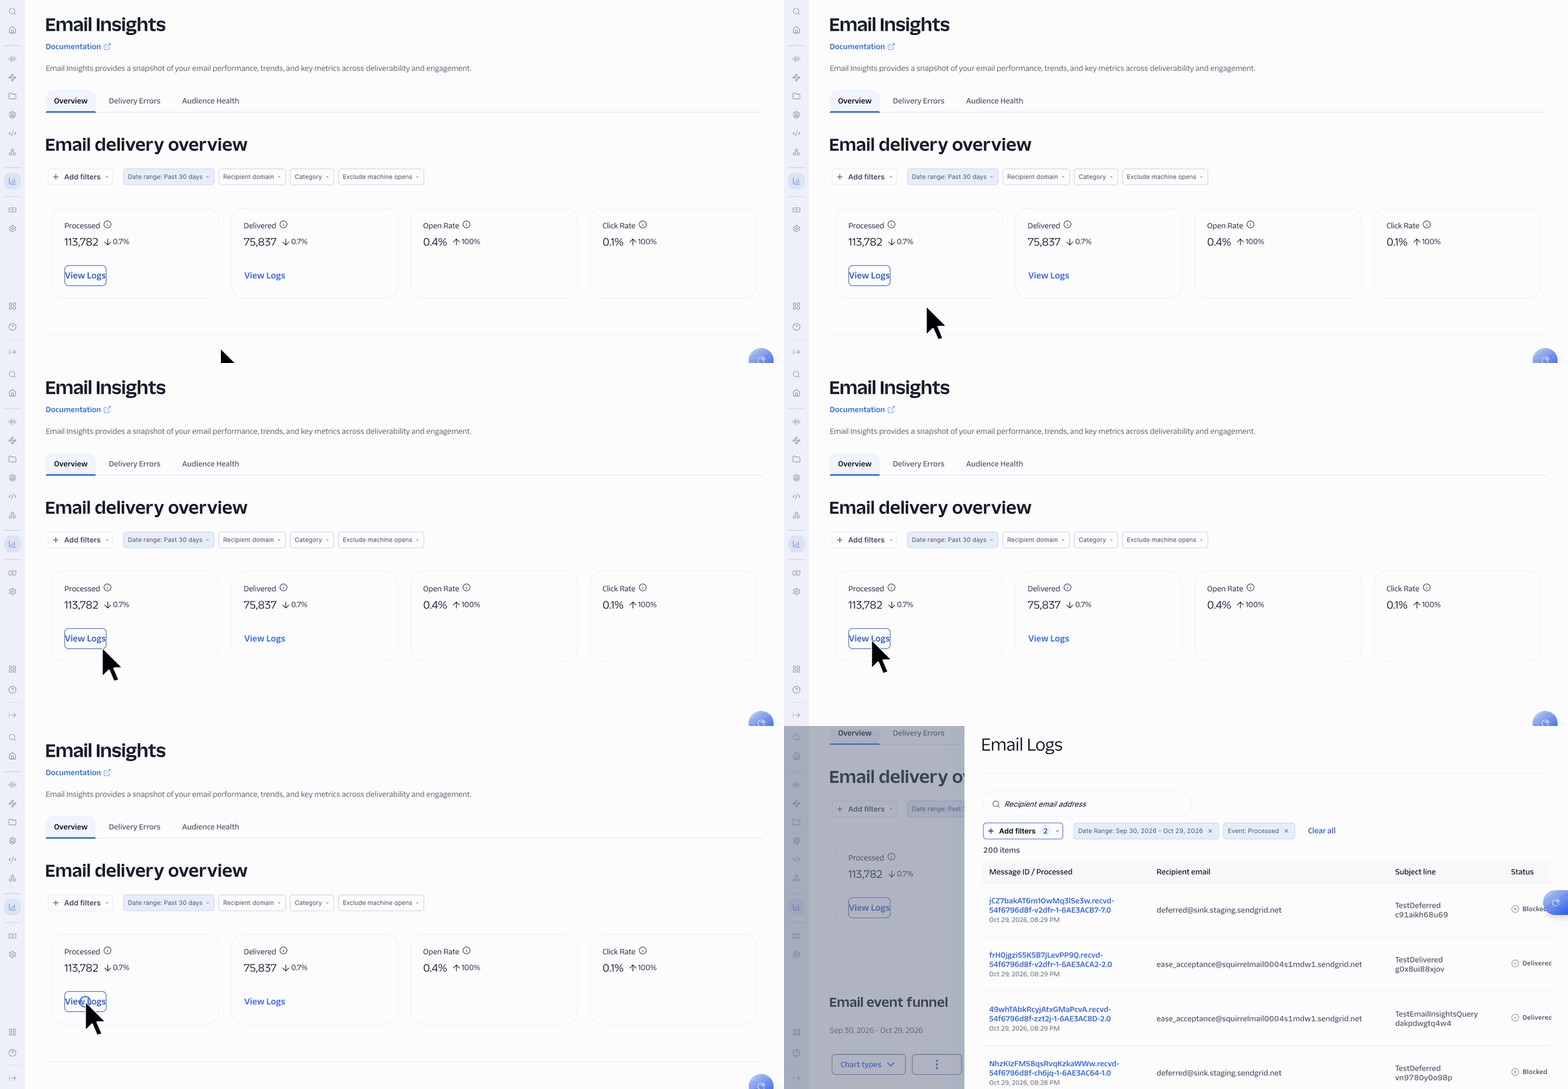
The Overview tab summarizes your email performance for the selected time range. It includes information about how many emails you sent, how many were delivered, and how your recipients are engaging with your emails.
The Overview tab contains the following data:
- KPI cards: Processed, Delivered, Open Rate, and Click Rate. Twilio calculates Open Rate as total opens divided by the total number of delivered emails. Twilio calculates Click Rate as total clicks divided by the total number of delivered emails.
- Email event funnel: Your message volume, separated by outcomes: dropped, processed, delivered, bounced, blocked, opened, clicked, not opened, and not clicked. If the gap between Processed emails and Delivered emails is larger than expected, check the Delivery Errors tab.
- Events over time: All event types over the selected date range. Click an event type in the legend to turn it on or off.
- Top devices by opens: Which devices or operating systems recipients are most commonly using when they open email.
Email Insights groups events by the date you sent a message, not the date an event occurred. Twilio groups an open that happens several days after you sent an email on the send date. The numbers for the last few days might rise as opens and clicks arrive for those sends.
The Delivery Errors tab shows bounced, blocked, and deferred email, which can help you diagnose delivery errors.
The Delivery Errors tab contains the following data:
- KPI cards: Counts of emails that had Processed, Bounced, Blocked, and Deferred outcomes.
- Bounced emails over time: Trends in the volume of bounced emails. Emails are grouped by their classification (Invalid Address, Technical, Content, Reputation, Frequency/Volume Too High, Mailbox Unavailable, and Unclassified).
- Blocked emails over time: Trends in the volume of blocked emails. Emails are grouped by block reason category (Invalid Address, Technical, Content, Reputation, Frequency/Volume Too High, Mailbox Unavailable, and Unclassified).
- Delivery issues by domains: Hard bounces, deferral rate, average delivery time, and blocks, grouped by recipient domain.
- Delivery issues by IP addresses: Hard bounces, deferral rate, average delivery time, and blocks, grouped by sending IP address.
| Event | Definition | What happens next |
|---|---|---|
| Bounce | The recipient mail server permanently rejected the message. This might happen because of an invalid address. | Twilio does not retry that recipient on future mailings. |
| Block | The recipient mail server temporarily rejected the message. This might happen because of a rate limit or a content issue. | Twilio does not retry that specific message, but you can attempt future mailings to the recipient address. |
| Deferred | Twilio attempted delivery but the receiving server asked for a retry. | Twilio retries that specific message during the retry window. |
| Drop | The message was not attempted because the recipient address is on a suppression list. | No delivery attempt is made. Remove the address from the suppression list to send to that recipient again. |
Bounce and block classifications group mailbox provider responses into seven categories:
- Invalid Address
- Technical
- Content
- Reputation
- Frequency/Volume Too High
- Mailbox Unavailable
- Unclassified
The seven categories stay the same, but the category a given response falls into might change as mailbox providers change their response codes and rejection messages.
To diagnose a delivery issue, follow these steps.
- Find a pattern on the Delivery Errors tab, such as a spike in Reputation bounces at
gmail.com. - Click View Logs to open Email Logs.
- Review the bounce reason for each message to find the specific SMTP response codes.
The Audience Health tab shows how your recipients interact with your email, which can help you understand audience engagement.
The Audience Health tab contains the following data:
- KPI cards: Open Rate, Click Rate, Spam Report Rate, and Unsubscribe Rate.
- Opens and clicks over time: Open and click trends across the selected date range.
- Opens across countries: Where opens happen, grouped by country.
- Engagement rates by domain: Open rate, click rate, spam complaints, and unsubscribe rate grouped by recipient domain.
- Engaged recipients over time: Engaged and not-engaged recipient trends.
- Frequency distribution: How many recipients received a given number of emails during the selected period.
- Time since last open: How recently recipients last opened an email.
Apple Mail Privacy Protection (MPP) and similar features might cause some opens to be recorded automatically by mail servers before the recipient views the message. Email Insights includes these machine opens in open counts by default. To see opens that weren't identified as automated, select the Exclude machine opens filter.
Each tab has a filter bar with a set of default filters. Click Add filters to choose from the other filters available on that tab. Most filters accept one or more values, separated by commas, and match email that has any of those values. Filters combine with AND logic, so each additional filter narrows the results.
| Filter | Available on tabs |
|---|---|
| Date range | All |
| Recipient domain | All |
| Category | All |
| Template | All |
| Exclude machine opens | Overview, Audience Health |
| Single send | Overview, Delivery Errors |
| Marketing campaign | Delivery Errors, Audience Health |
| Unsubscribe group | Delivery Errors, Audience Health |
| IP pool | Delivery Errors |
| Device type | Audience Health |
| Email client | Audience Health |
| Country | Audience Health |
| State / Region | Audience Health |
Info
Not every filter applies to every visualization on a tab. If a visualization can't use an active filter, it shows a message asking you to remove that filter, and the rest of the page still updates. Frequency distribution and Time since last open always show all your sending and don't change with filters.
Email Insights shows delivery and engagement events shortly after they happen. If the metrics for a recent send don't look updated, refresh the page.
Email Insights is designed to retain aggregate analytics for 13 months. History starts on August 20, 2026, and builds forward from there, so date ranges before that show no data. For date ranges older than Email Logs retention, the aggregate metrics remain available but View Logs isn't.
Email Insights shows all dates and times in UTC.