Alarms
Use Twilio Alarms to receive proactive email or webhook notifications when debugger errors or warnings occur in your applications. Alarms monitor for specific error codes or error types and trigger when a configured threshold is met within a defined time period.
You can view Alarms in Twilio Console or with the Twilio Workbench.
Regional availability
Alarms are available only in the US1 region. They aren't available in the IE or AU regions.
To view and manage Twilio alarms, go to Develop > Troubleshoot > Alarms in the Console. If you're using the legacy Console, go to Monitor > Alarms > Alarm history.
From the Alarms page, you can view alarm logs, manage existing alarms, and create new alarms.
The Alarms page has two tabs:
You can create and configure an alarm on the Alarms page (Develop > Troubleshoot > Alarms). If using legacy Console, you'll use the Alarms history page (Monitor > Alarms > Alarm history).
To create an alarm, click Create alarm, and then follow these steps:
- Enter a friendly name for the alarm.
- Select the conditions for your alarm from the following error types:
- Any error
- Any warning
- Any warning or error
- Specific error code
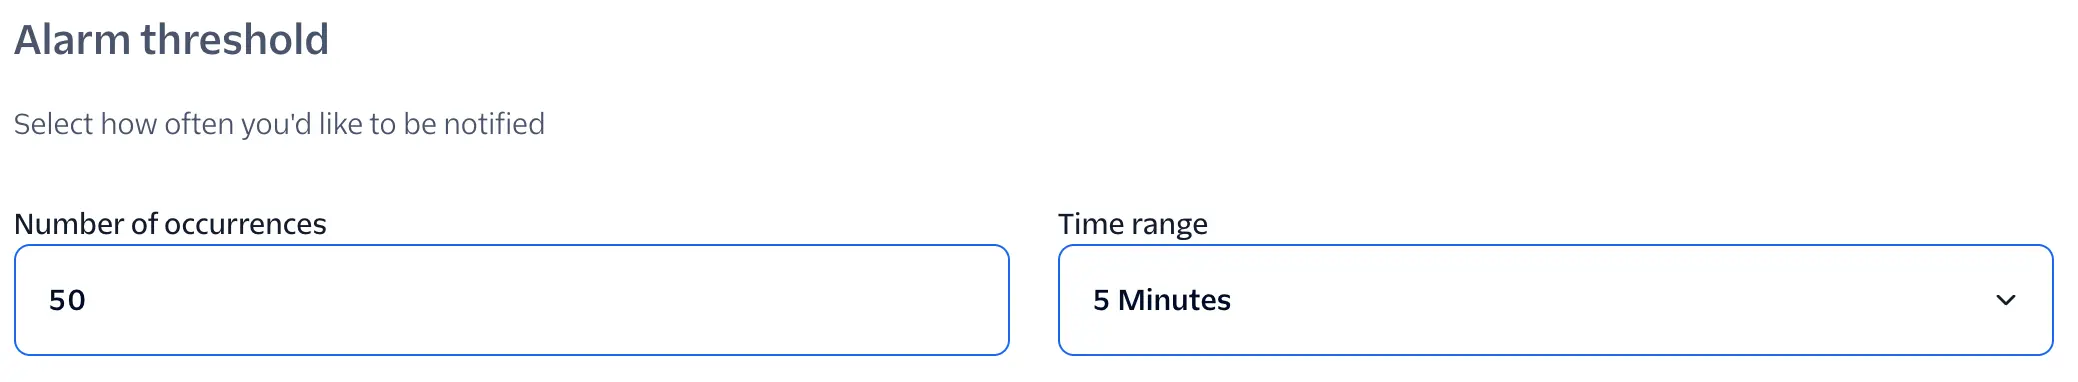
- Define the alarm threshold and period.
When the selected error type exceeds your defined threshold within the selected time period, this triggers an alarm. Choose from the following time periods:
- 5 minutes
- 15 minutes
- 1 hour
- 12 hours
- 24 hours
- Configure notification preferences. These preferences enable notification with either email or webhook. You can select any combination of these options. Provide the necessary email addresses, a webhook URL, or both, depending on which notification types you enable.
If you enable the email notification option, when an alarm is triggered an email is sent from no-reply@twilio.com containing the following information:
- Alarm name and trigger timestamp
- Threshold versus actual value comparison
- A View details button linking to the alarm log detail page
- An alarm configuration summary
If you enable the webhook option, the provided URL receives a request with a set of key-value pairs that describe the alarm. These keys are documented in the Alarms webhook payload data section that follows.
Info
Alarm notifications are triggered within 15 seconds of exceeding the defined threshold.
The Alarm Logs page displays historical alarm data and includes the following information:
- Timestamp (local): A timestamp indicating when the alarm occurred.
- Status: Indicates if an alarm is Recovered or Active.
- Name: Friendly name of the alarm.
- Product: The Twilio product associated with the alarm.
- Trigger threshold: The threshold for the alarm to trigger.
Selecting an alarm log entry opens a side panel on the same page. The side panel provides specific details, including the time triggered, time recovered, the associated error code, an error history chart, and links to error documentation.
Warning
Alarms are account-specific and don't aggregate from subaccounts into parent accounts.
To view and manage your existing alarms, go to Develop > Troubleshoot > Alarms and click the Manage alarms tab. If using legacy Console, you'll use the Alarm history page (Monitor > Alarms > Alarm history)
To turn an alarm on or off, toggle the Status. Select an alarm to open the Edit alarm side panel, where you can update the name, conditions, threshold, and notifications.
To duplicate or delete an alarm, click the More options menu for your chosen alarm.
If you provide a webhook URL to an alarm to receive notifications, Twilio makes a POST request to your URL with the following keys as query parameters, similar to all other Twilio Webhook requests:
| Parameter | Description | Example |
|---|---|---|
| AccountSid | The 34-character ID of the Account this alarm is associated with. | "ACxxxxxxxxxxxxxxxxxxxxxxxxxxxxxxxx" |
| AppMonitorTriggerSid | The 34-character ID of the alarm that was triggered. | "AKxxxxxxxxxxxxxxxxxxxxxxxxxxxxxxxx" |
| CurrentValue | The current error count for the defined TimePeriod that the alarm is monitoring. | 55 |
| DateFired | When this notification was triggered, in UTC. | "Tue, 09 Aug 2022 16:51:20 +0000" |
| Description | A description of the error the alarm was monitoring. | "Any Warning or Error" |
| ErrorCode | A unique error code for the error condition. You can look up errors, with possible causes and solutions, in our Error and Warning Dictionary. | 10004 |
| IdempotencyToken | A random token generated by Twilio, and guaranteed to be unique for this particular firing of this alarm. This is idempotent. | "ACxxxxxxxxxxxxxxxxxxxxxxxxxxxxxxxx-FIRES-AKxxxxxxxxxxxxxxxxxxxxxxxxxxxxxxxx" |
| Log | The log level. Can be: error or warning. | "error" |
| TimePeriod | The period over which the alarm counts errors, one of FIVE_MINS, FIFTEEN_MINS, ONE_HOUR, TWELVE_HOURS, or ONE_DAY. For example, a daily TimePeriod resets the error count every day. Periods are in UTC. | "ONE_DAY" |
| TriggerValue | The error count at which the alarm fires. | 1.000000 |
The following example shows a webhook request body that contains an alarm notification:
1{2"AccountSid": "ACxxxxxxxxxxxxxxxxxxxxxxxxxxxxxxxx",3"AppMonitorTriggerSid": "AKxxxxxxxxxxxxxxxxxxxxxxxxxxxxxxxx",4"CurrentValue": "55",5"DateFired": "Tue, 09 Aug 2022 16:51:20 +0000",6"Description": "Any Warning or Error",7"ErrorCode": "10004",8"IdempotencyToken": "ACxxxxxxxxxxxxxxxxxxxxxxxxxxxxxxxx-FIRES-AKxxxxxxxxxxxxxxxxxxxxxxxxxxxxxxxx",9"Log": "error",10"TimePeriod": "ONE_DAY",11"TriggerValue": "1.000000"12}