Voice Insights Advanced Features
Voice Insights data is gathered for every call placed on Twilio. Aggregate dashboards and call summaries are included with every voice minute placed on Twilio, but high-precision metrics, call progress events, and programmatic availability are must-haves for certain applications. For customers who require greater specificity about call behavior or have advanced analytics applications we are offering a set of features tuned to operating highly sensitive and complex call quality monitoring.
Metrics
Time-series views of jitter, packet loss, and packet rate for inbound and outbound streams for carrier and trunking calls; jitter, received packet loss, mean opinion score, round trip time, and audio input/output levels for voice SDK calls: these details are available in the Console and via the API.
In some cases just knowing that call-metric variance may have degraded the experience on a call is not enough. If you need to know precisely when during the call the variance occurred, and for how long, you need a time-series view of that data.
Events
The Events stream will show Twilio call progress events for Programmable Voice calls, SIP signaling responses for trunking calls, and Twilio Device and ICE connection events for Voice SDK calls. These details are available in the Console and via the API.
Twilio's SDKs provide a rich source of call data in the form of debug, error, info, and warning events. These events are available to your application via the SDK, but enriching the Twilio call record with the event stream provides additional context for understanding call behavior. Call progress events like the transition from ringing to answered are also provided.
Voice Insights API
If your use-case requires programmatic access to Voice Insights data, we have API endpoints available to retrieve near-real time events, metrics, and post-call summaries for your calls. Pull the data about your calls into your own applications and decorate your call records with the details provided by Insights.
Learn more about the Voice Insights endpoints from these pages:
- Call Insights API Overview
- Call Summary Resource
- Call Summaries Resource
- Call Insights Event Resource
- Call Metrics Resource
- Call Annotations Resource
Pricing
Advanced Features are available at an additional cost to regular call charges. Please, see our Voice Pricing pages for Voice Insights pay-as-you-go and committed pricing information.
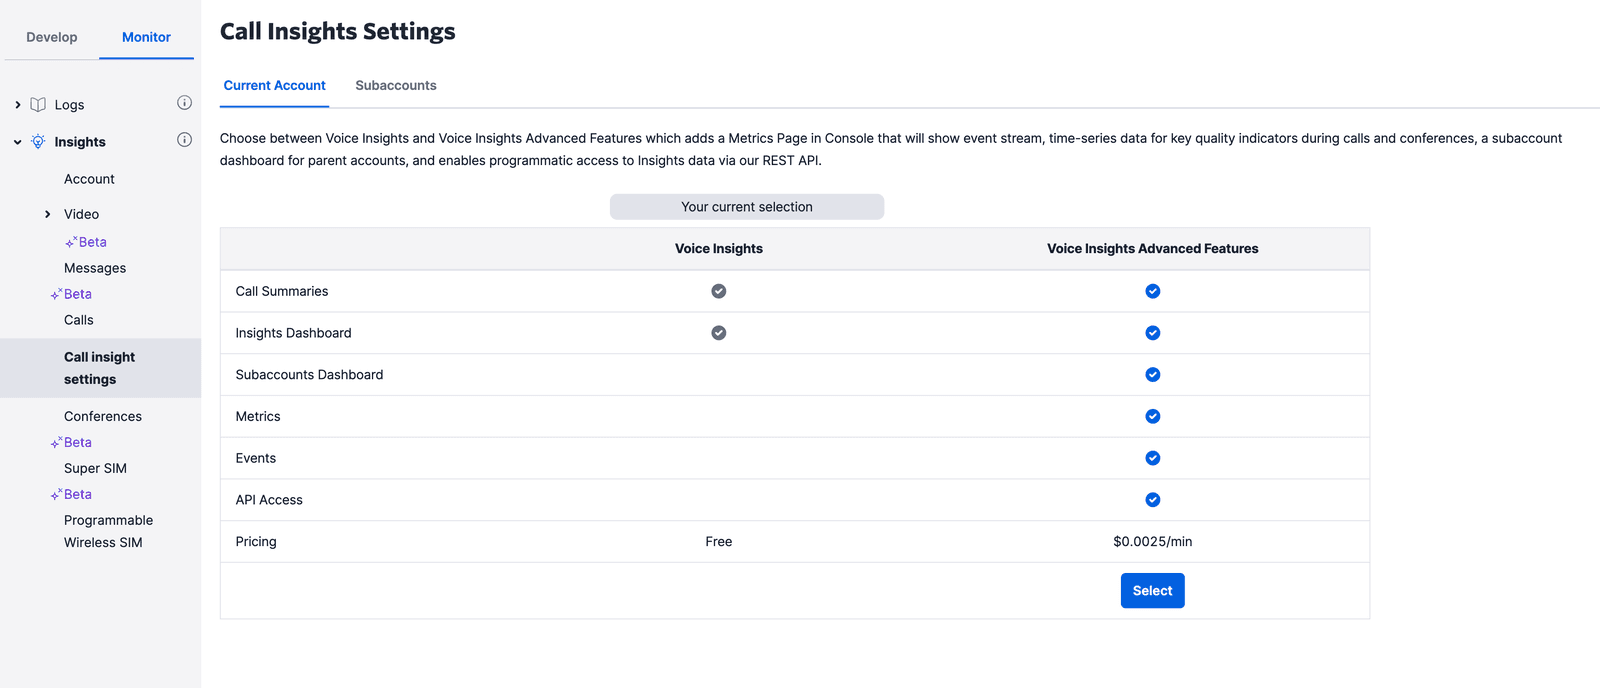
See our documentation for the Voice Insights Settings Resource.
To enable Voice Insights, login to the Console with your Twilio account, switch to the Monitor area. Under the Insights section, click on Call Insight Settings. Now click the Select button to enable Voice Insights Advanced Features. Voice Insights advanced features are now enabled.
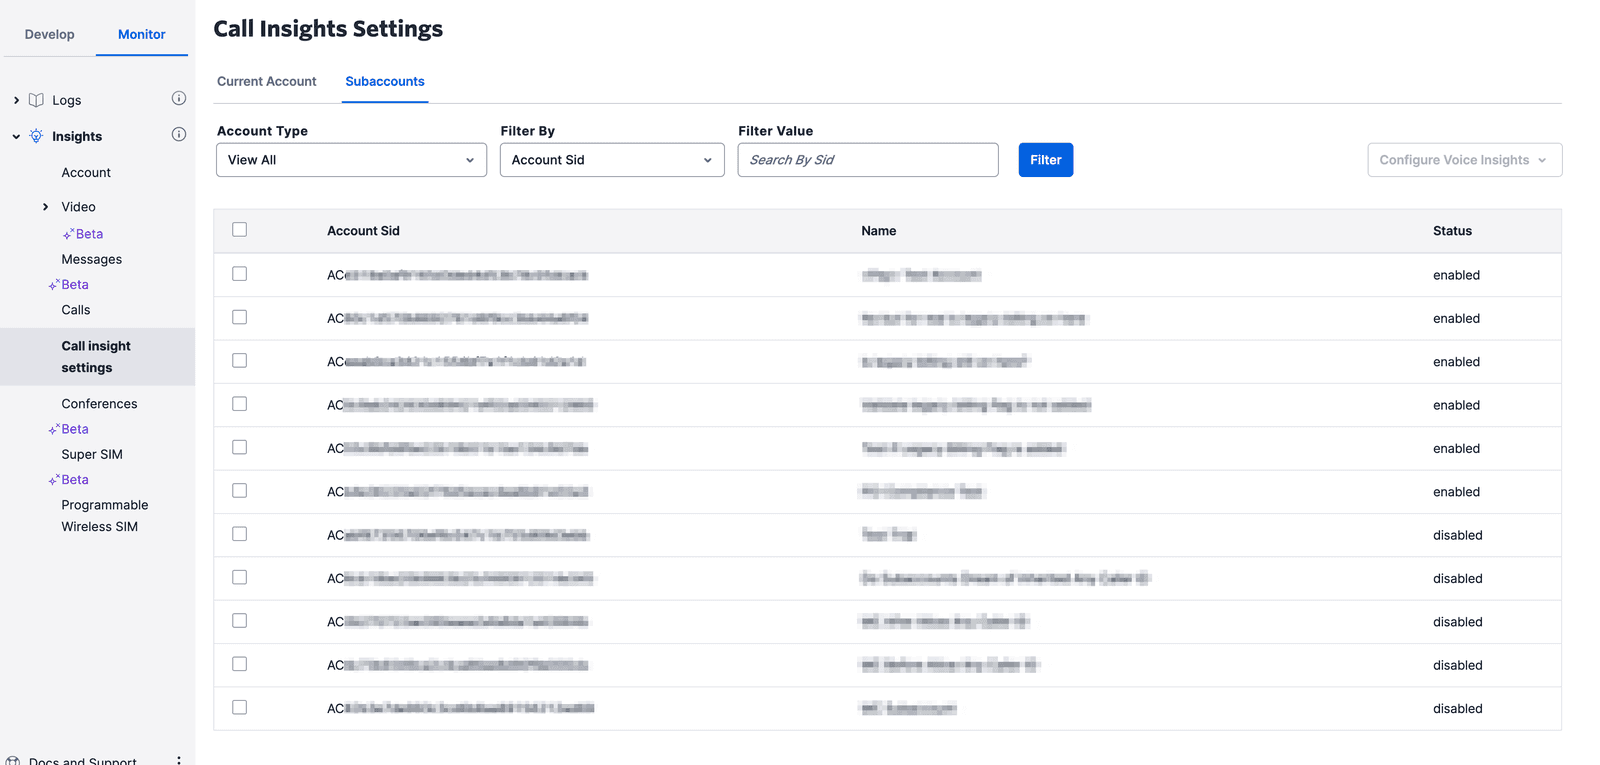
To enable Voice Insights Advanced Features for your subaccounts, switch to the Subaccounts tab. Use the Account Type dropdown to view either all accounts or only accounts with Voice Insights Advanced Features currently enabled. The Filter By drop down allows you choose whether you want to search by account SID or account friendly name.
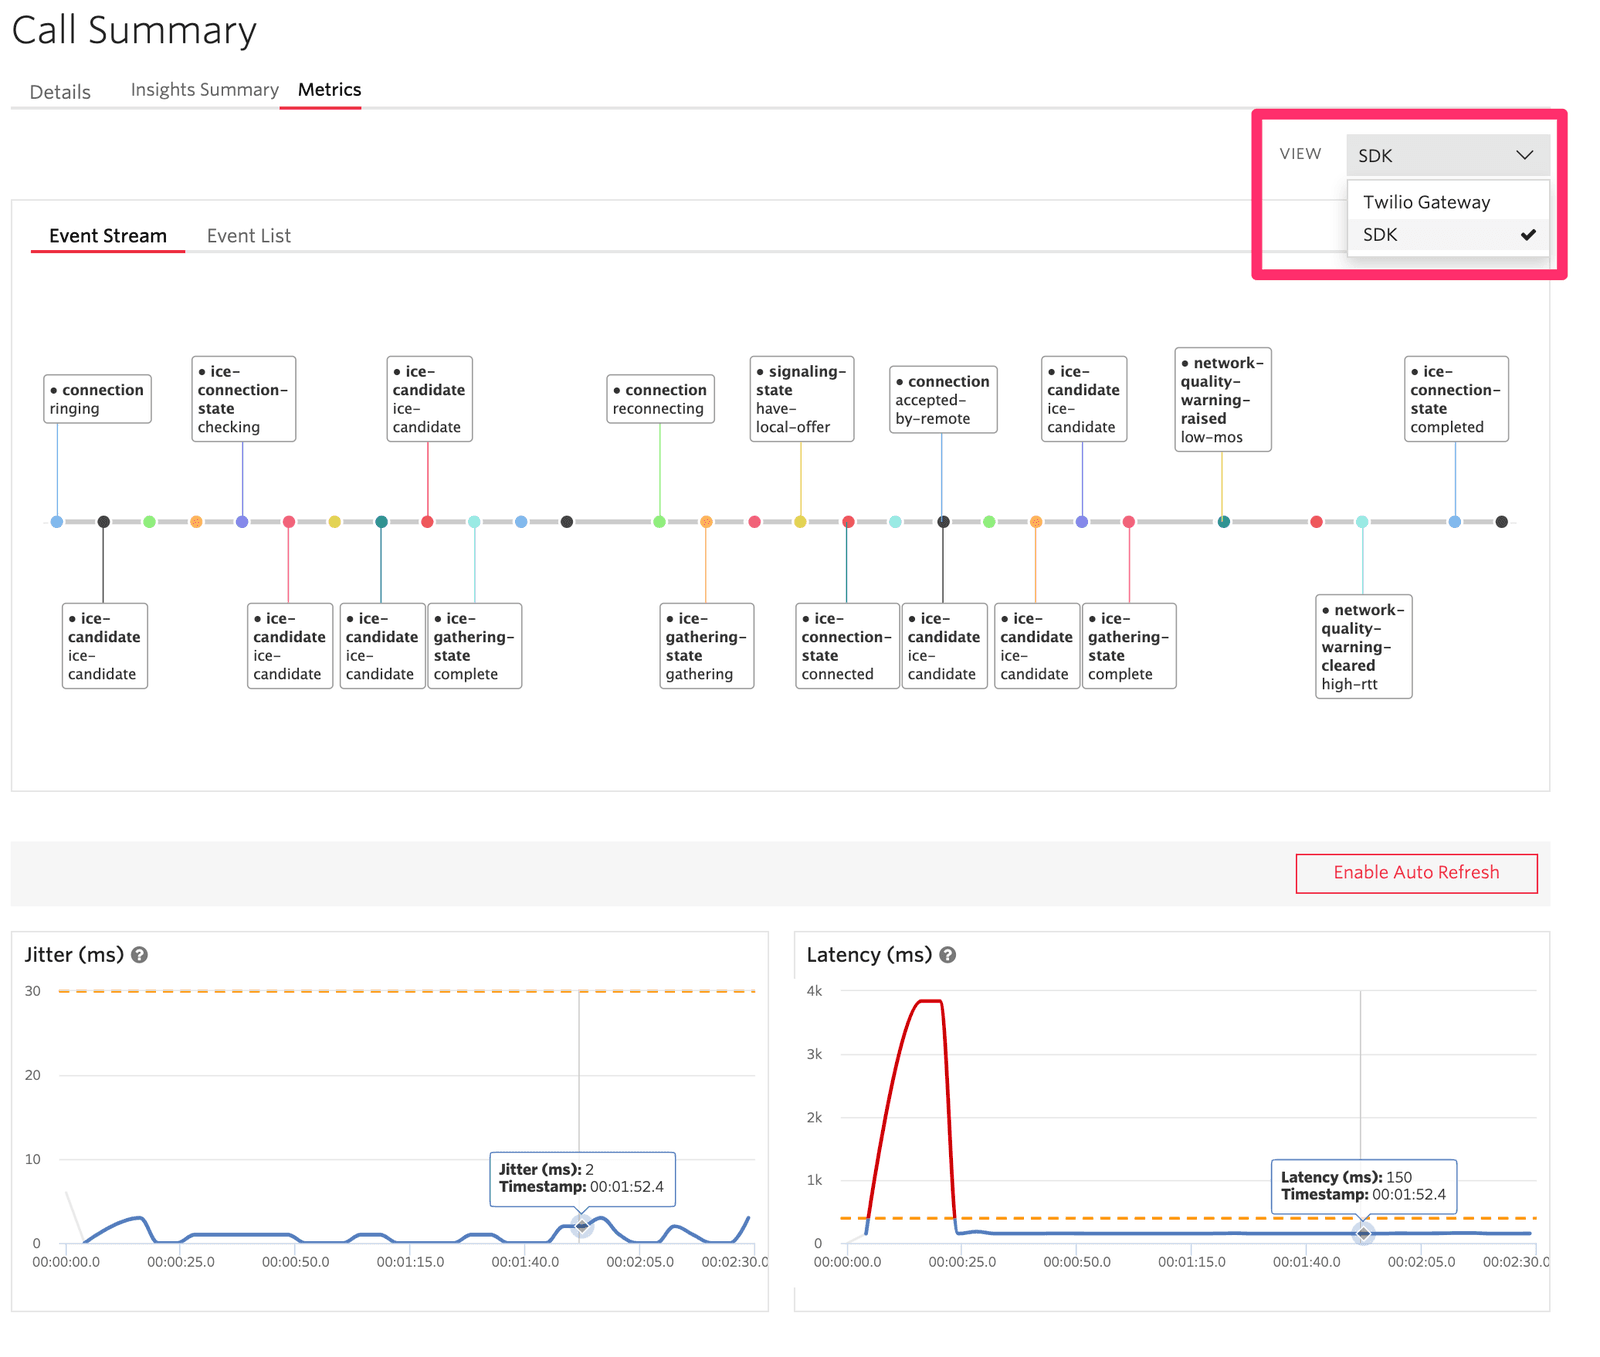
Once Voice Insights Advanced Features is enabled, you can access the events and metrics for a specific call from the Console. In order to do so, open the logs page and click on the timestamp in the Date column for the specific call you want to access. On the new page that opens, you can access both events and metrics from the Metrics tab.
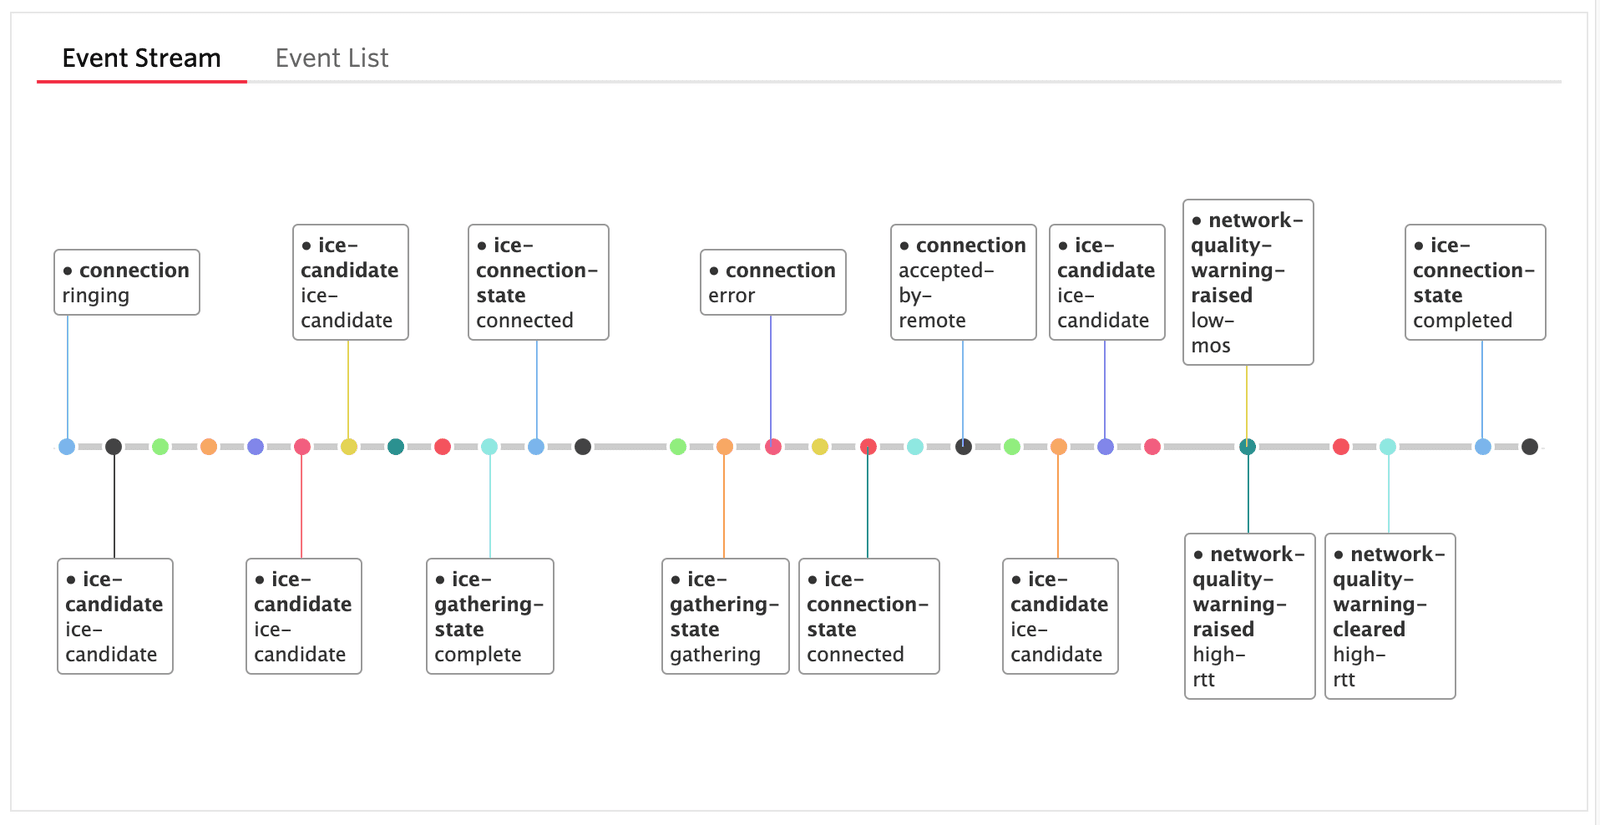
The event stream provides events on any state change transitions that occur during a call, warnings seen on deteriorating network quality or audio equipment malfunction, and the events raised when the feedback submitted by the end user. Event log also contains errors seen on connection failures. Connection errors occur when Twilio Voice SDKs fail to connect with Twilio servers. These failures can occur because of severe network degradation or due to a firewall. There are two views: Event Stream and Event List.
The Event Stream view displays the progress of the events horizontally. In some cases where, for example, a Voice SDK call has a large number of ICE connection changes the number of Events can exceed what will fit on the horizontal view, so while all of the Events are visible and selectable on the timeline, only a portion of the Events will have titles and timestamps shown.
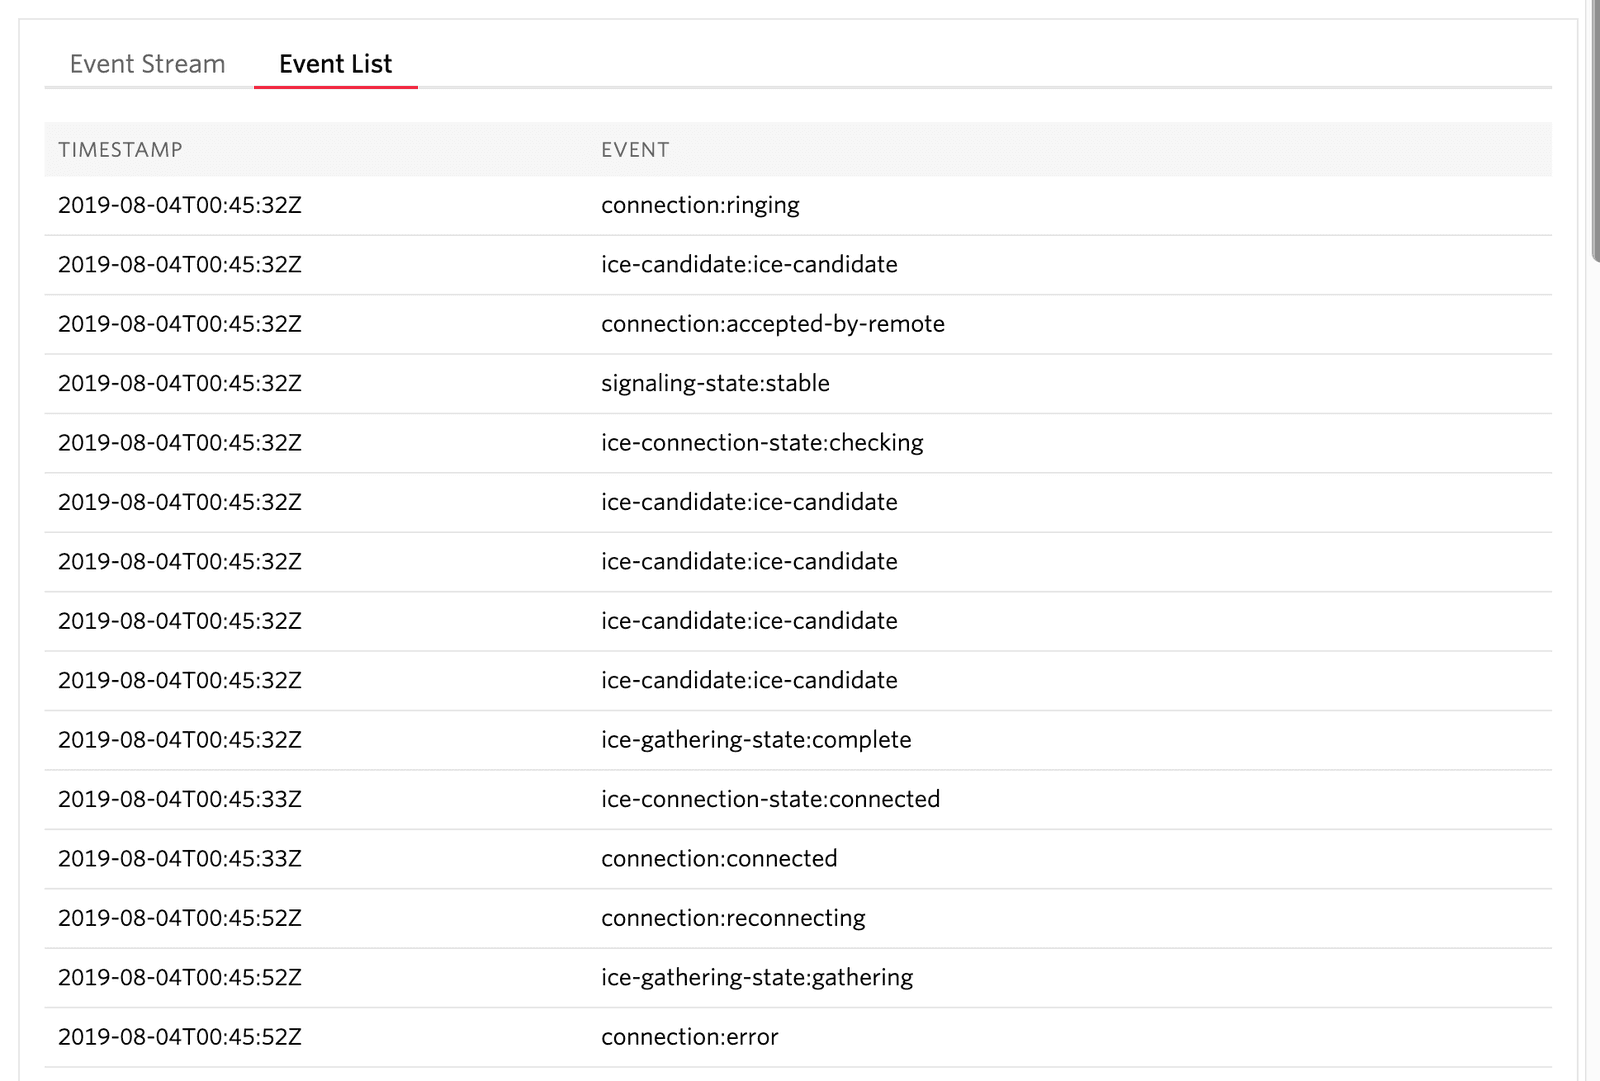
The Event list view shows all the events ordered by timestamp regardless of how many there are; as mentioned above, longer calls placed with Voice SDKs or calls in troublesome network conditions can result in hundreds of events.
Metrics are gathered at Twilio's media gateways and by sensors in the Voice SDKs. We gather metrics every second for Voice SDK calls, and every 10 seconds for SIP/Carrier calls (cumulative statistics for the previous 10 seconds). The dotted orange threshold lines on the graphs indicate the values beyond which there is perceivable drop in call quality. This threshold line is based on the ITU-T standards for VoIP quality.
Twilio Gateway Metrics
Voice SDK Metrics
Voice SDK calls have additional Metrics which represent what the SDK sensors received from the Twilio Gateway.
For Elastic SIP Trunking and Voice SDK calls you can choose between multiple views on a single page. For SDK calls there will be an SDK view which represents what was sent to and reported by the sensors at the Voice SDK, and a Twilio Gateway view that shows what was received at Twilio's media edge from the SDK and what was sent to the SDK from the parent/child. Similarly Elastic SIP Trunking calls will have two views: a SIP/PBX view which shows what was sent to and received from your SIP infrastructure, and a Twilio Gateway view which will show what was sent to/received from the Carrier gateway.
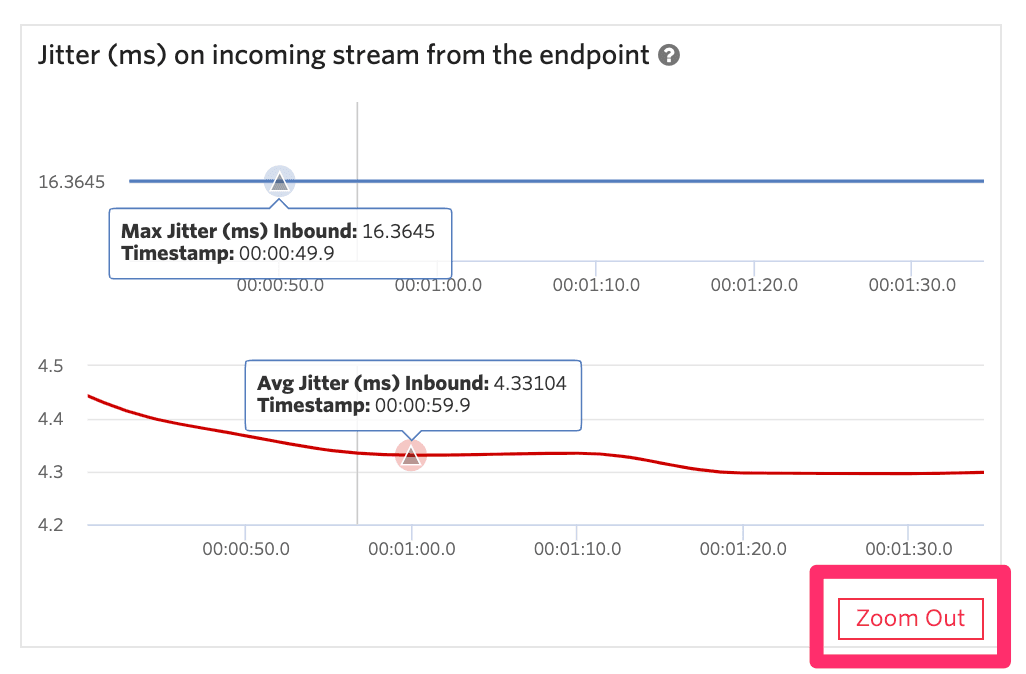
The Metrics graphs can be zoomed in to show greater detail by selecting the region of the graph you are interested in. Once you've zoomed in, you can click on Zoom Out to restore the view.
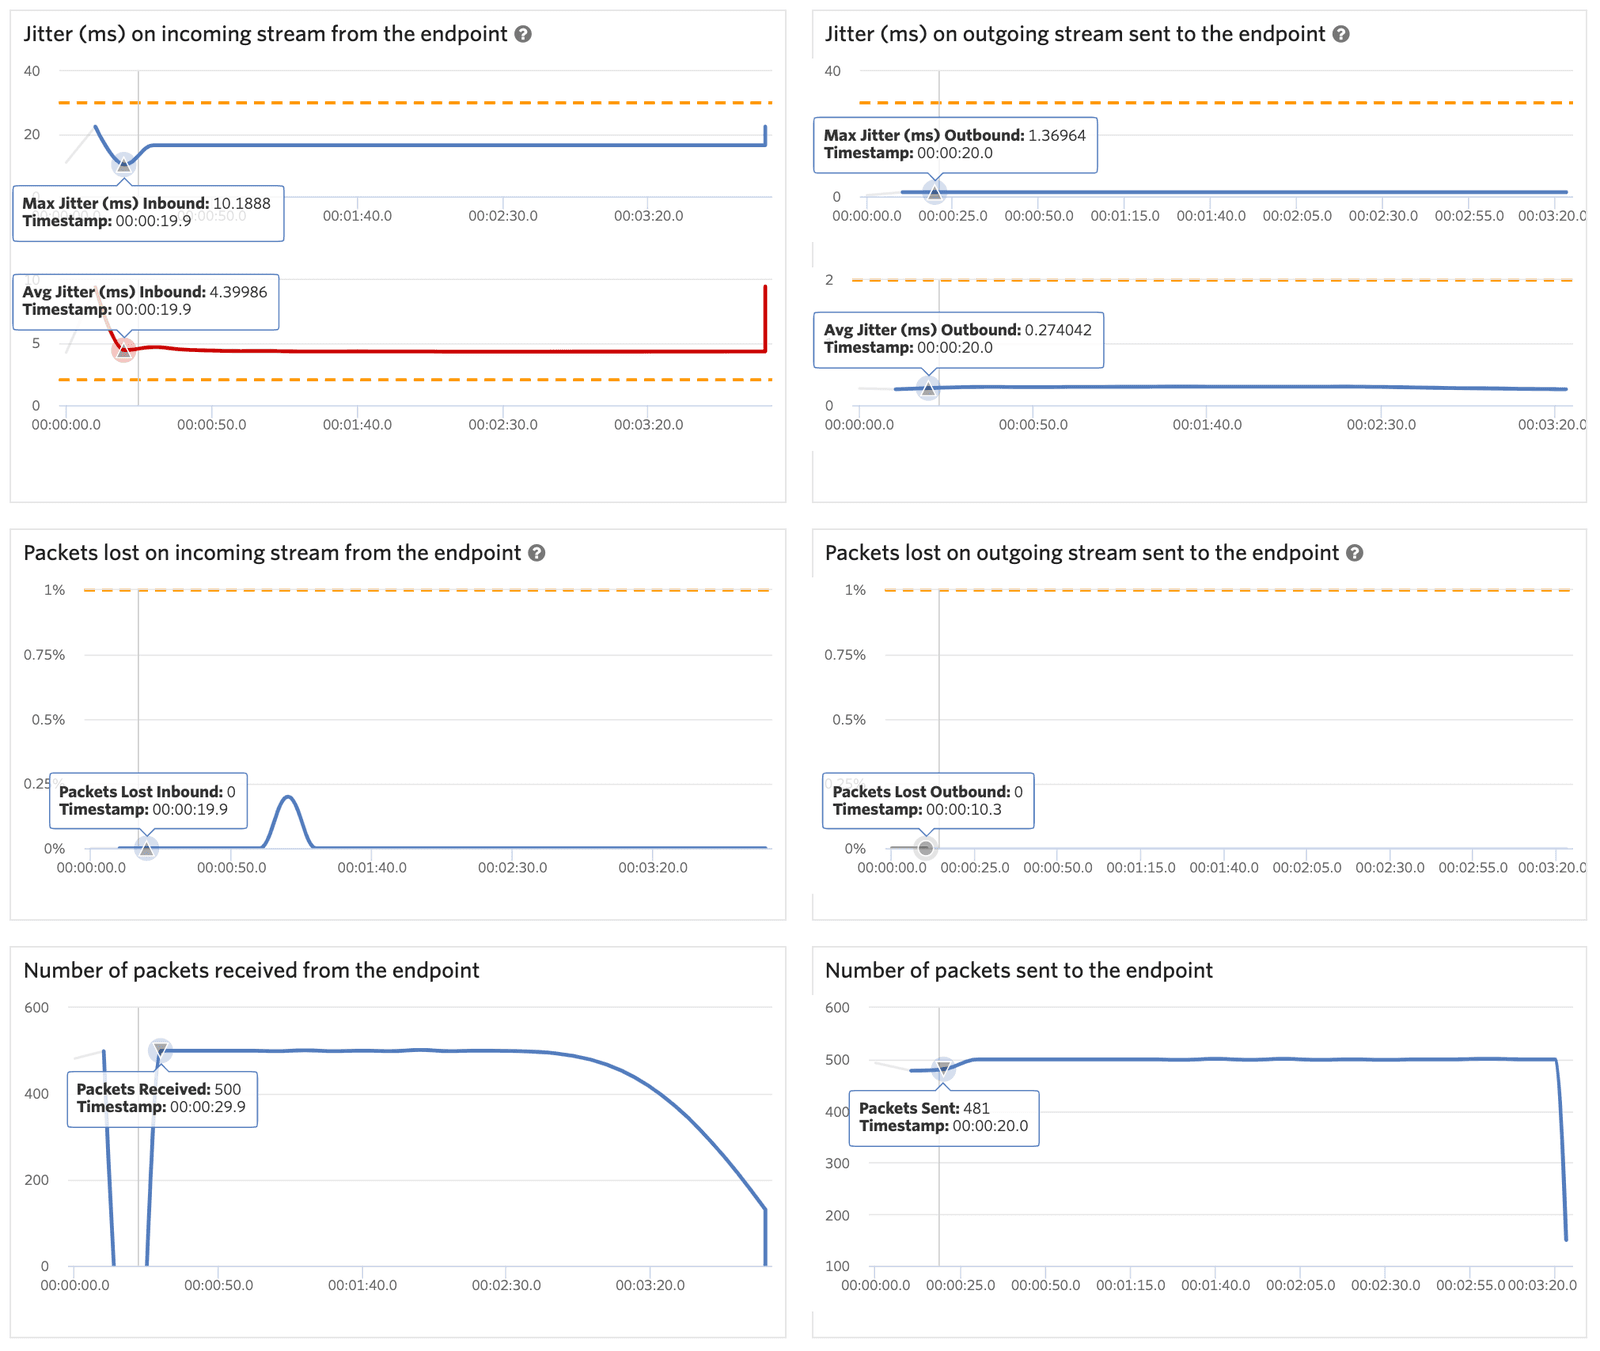
Here is an example of Voice SDK call with some transport issues. First, let's look at the Twilio Gateway view.
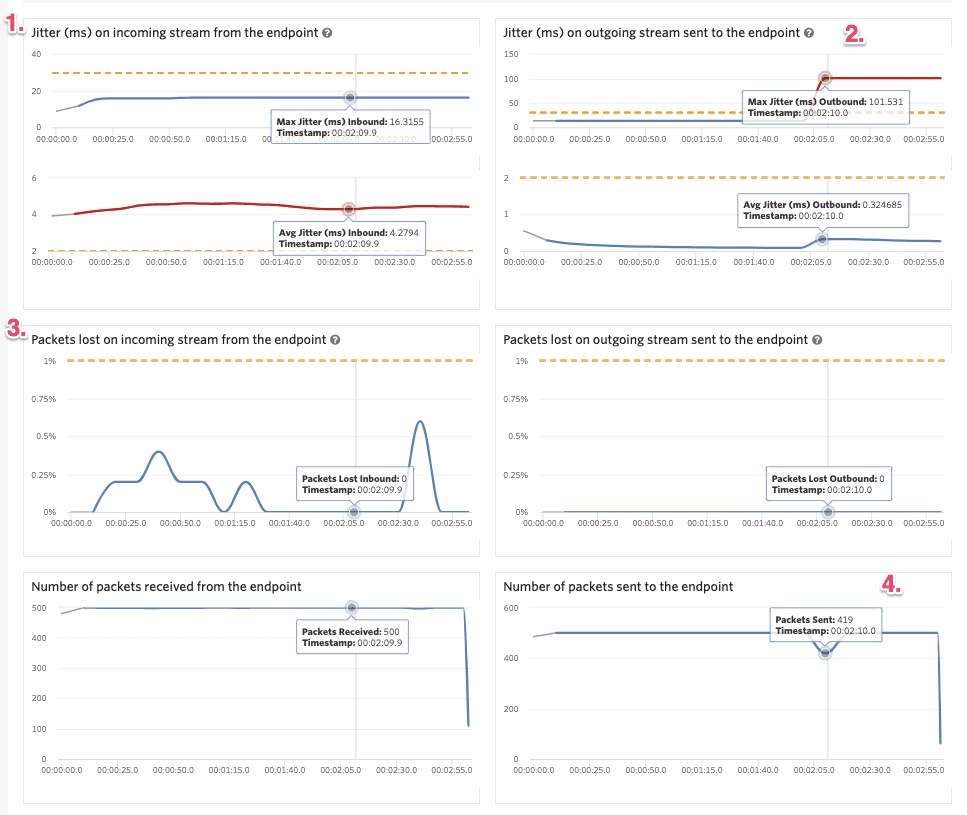
There are a couple things worth taking a closer look at here.
- Jitter on the stream received at the Twilio Gateway from the Voice SDK. Though the maximum jitter never breaches the ITU-T threshold of 30ms — it doesn't cross the dotted orange line — the average jitter exceeds our threshold, so the jitter line is red.
- Jitter on the stream sent to the Voice SDK from the Twilio Gateway. Almost the inverse of the first graph, the average jitter stays low. However, the maximum jitter exceeds the 30ms threshold significantly. Note that the maximum jitter line will remain at the highest value until it is surpassed; for example, in the screenshot above it looks like a handful of packets arrived out of order, so the maximum is set a 101ms and stays there for the rest of the call because that value is not surpassed.
- Packet loss on the stream received at the Twilio Gateway from the Voice SDK. We can see multiple brief spikes of packet loss, but the percentage of packet loss never exceeds our threshold, so the graphical representation stays under the dotted orange line.
- Inconsistent packet rate on the stream sent to the Voice SDK from the Twilio Gateway.
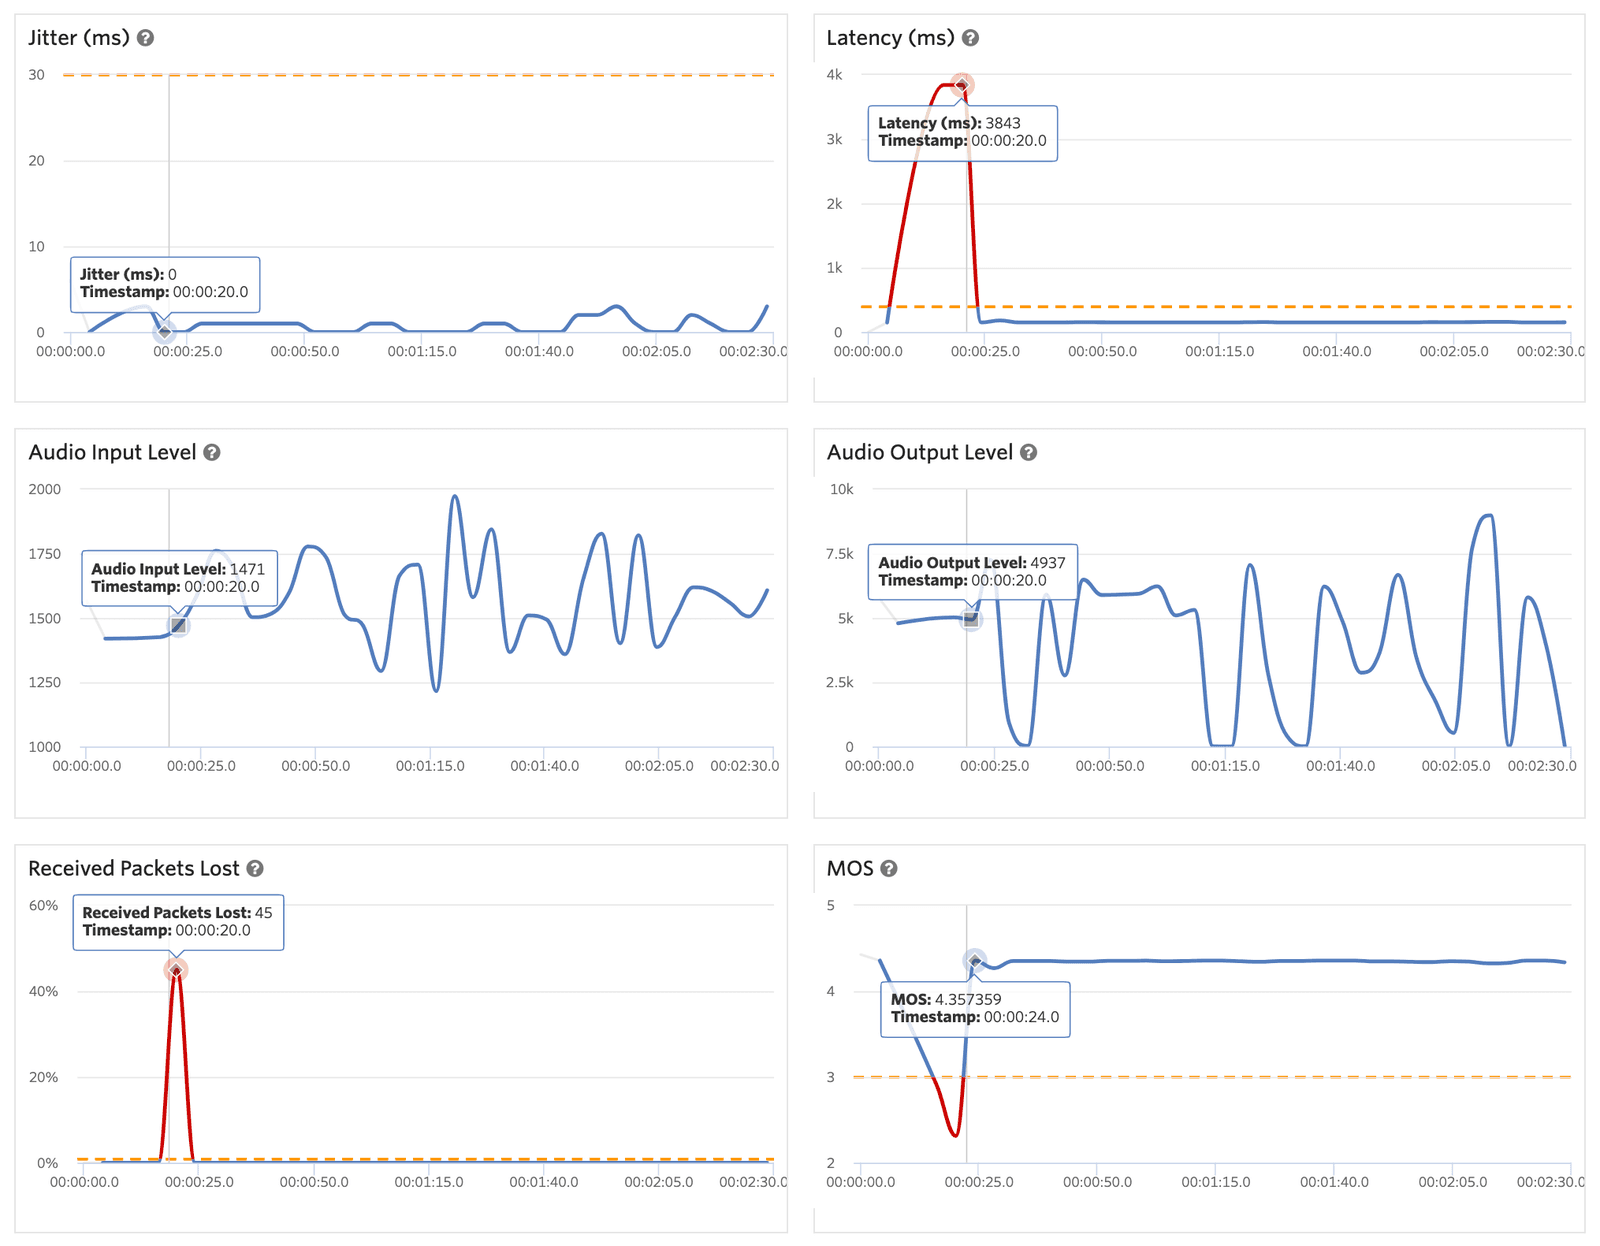
Here's the SDK view for this same call.
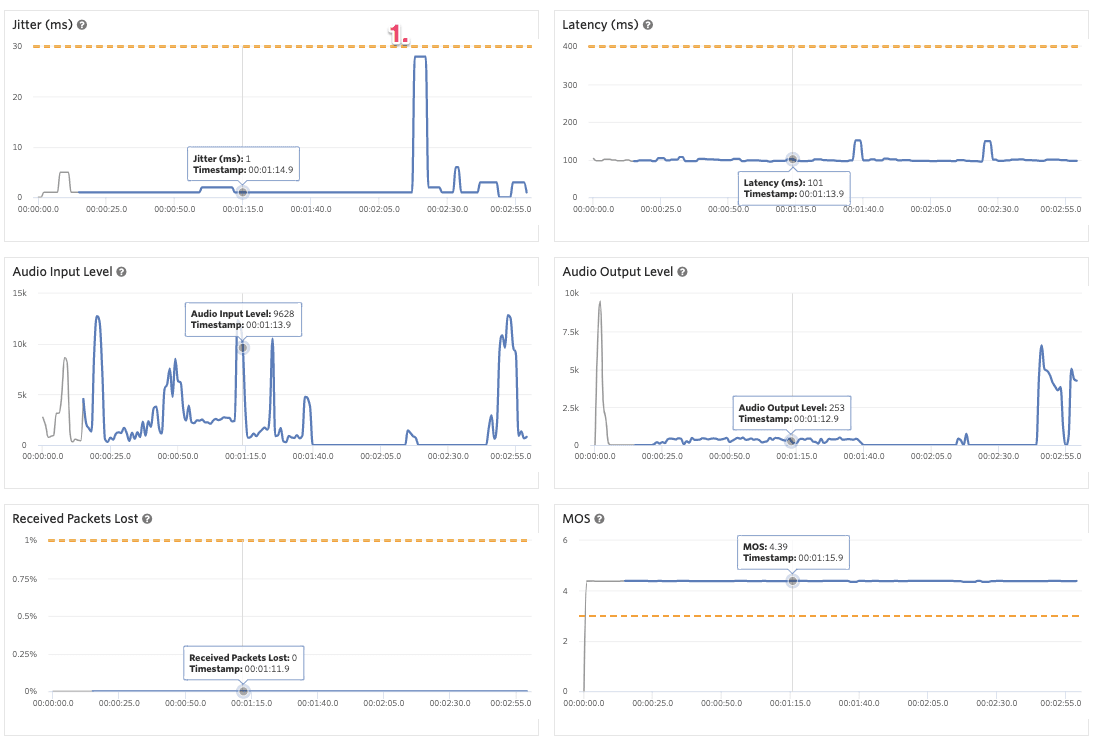
The SDK view reports what was received at the SDK sensors from the Twilio Gateway. Here we can see a jump in jitter received at the SDK (see #1) at the same time max outbound jitter spikes on the graph above (#2).
To learn more about the Twilio media edges, see Understanding Twilio Media Edges.