Conference and Participant Summary
Learn about Conference and Participant Summaries, a Voice Insights tool that provides metadata, quality analysis, and event timelines for Twilio conferences.
You can use this guide for inbound and outbound contact centers, call tracking, and AI/ML transcription.
See Related reference documentation to learn more about the reference page elements used in this guide.
Conference and Participant Summaries provide multiple views into conference metadata which allow users to see conference parameters, investigate participant event timelines, and understand detected quality issues.
Every conference on Twilio is analyzed and aggregated by Voice Insights to provide visibility into participant behavior and offer prescriptive recommendations for resolving common quality and configuration issues. Conference and Participant Summaries are included with all conferences at no additional cost.
Info
Conference and Participant summary data is available after the conference ends and is stored for up to 30 days.
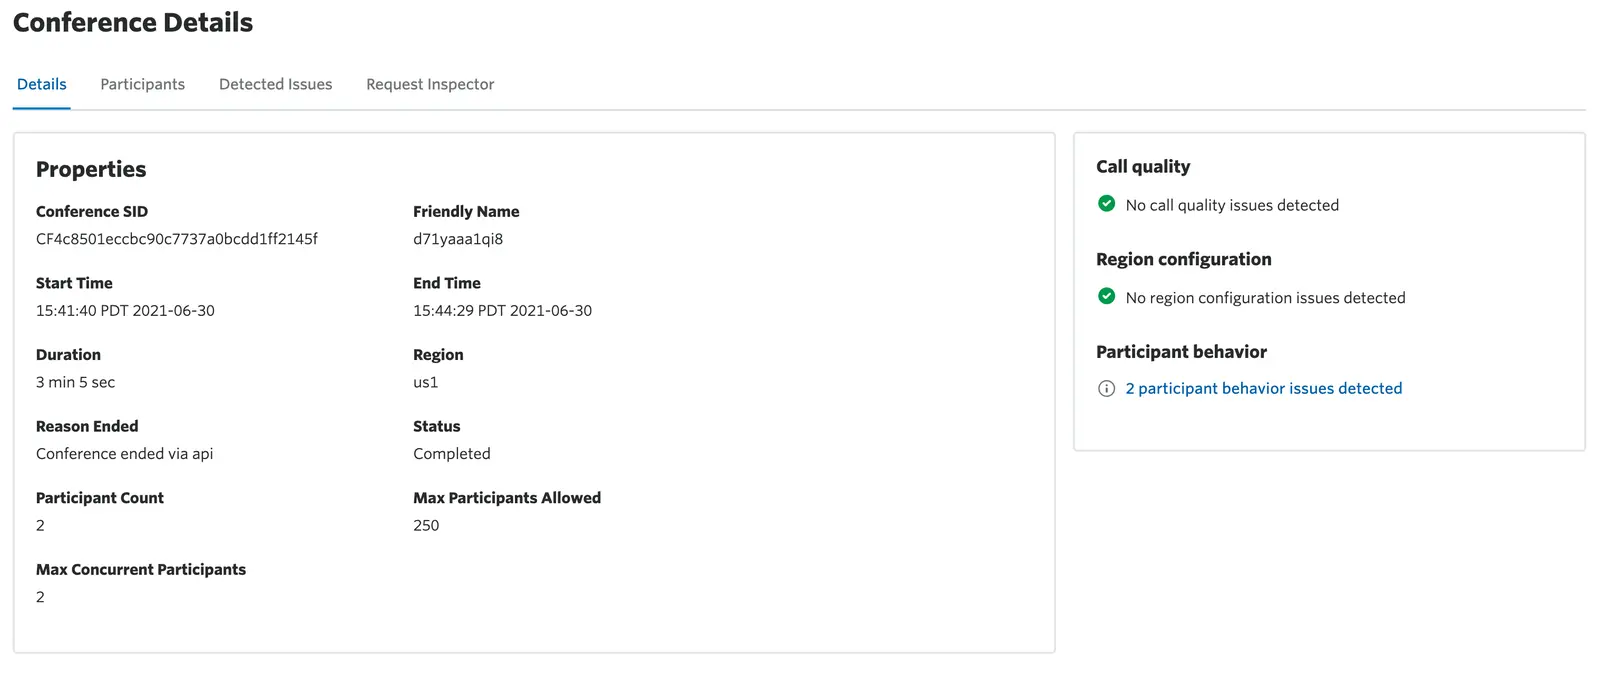
The Details tab shows conference metadata regarding the initial configuration of the conference as well as an at-a-glance view of conference health based on common quality, region configuration, and participant behaviors during the conference.
The Properties section shows the conference configuration metadata and details about how the conference ended.
| Parameter | Description |
|---|---|
| Conference SID | The unique string that we created to identify this Conference resource. |
| Friendly Name | A string assigned to describe this conference room. |
| Start Time | Timestamp of when the conference started |
| End Time | Timestamp of when the conference ended |
| Duration | Time between start and end times |
| Region | The Twilio region where the conference media was mixed |
| Reason Ended | Why the conference ended. |
| Ended By | Will indicate the call SID whose activity ended the call, or indicate that the conference was ended by API |
| Status | Completed or Not Started |
| Participant Count | The number of total participants in the conference over time |
| Max Participants Allowed | Configuration setting. Defaults to 250 |
| Max Concurrent Participants | Count of participants that were in the conference at the same time |
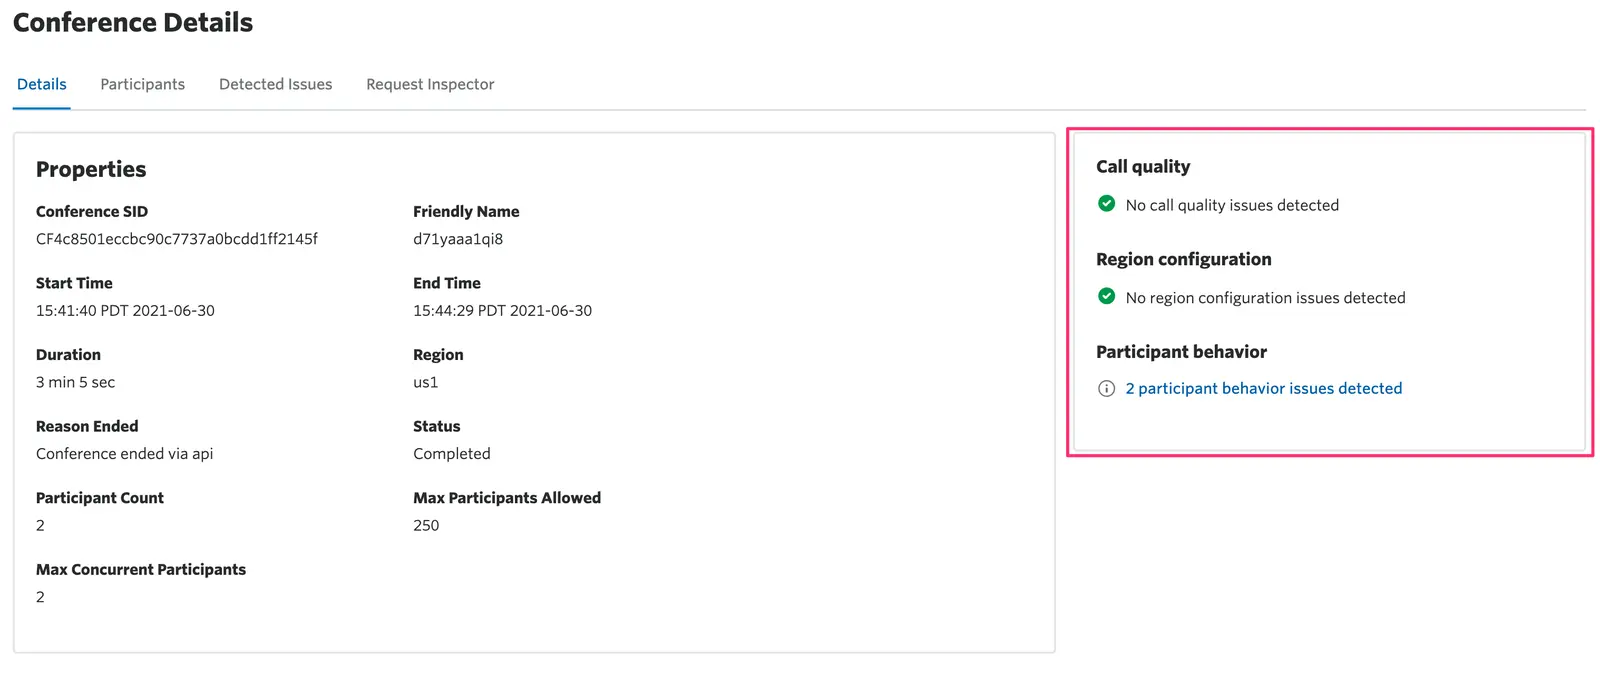
The Conference Health Report Card provides an overview of any potential issues detected by Twilio. If you are investigating reports of quality issues or unexpected behavior in a conference you can see at a glance if common problems were detected and how many instances were detected for each type.
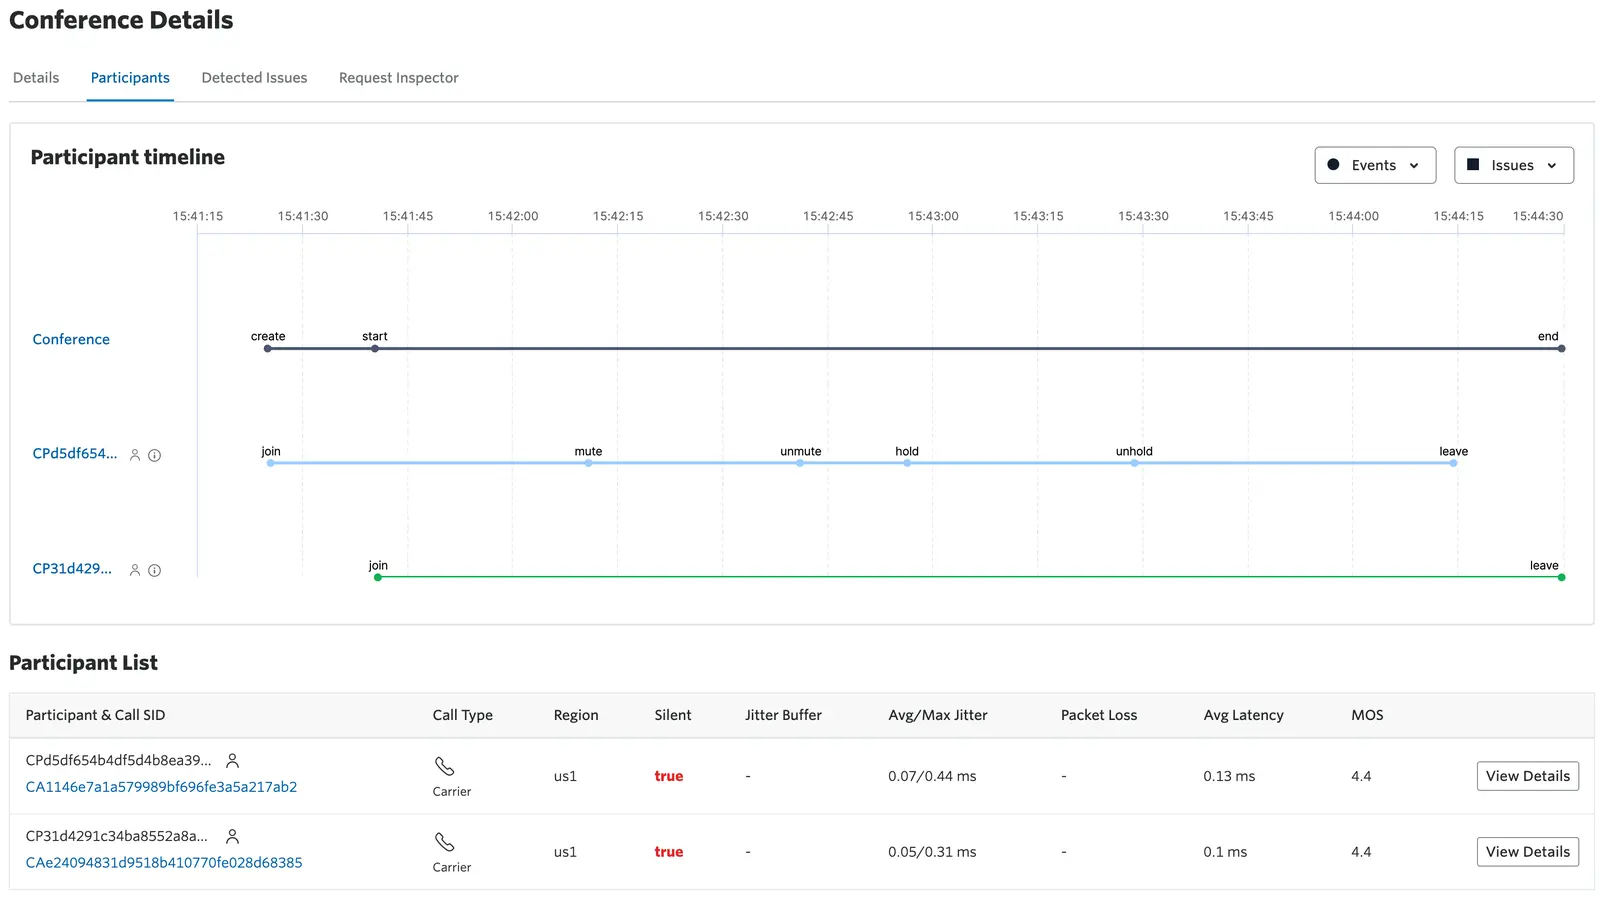
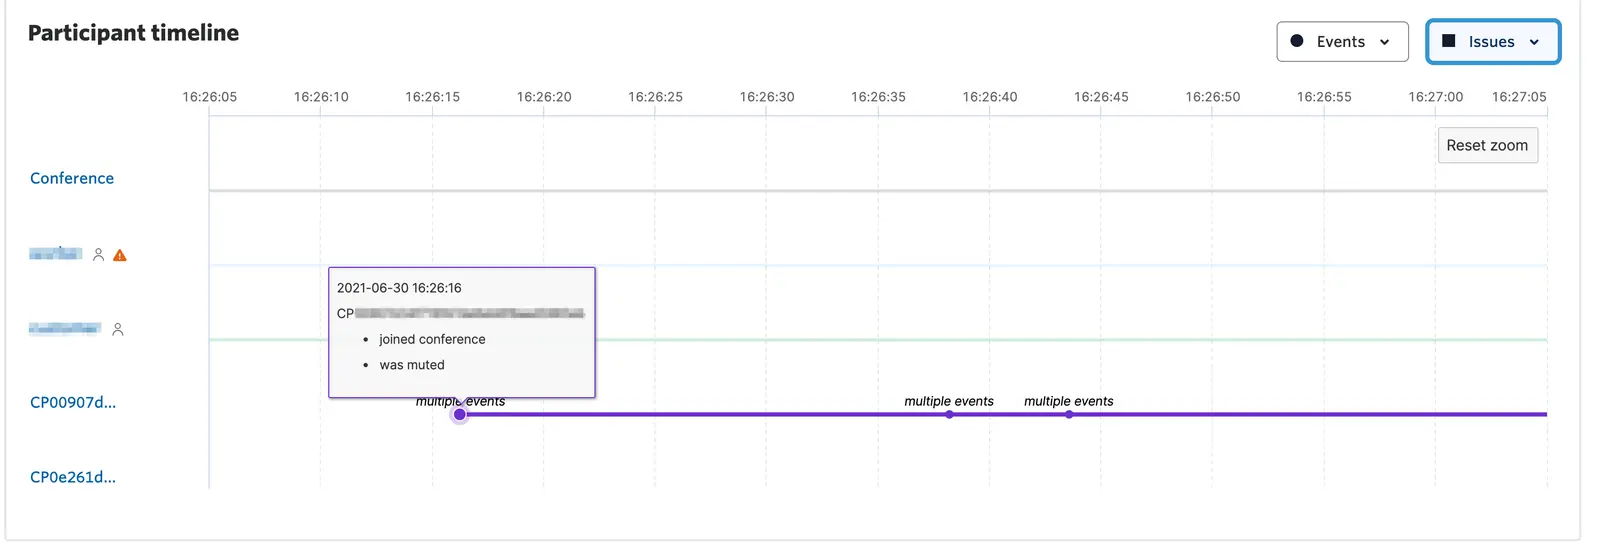
The Participant Timeline is a visual representation of conference events over time, including when conferences start, when participants join, and when quality issues are detected. You can select sections of the timeline to zoom in for greater granularity which is useful when many events occur in close proximity to each other.
The top line on the participant timeline represents the conference resource itself; when it was created, when the conference started, and when it ended. The events on this line are not filterable. A conference does not start until at least two participants join and at least one participant is a moderator (startConferenceOnEnter=true). The Participant Timeline will show up to 20 conference participants; conferences with more than 20 participants will show only the Participant List.
Other lines represent individual conference participants and their activity over time. Events like being placed on hold or going on mute are shown on the timeline along with detected quality issues like jitter, latency, and packet loss.
Conference Events are represented on the timeline as circular icons. Quality Issues are represented on the timeline as square icons.
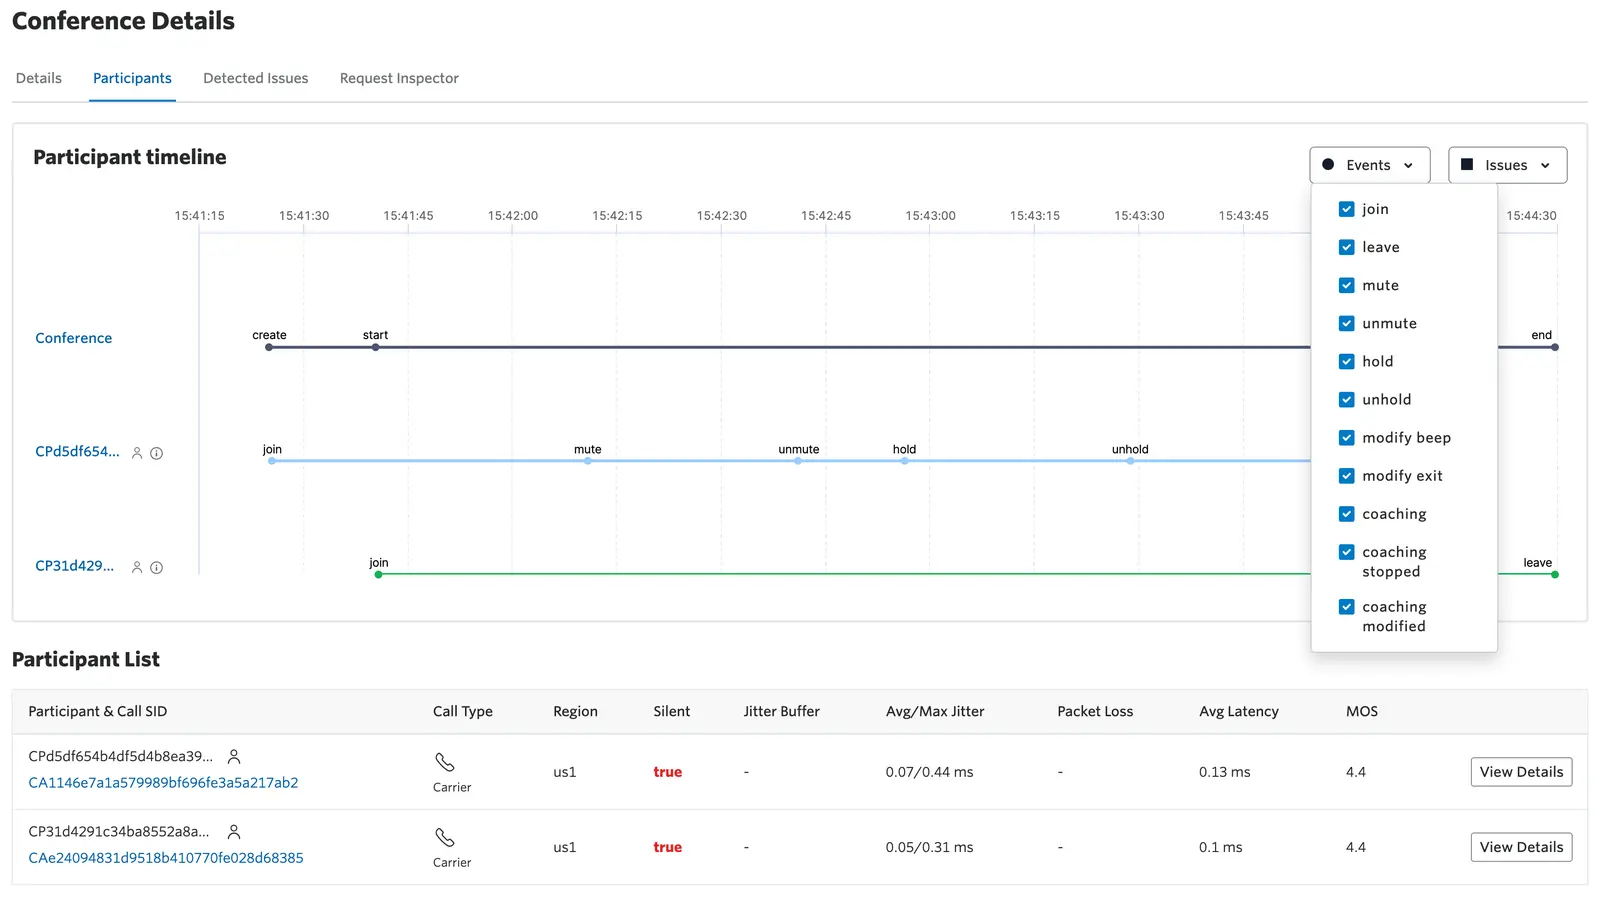
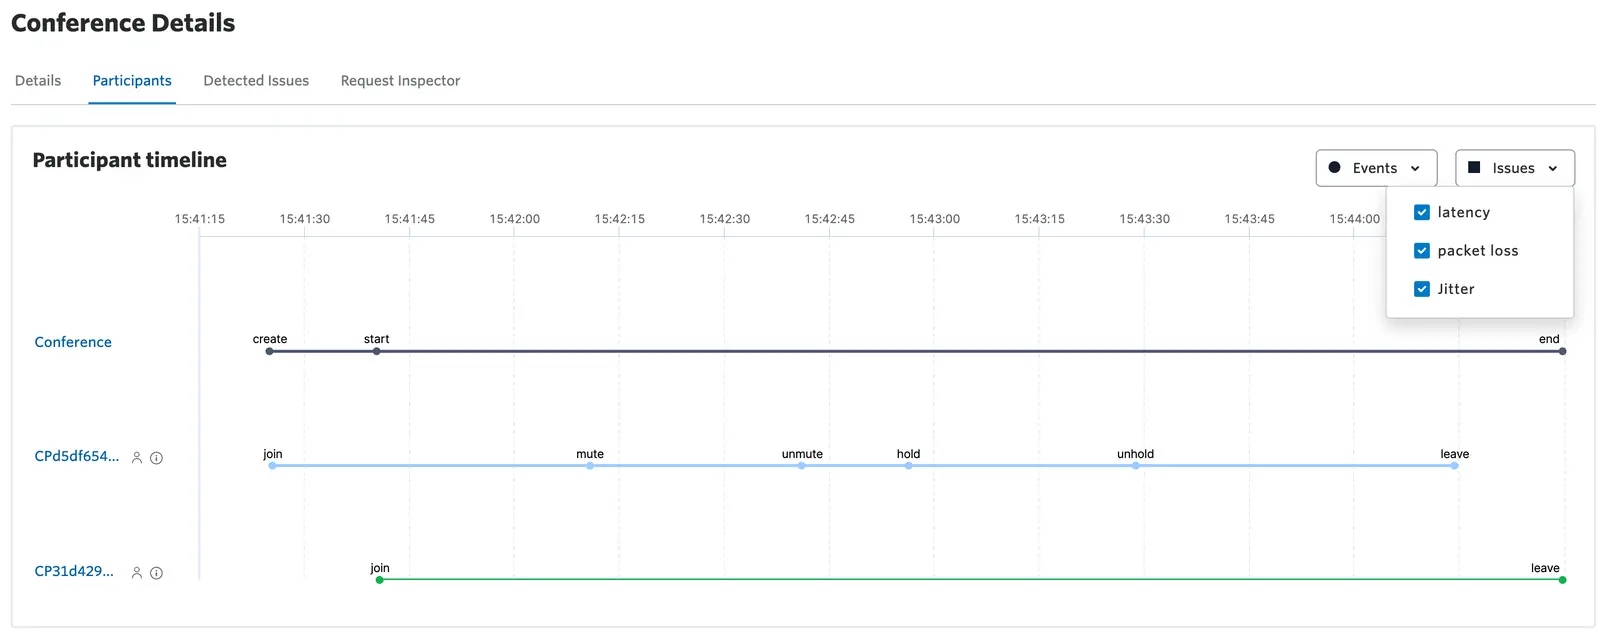
The Events filter allows users to deselect event categories that are not relevant to their current investigation. For example if you are investigating issues with the timing of hold/unhold events, you can deselect other event types to provide a less cluttered representation of the timeline. The conference events captured on the participant timeline are:
| Parameter | Description |
|---|---|
| Join | Indicates when a participant joins the conference |
| Leave | Indicates when a participant leaves the conference |
| Mute | The participant has been muted at the conference level and their audio will not be played out to other participants. Note that muting outside the conference on local hardware or by SIP SDP renegotiation is not captured by Twilio. |
| Unmute | The participant has been unmuted at the conference level and their audio will be played out to other participants. |
| Hold | The participant has been removed from the conference and is hearing hold music. Their audio cannot be heard by remaining participants and they cannot hear the audio from the conference. |
| Unhold | The participant was taken off hold. Two-way audio between the participant and the conference is restored. |
| Modify beep | The beep on exit parameter for the participant was updated |
| Modify exit | The endConferenceOnExit parameter for the participant was updated |
| Coaching | The participant began coaching another participant in the conference. The coach can hear the audio from all conference participants, but can only be heard by the participant they are coaching. |
| Coaching stopped | The participant stopped coaching another participant. The participant that was coaching can now be heard by all other participants. |
| Coaching modified | The participant being coached was updated to a new participant. |
If multiple events occur at the same timestamp you will see a multiple events label. Hover over the label to see the events which occurred at this timestamp.
Info
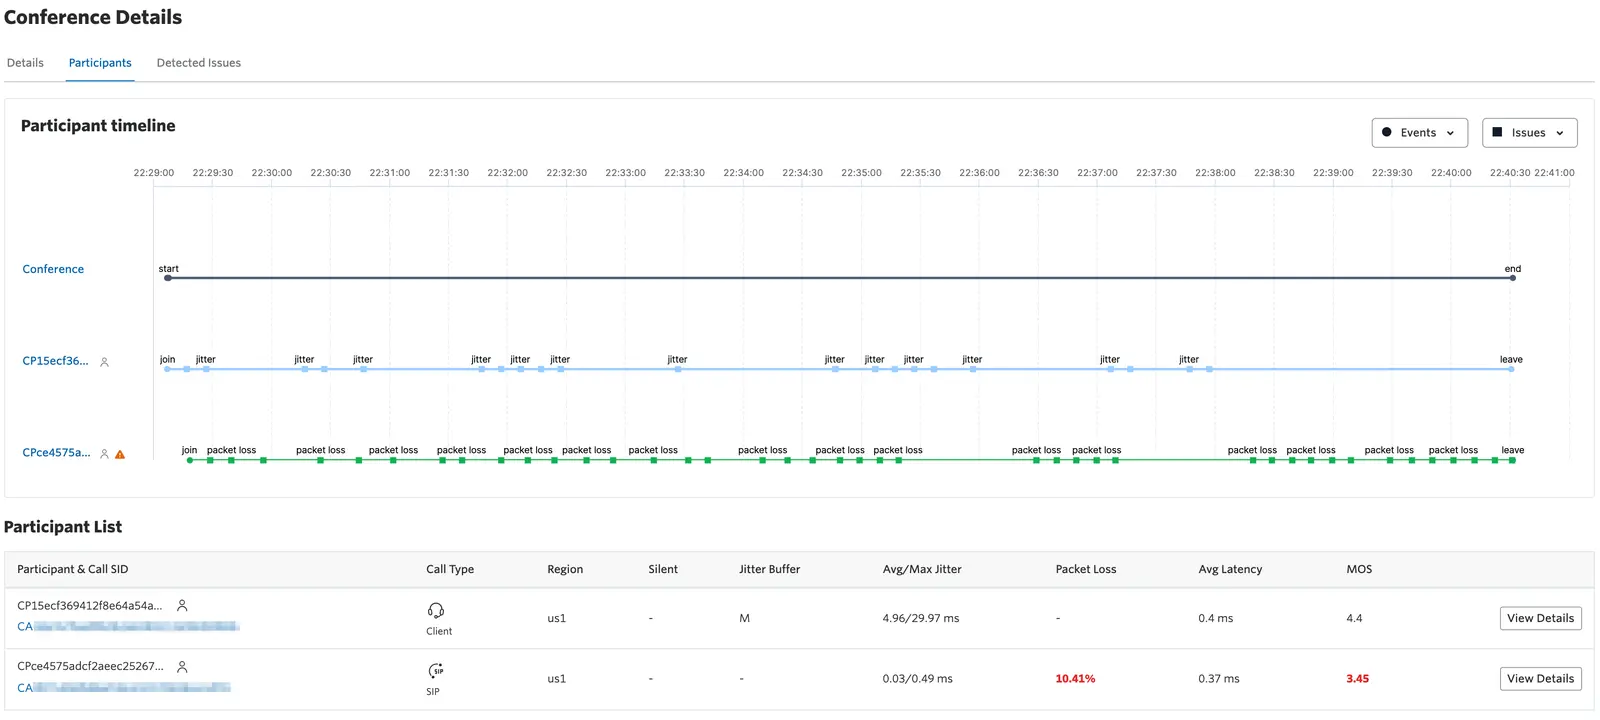
Quality Issues are displayed on the Participant Timeline for accounts with Voice Insights Advanced Features.
Voice Insights Advanced Features monitors and reports on the transport metrics that were received from the participant at the conference mixer. The quality metrics are analyzed in ten second samples. You may see multiple indications of jitter, packet loss, and latency over time if the issue is detected in more than one sample. It is possible to see these network transport issues detected for multiple samples without breaching the threshold for overall call quality issue detection. The thresholds for displaying network transport events on the timeline are:
| Latency | Average latency >= 150ms for a sample |
|---|---|
| Packet Loss | Packet loss >= 5% for a sample |
| Jitter | Average jitter >=5ms or max jitter >= 30ms for a sample |
Here is an example of a conference with many packet loss and jitter events where the jitter did not breach our thresholds but the packet loss did:
| Parameter | Description |
|---|---|
| Participant SID | Unique identifier for the participant |
| Call SID | Session identifier for the call that resulted in this participant being created |
| Call Type | Carrier, SIP, or Client |
| Region | Twilio edge location region where the participant's media arrived |
| Silent | Indicates that Twilio detected silence or a missing RTP stream from the participant |
| Jitter Buffer | Jitter buffer setting for this participant. See our blog post on configuring jitter buffers to improve conference quality. |
| Avg/Max Jitter | Average and maximum measure of media packets arriving out of order. Can result in noisy or robotic audio. |
| Packet Loss | Indicates percentage of lost media packets. Can result in choppy or dropped audio. |
| Avg Latency | How long on average it took for packets to arrive at the conference mixer from Twilio's media edge |
| MOS | Mean Opinion Score calculated using ITU-T G-107 recommendation |
| Parameter | Description |
|---|---|
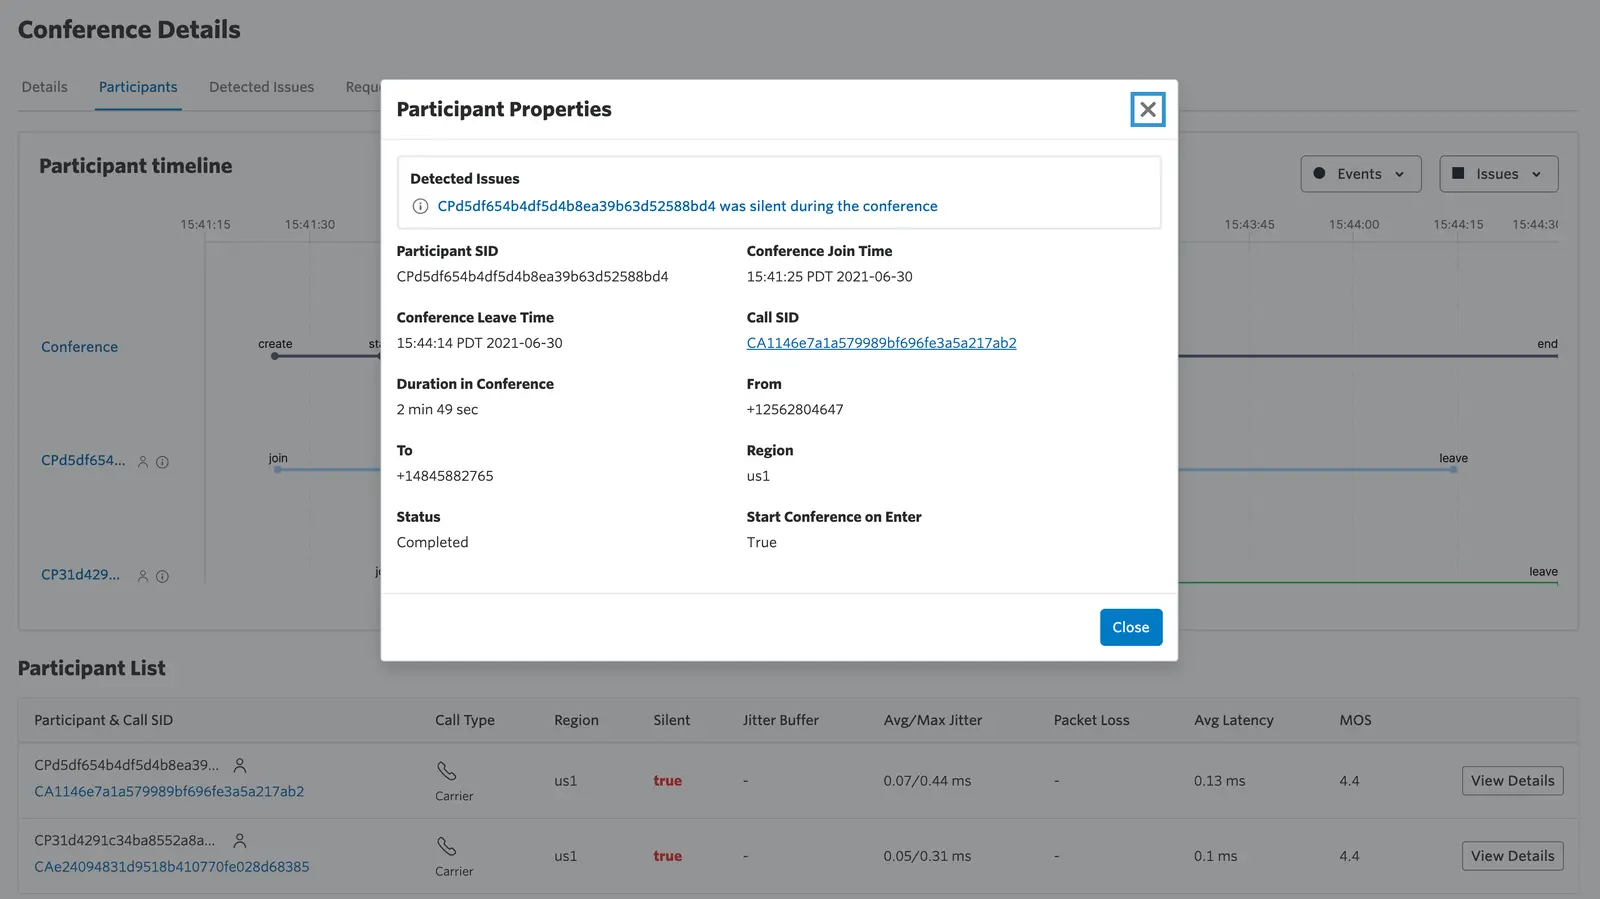
| Participant SID | Unique identifier for the participant |
| Conference Join Time | Timestamp of when the participant joined the conference |
| Conference Leave Time | Timestamp of when the participant exited the conference |
| Call SID | Session identifier for the call that resulted in this participant being created |
| Duration in Conference | The amount of time this participant was in this conference |
| From | The caller ID of the calling party |
| To | The phone number, SIP address, or Client identifier that received this call. |
| Region | Twilio edge location region where the participant's media arrived |
| Status | Call status of the participant |
| Start Conference on Enter | Indicates whether or not the participant was a moderator of the conference |
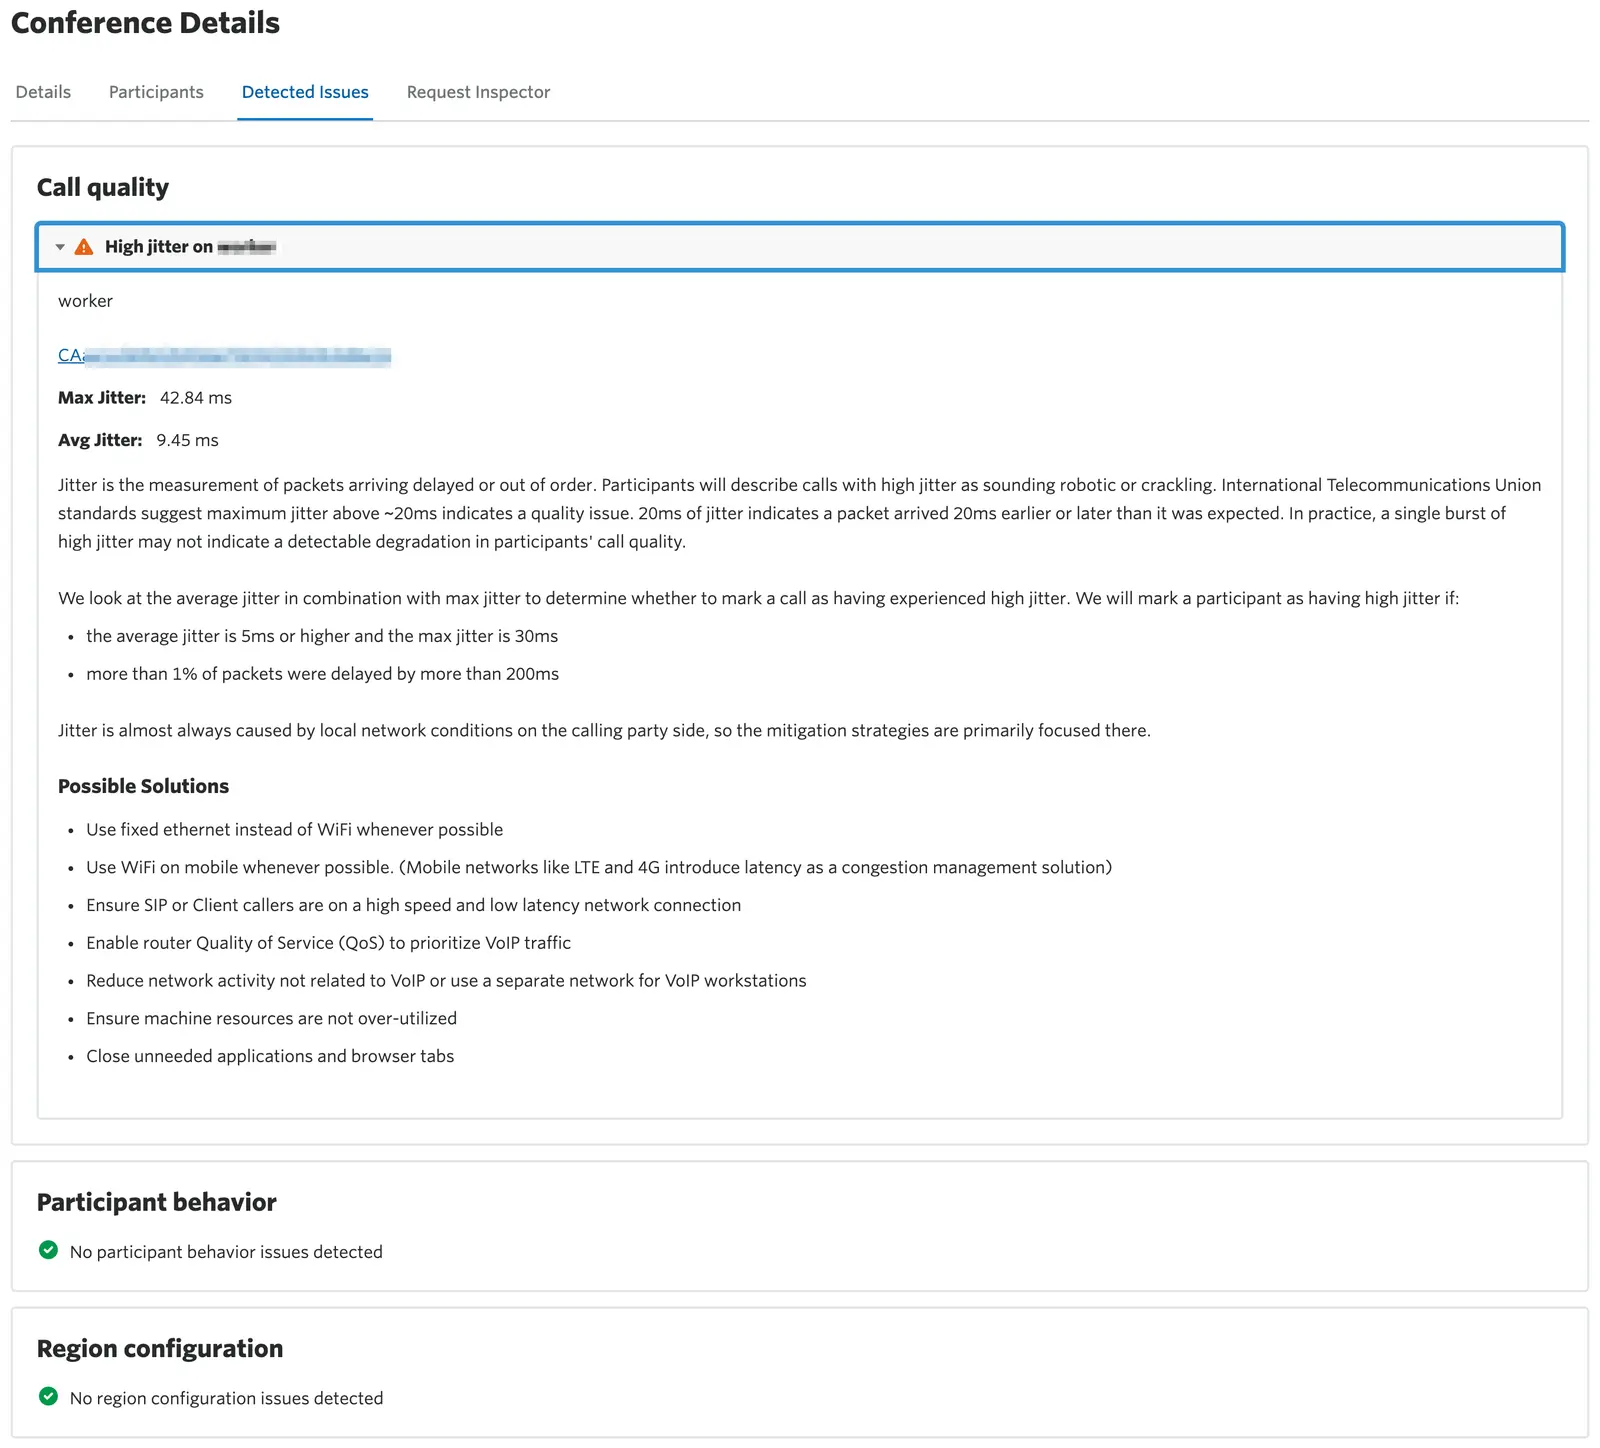
The issues in the Call Quality category are focused on network transport metrics that impact the subjective experience of the participants in the conference. These include:
| Latency | Reports on delay in packets sent from Twilio media gateway to conference mixer for a participant. >= 150ms average latency |
|---|---|
| Jitter | Reports on packets arriving out of order when sent from Twilio media gateway to conference mixer for a participant. >=5ms average jitter and max jitter >= 20ms |
| Packet Loss | Reports on missing packets expected from Twilio media gateway that never arrive at the conference mixer for a participant. >=5% cumulative packet loss |
| MOS | Reports that the MOS score for the media stream for a participant sent from the Twilio media gateway indicates poor quality. MOS score <= 3.5 |
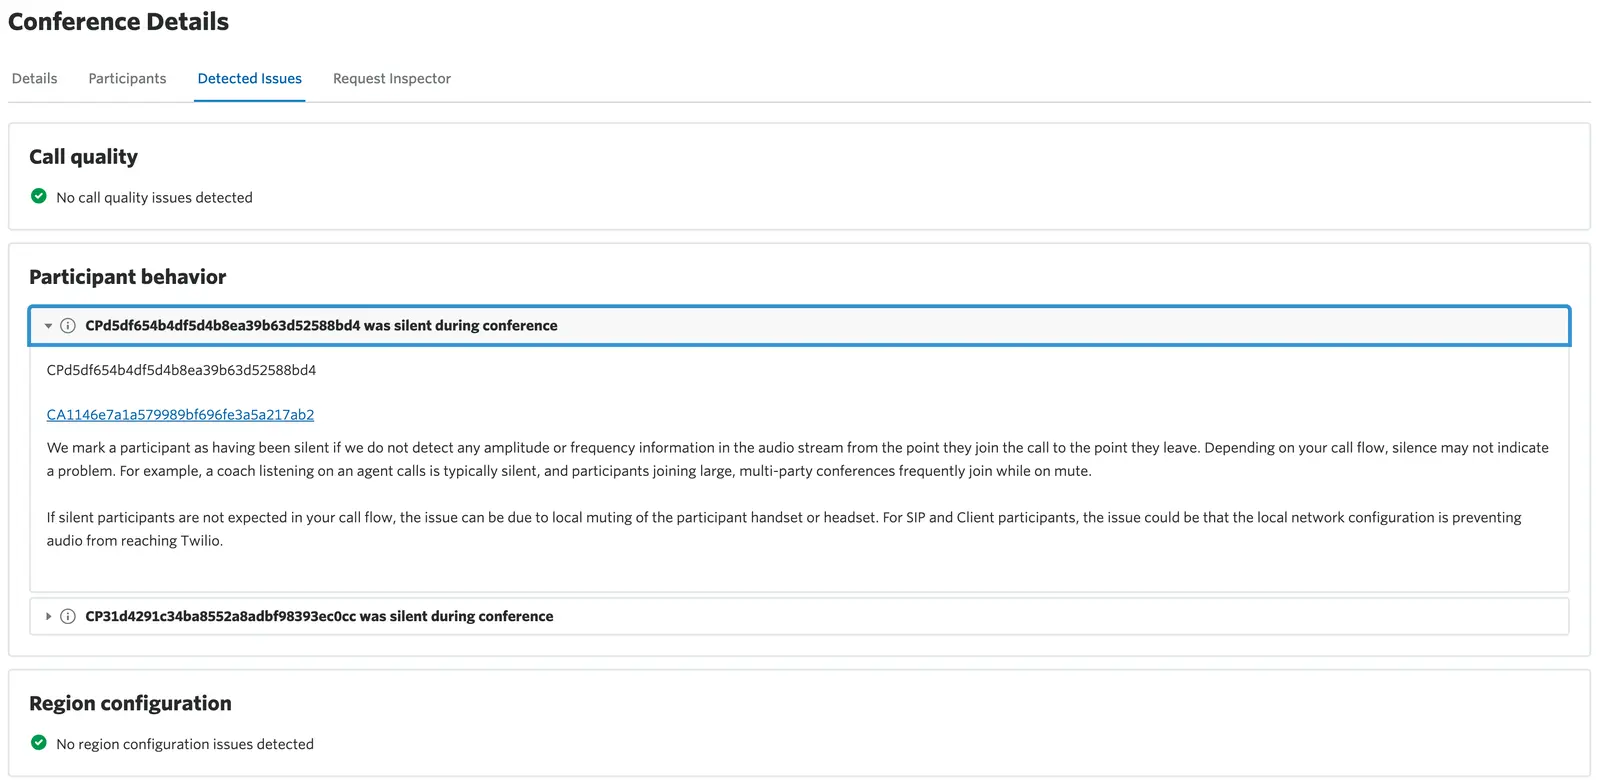
With the initial release silence detection is the only item captured under Participant Behavior. We mark a participant as having been silent if we do not detect any amplitude or frequency information in the audio stream from the point they join the call to the point they leave. Depending on your call flow, silence may not indicate a problem. For example, a coach listening on an agent calls is typically silent, and participants joining large, multi-party conferences frequently join while on mute.
If silent participants are not expected in your call flow, the issue can be due to local muting of the participant handset or headset. For SIP and Client participants, the issue could be that the local network configuration is preventing audio from reaching Twilio.
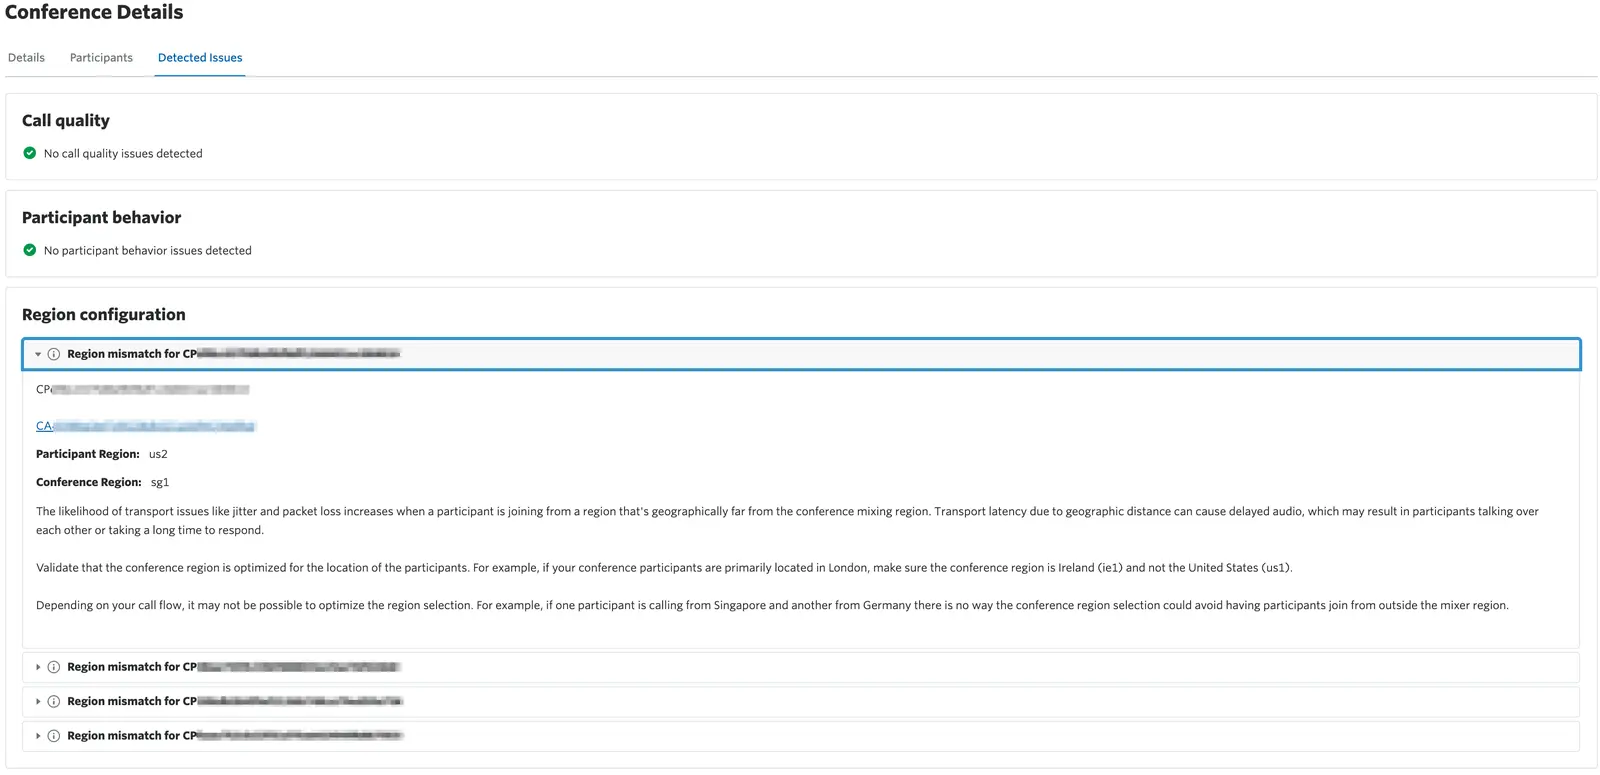
Conferences can be configured to use one of Twilio's media regions for the mixing of participant audio. In most cases it is ideal to have the participants join the conference from a region that is geographically close to the where the conference mixer has been configured. For example, a participant whose media enters Twilio from Singapore will experience latency if the conference they are joining is mixed in Ireland or Brazil. Twilio detects when a participant is joining the conference from a different region than the conference mixer and those participants will show up in the Region Configuration section of Detected Issues.
In some cases a mismatch in the region between a participant and the conference mixer is not in and of itself cause for concern; e.g. a participant in Umatilla (us2) and a conference mixer in (us1) or a participant in Frankfurt (de1) and a conference mixer in Dublin (ie1) will likely experience a small amount of additional latency, but these differences are typically not detectable. We will highlight these differences however as you may wish to optimize your participant/mixer region configuration.
For more information on how conference region selection is made, see How global low-latency routing and region selection for conferences works.
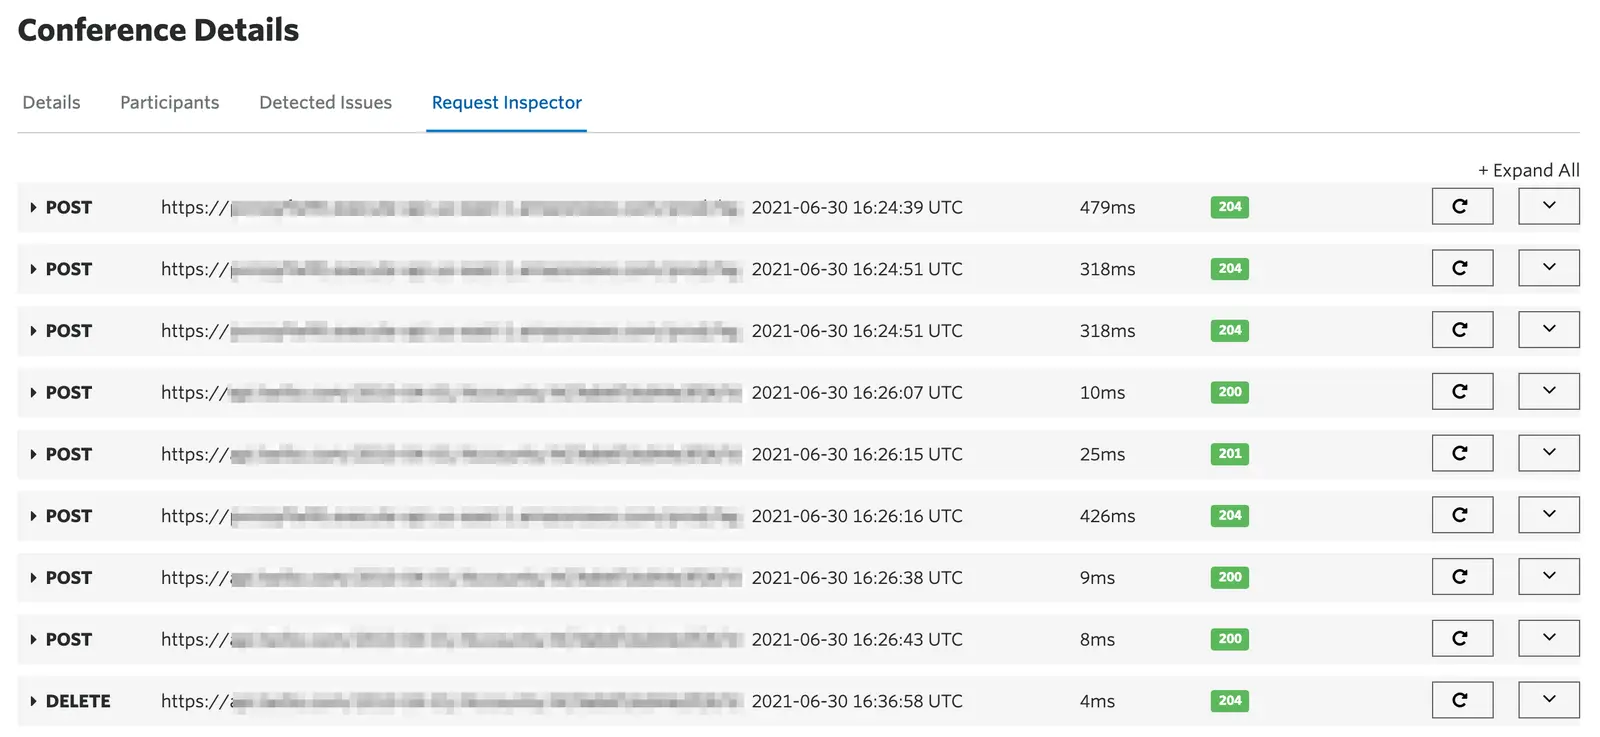
If HTTP request logging is enabled on your account you see API and webhook requests related to the conference resource listed here.
This guide covers a feature that can support the following use cases:
You can use the feature in this guide to get insights for your contact center that receives incoming calls from customers.
To learn more advanced features that you can use with inbound contact centers, see Voice inbound contact center.
You can use the feature in this guide to get insights for your programmatic outbound call center that dials customers for telemarketing.
To learn more advanced features that you can use with outbound call centers, see Voice outbound call centers.
You can use the feature in this guide to get insights for call tracking applications that help you understand the effectiveness of different marketing campaigns.
To learn more advanced features that you can use with call tracking, see Voice call tracking.
You can use the feature in this guide to get insights whenever you capture the audio of your outbound calls for AI-driven analysis. By recording the call, you can send raw audio to machine learning models for real-time transcription, sentiment analysis, or automated post-call summarization.
To learn more advanced features that you can use with AI or ML transcription, see Voice AI/ML transcription.
Explore the following guides to build on what you've learned in this guide:
- Create conference calls: Learn how to set up and manage multi-party voice conferences.
- Consume a real-time Media Stream using WebSockets, Python, and Flask: Stream raw conference audio to your application for real-time processing.
- Gather user input via keypad (DTMF Tones): Use
<Gather>within conferences to allow participants to interact via their keypad. - How to capture your first payment using
<Pay>: Securely collect credit card information during a call. - Record phone calls: Capture and store the audio of your conferences.
- Respond to incoming phone calls: Learn the basics of handling inbound calls with TwiML.