Flex Insights Analyze View
Public beta
Flex Insights (also known as Historical Reporting) is currently available as a public beta release and the information contained in the Flex Insights documentation is subject to change. This means that some features are not yet implemented and others may be changed before the product is declared as generally available. Public beta products are not covered by a Twilio SLA.
Any reference to "Historical Reporting", "Flex Insights API", "Flex Insights Historical Reporting", or "Flex Insights Historical Reporting API" in the Flex Insights documentation refers to Flex Insights.
The Flex Insights analyze tab is an environment for data discovery and visualization.
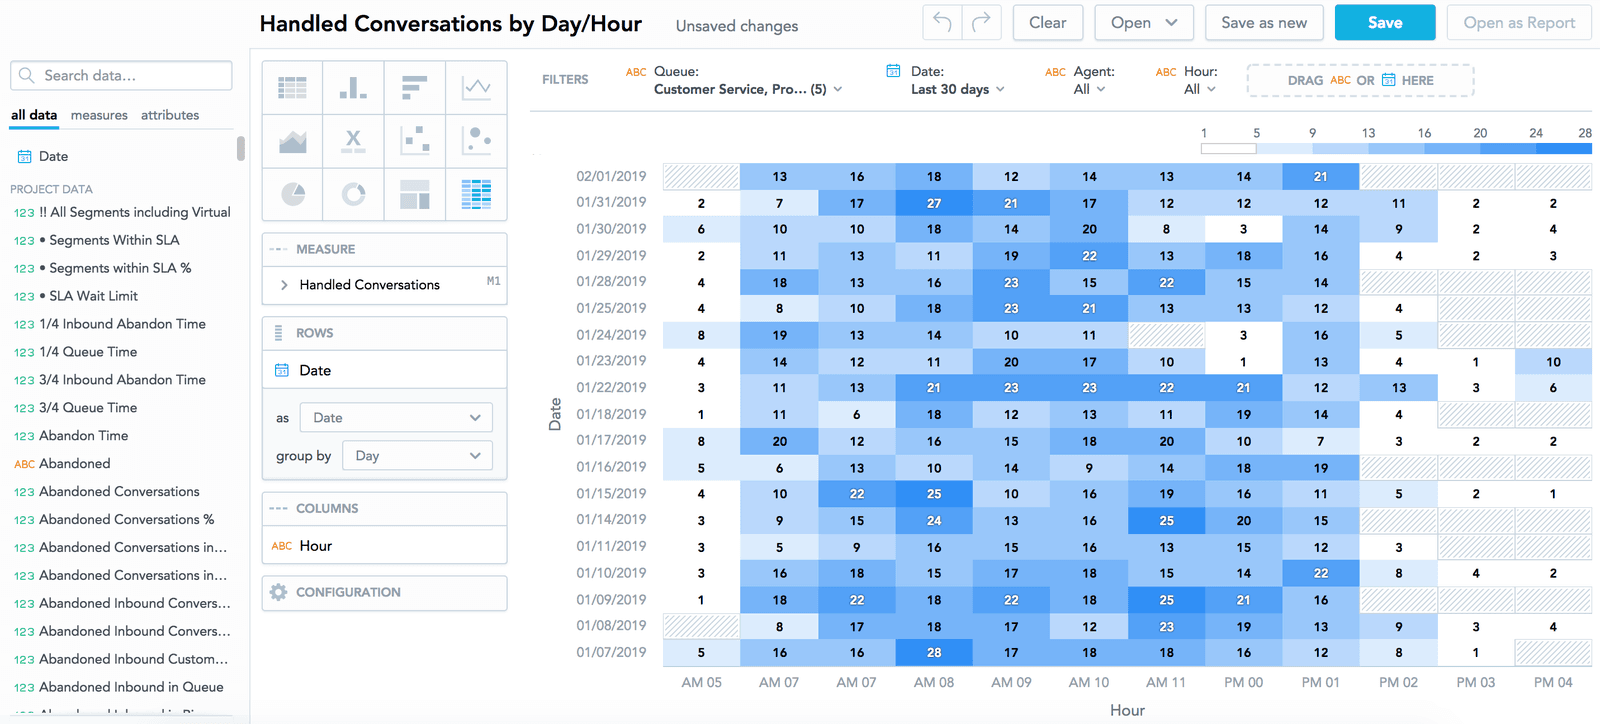
Drag and drop measures and attributes to interactive zones to:
- Create insights (charts, graphs, and tables)
- Slice the data
- Filter the data
- Change the way it is visualized
Insights change dynamically with each click, enabling you to play with your data. Analyze also recommends best practices and next steps.
To learn how to work with the Analyze view, review the following articles: