Rollup Summary in Tables
Public beta
Flex Insights (also known as Historical Reporting) is currently available as a public beta release and the information contained in the Flex Insights documentation is subject to change. This means that some features are not yet implemented and others may be changed before the product is declared as generally available. Public beta products are not covered by a Twilio SLA.
Any reference to "Historical Reporting", "Flex Insights API", "Flex Insights Historical Reporting", or "Flex Insights Historical Reporting API" in the Flex Insights documentation refers to Flex Insights.
Learn how to use the Flex Insights rollup summary to create intelligent aggregation in your reports.
Info
New to Flex Insights? Learn more about Flex Insights' dashboards and reports here.
Rollup is a very powerful and important type of summary. It is an intelligent aggregation function that uses the original metric to calculate the aggregation (instead of summing or averaging individual rows). Summing and averaging of rows may lead to results that look like "sum of counts of sets that aren't mutually exclusive" or "averages of averages," which are not always the desired result.
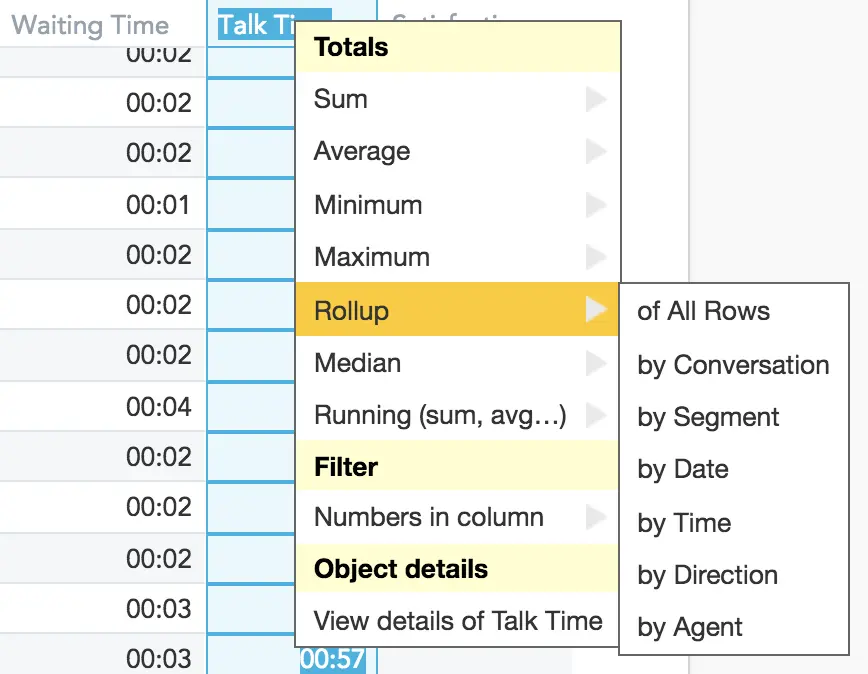
When you use rollup on a column that contains a count measure it does not do a sum of the individual rows. Instead, rollup calculates the underlying measure without the segmentation applied in the table. A sum of individual rows may cause "sum of counts" counting the same item multiple times in some cases.
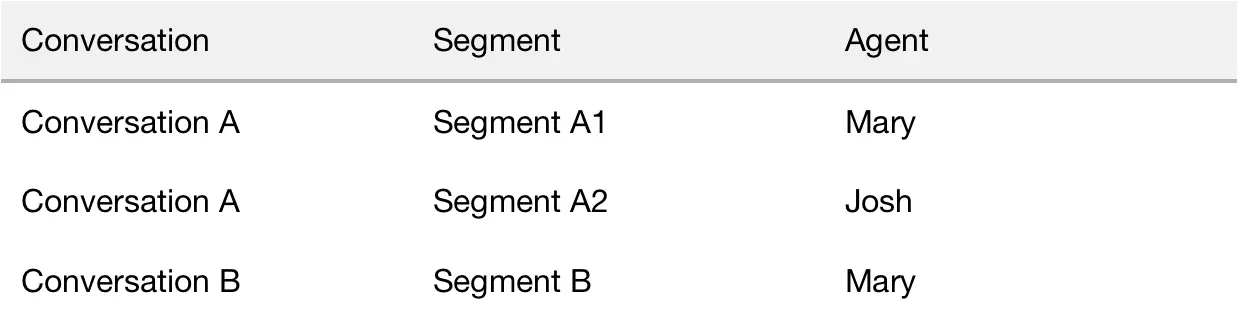
In the following example, we have two conversations. Conversation A has two segments as Mary forwards a call to Josh. The second conversation has only one segment handled by Mary.
If you create a table with the number of conversations segmented by agents you will get this result:
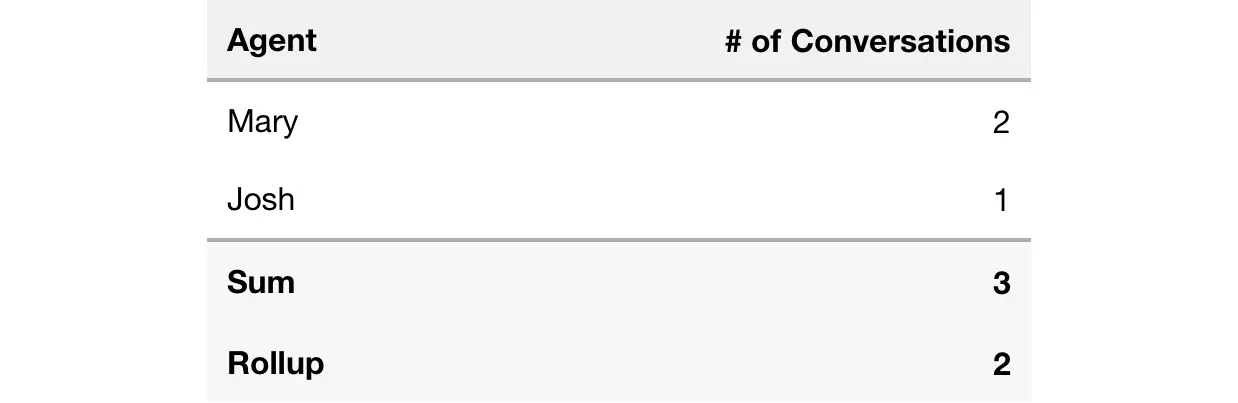
The segmented table attributes two conversations to Mary because she participated in them. It also attributes one conversation to Josh because Mary forwarded a call to him.
The sum of rows results in three conversations because Conversation A is counted twice - once for Mary, once for Josh.
The rollup does not sum the rows. Rather, it calculates the metric without considering attribution to Mary and Josh.
When you use rollup on a column that contains an average measure it does not do an average of the individual rows. Rollup calculates the underlying measure without the segmentation applied in the table. An average of individual rows may lead to calculating "averages of averages" which is often not desirable.
In the following example we have three segments handled by two different agents:
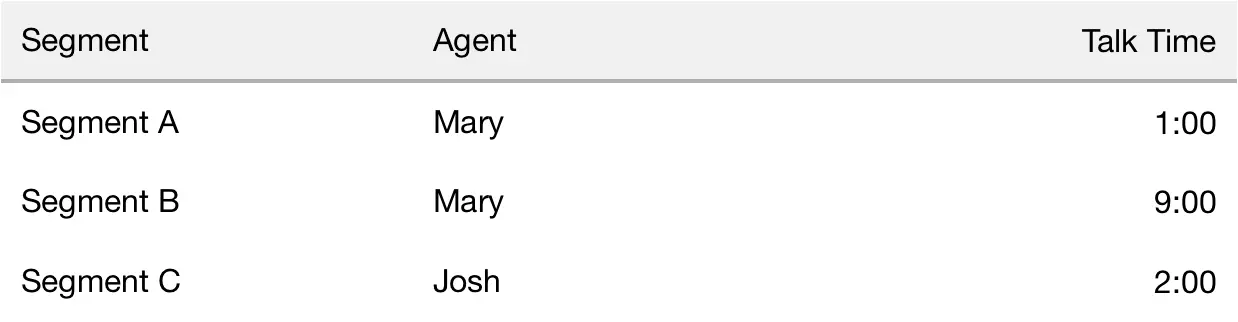
If you create a table with average talk time segmented by agents you will get this result:
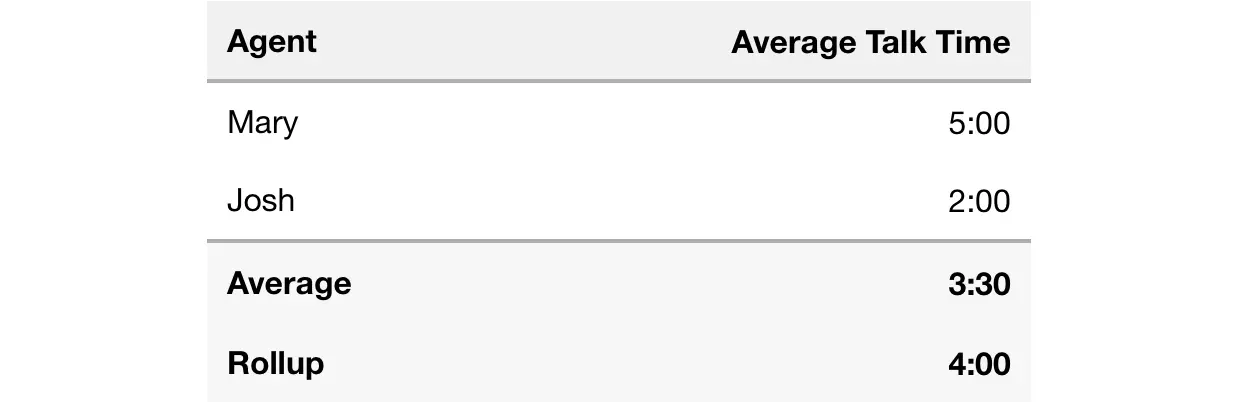
The results differ because the average with rollup takes the averages of all agents and then calculates the average of those averages. This value may be significantly different from an overall average talk time of individual segments.
Average summary results in the formula ((1:00 + 9:00)/2 + 2:00)/2 = (5:00 + 2:00)/2 = 7:00/2 = 3:30
Rollup summary results in the formula (1:00 + 9:00 + 2:00)/3 = 12:00/3 = 4:00