Flex Insights Release Notes
Public beta
Flex Insights (also known as Historical Reporting) is currently available as a public beta release and the information contained in the Flex Insights documentation is subject to change. This means that some features are not yet implemented and others may be changed before the product is declared as generally available. Public beta products are not covered by a Twilio SLA.
Any reference to "Historical Reporting", "Flex Insights API", "Flex Insights Historical Reporting", or "Flex Insights Historical Reporting API" in the Flex Insights documentation refers to Flex Insights.
You can now make custom responsive dashboards private or share it only with selected users. You can share dashboards only with the team for which it is relevant.
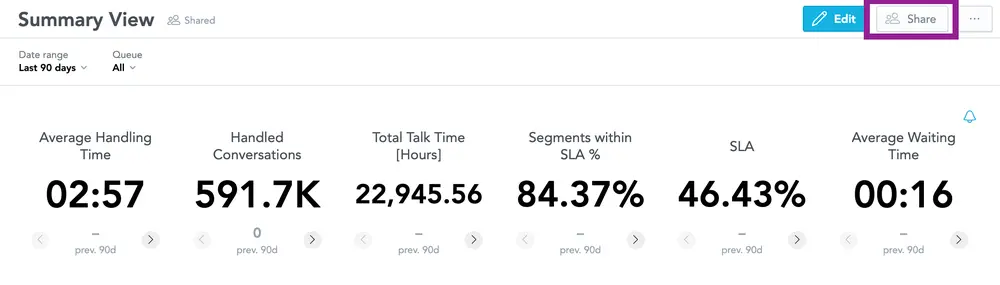
To choose users who can view a dashboard click on the Share button in the top right corner.
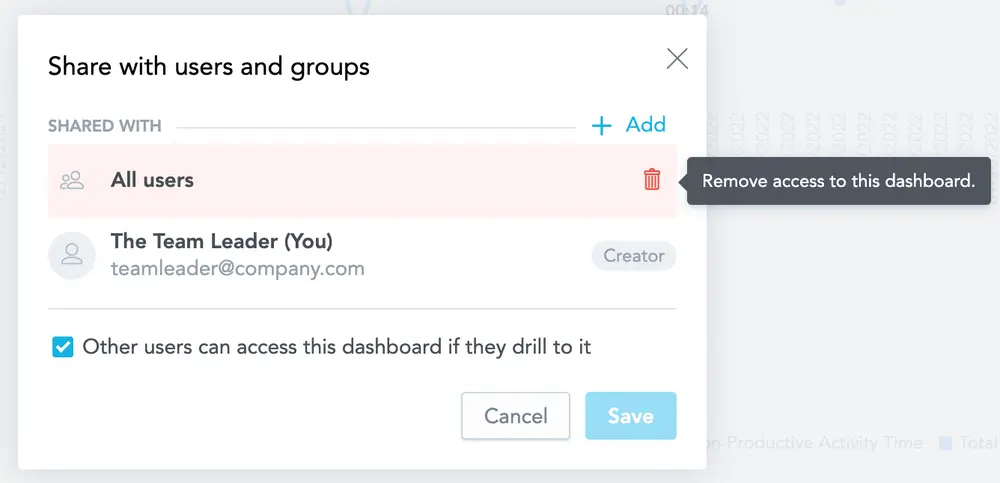
In the dialog that opens you can list users who can view your dashboard. You can add or remove All Users group to make your dashboard available to all your users with access to Flex Insights.
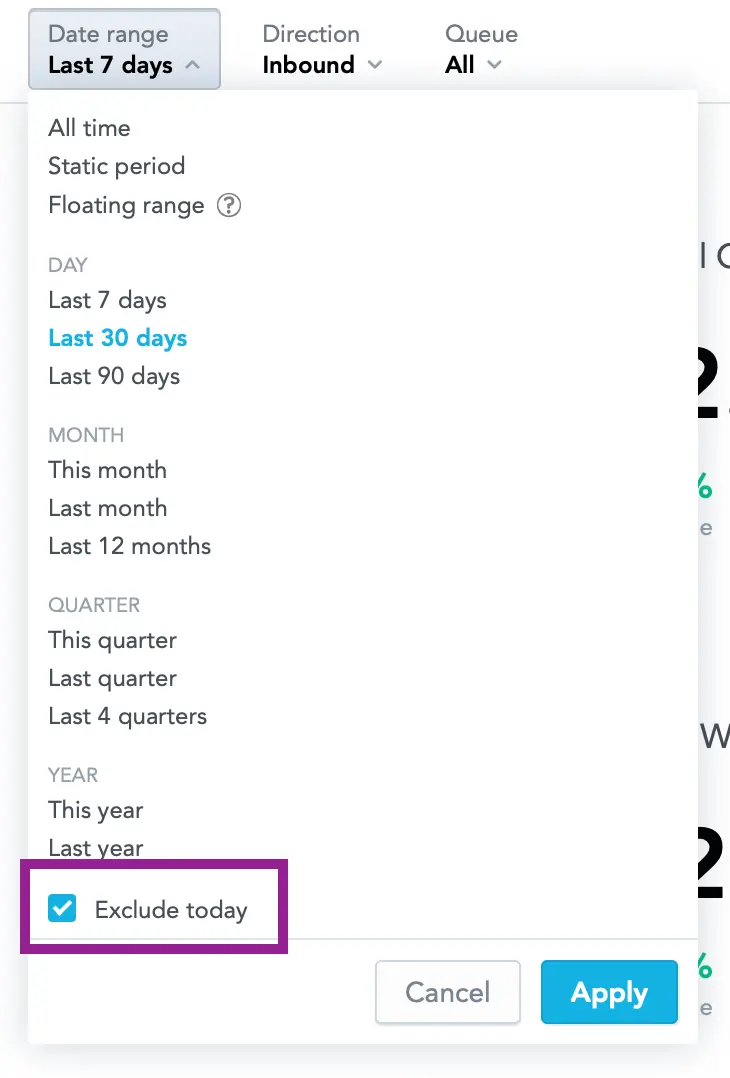
This release includes enhancements to date filters for KPI Dashboards.
You can now set floating date ranges by Days, Months, Quarters, and Years.
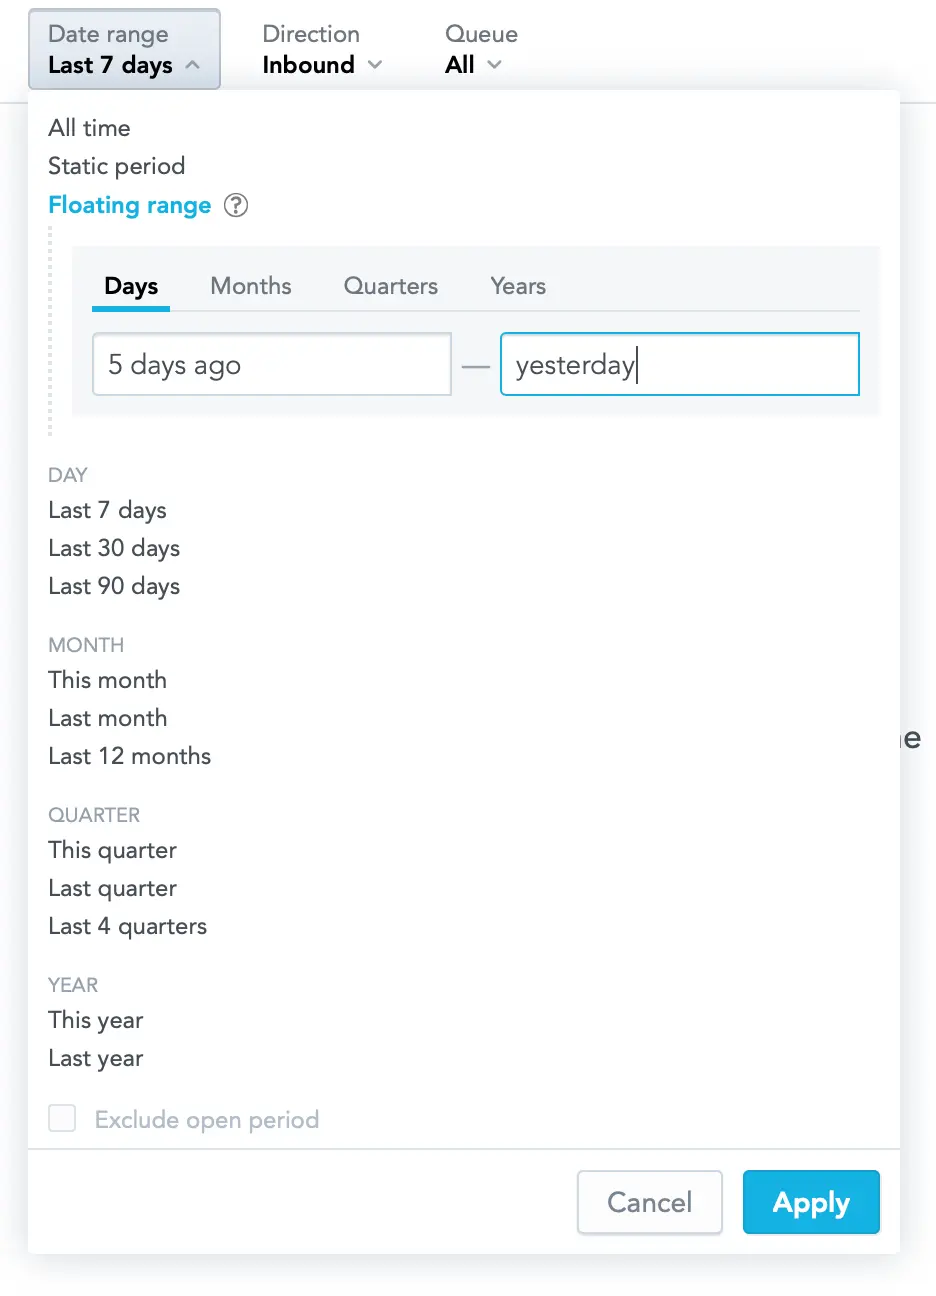
You can exclude the current time period that is not yet finished when you use a relative time frame that may include today, this week, or this month.
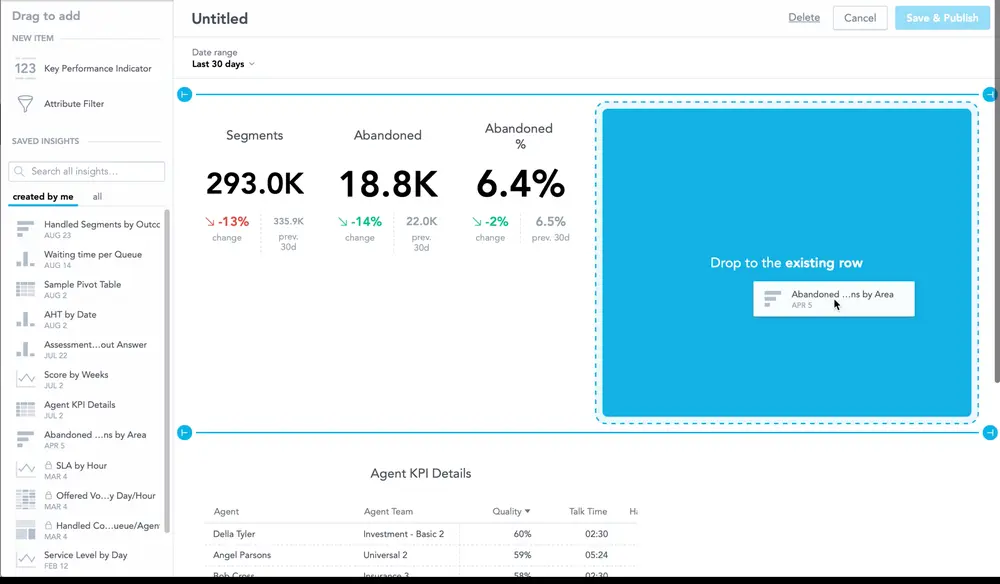
This release offers more flexibility in building new responsive dashboards.
You can better organize individual reports on the dashboard canvas. You can put multiple reports in a single row and set their widths. In case of viewing a dashboard on a mobile device, the individual reports and KPIs will stack on individual rows to adjust for limited width.
This release provides more options for building reports in Analyze, the ability to export reports directly from responsive KPI Dashboards, and more details in Player for conversations that involve multiple agents.
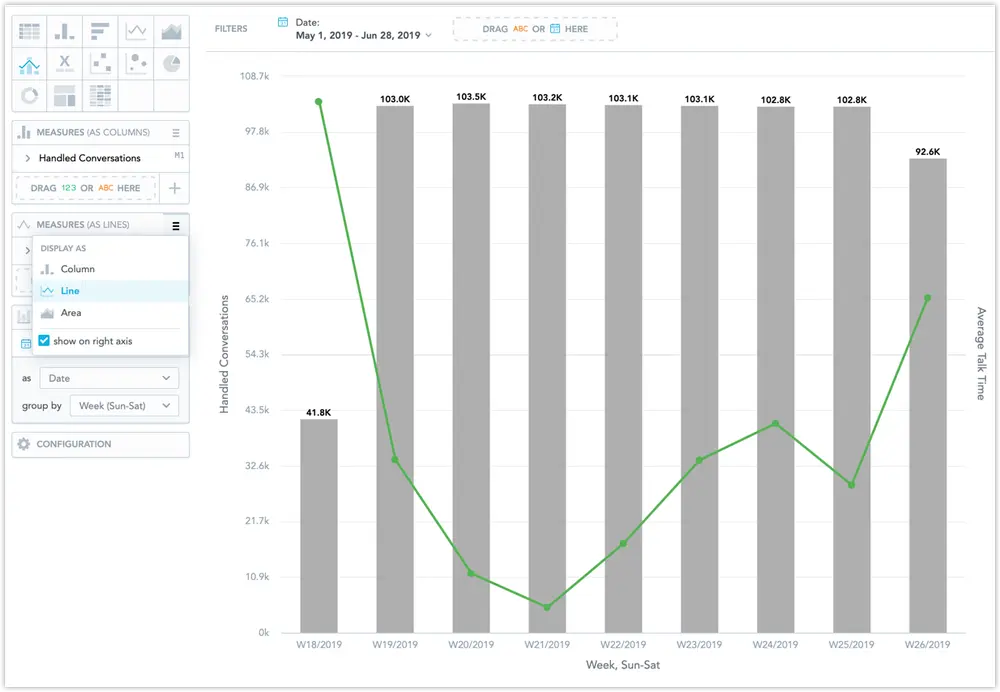
You can now combine multiple chart types in a single report that is built in Analyze. You can combine two different chart types from 3 available types - column, line, and area. You can choose on which axis the values are shown for both chart types that you use. This is great for combining measures that show volume with measures that show an average value and for other similar cases.
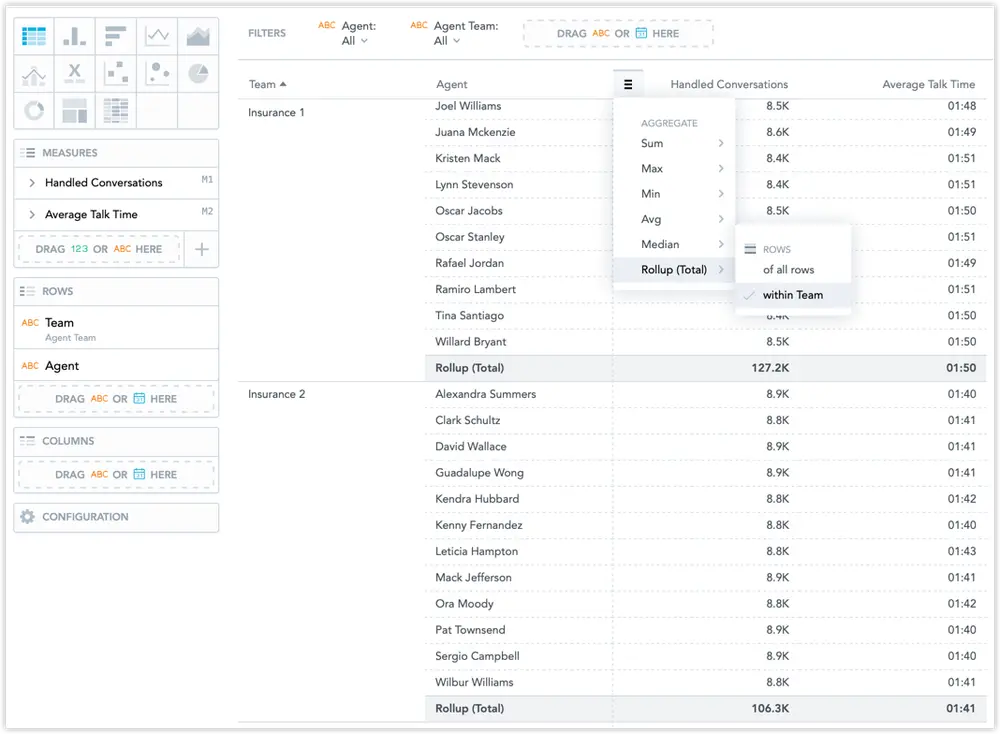
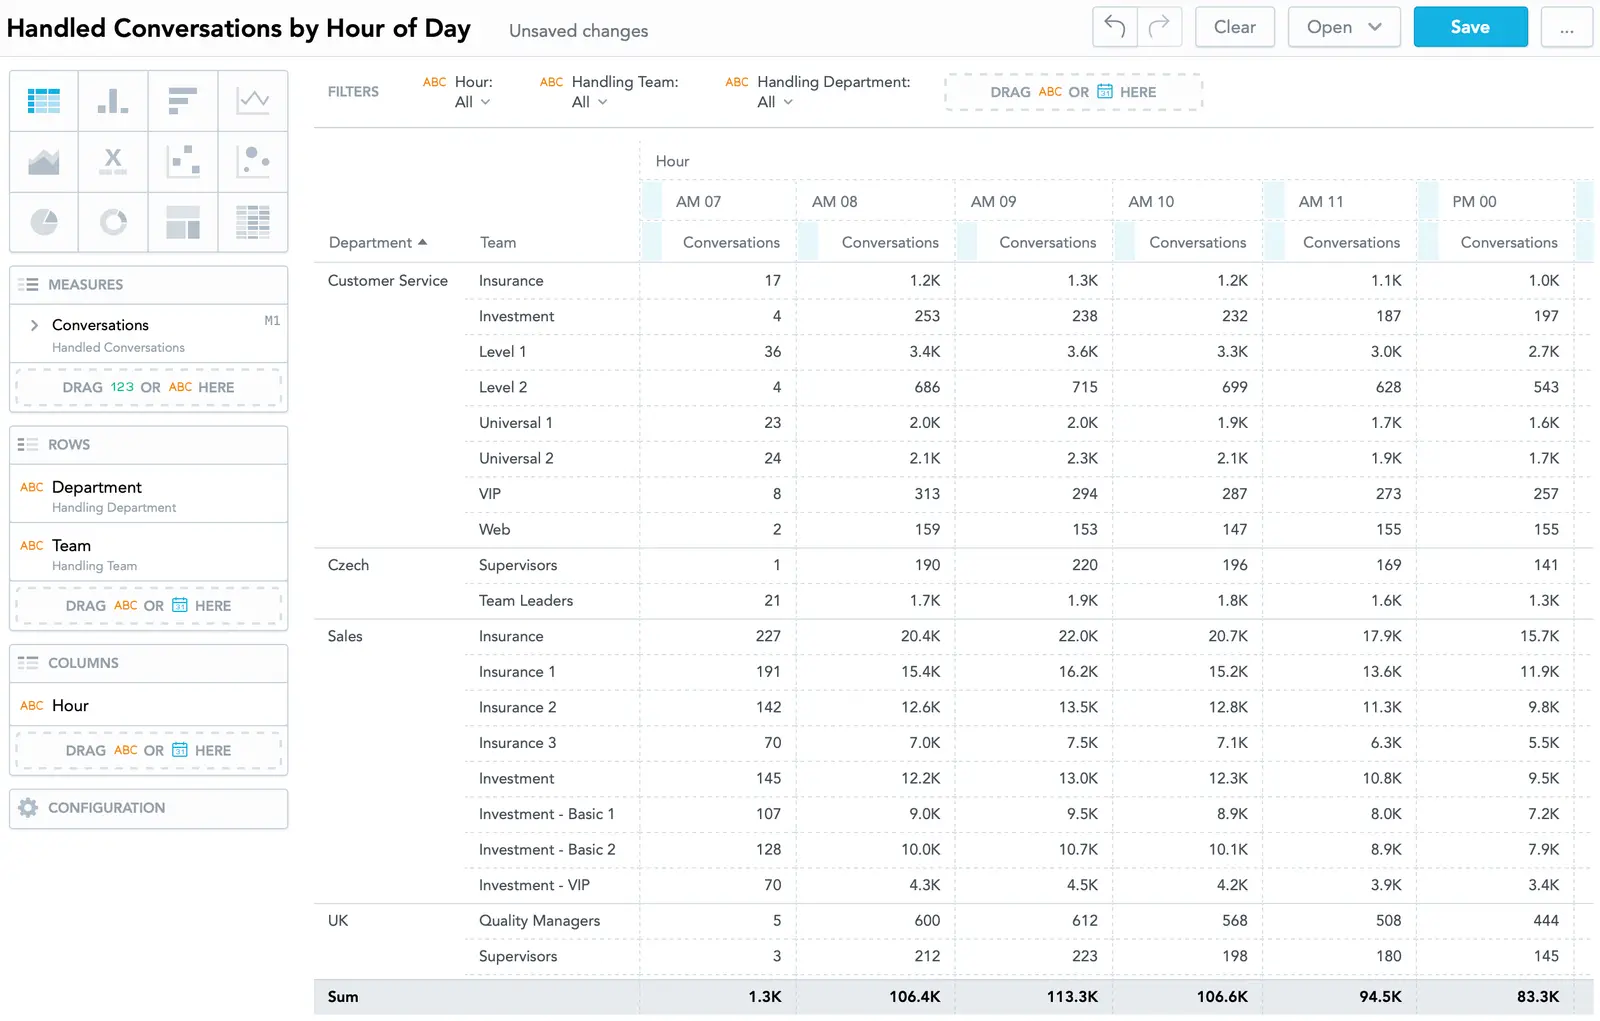
Pivot tables in Analyze can now contain subtotals. You can choose whether to show sum, average, median and other aggregations - not just for the entire table. You can now show subtotals for individual attributes used in the table. In the screenshot below, you can see the total number of calls and average talk time for individual teams.
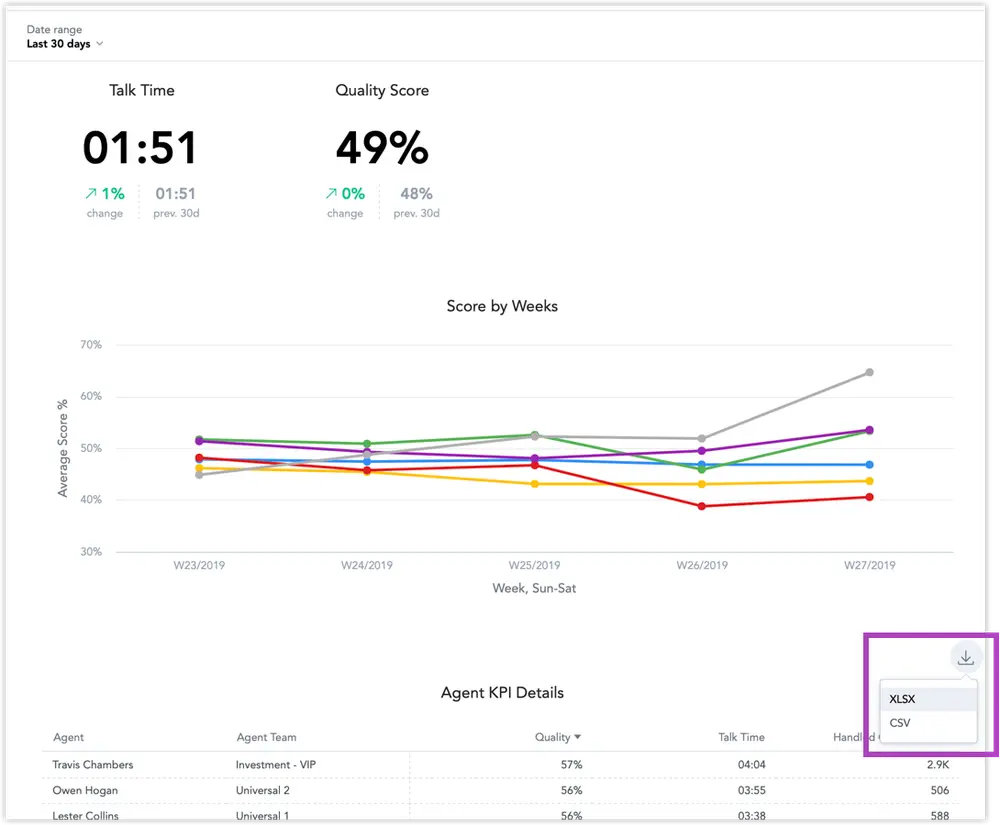
You can now export individual reports from responsive KPI dashboards in Excel and CSV format. You can prepare dashboards that contain selected data which other users can export to Excel to combine with other data or do other magic using their tool of choice.
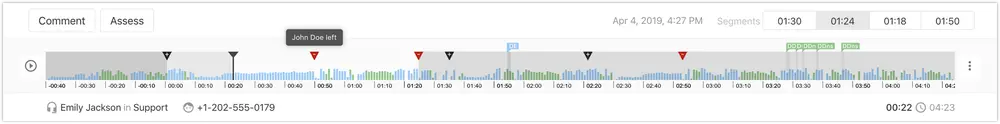
The Flex Insights Player now shows a more detailed structure of conversations that contain transfers and involve multiple agents. A small icon in the timeline indicates each time an agent joins or leaves the conversation. You can also see the entire conversation at once and can skip between segments. See the Player documentation for more details.
This release includes new options in the Analyze tab for users that use the tab to quickly explore the data to get more insight.
Tables in Analyze are now more flexible. You can segment measures in both rows and columns. You can use multiple attributes on both sides of the table. This lets you view your data in a more natural way. All plain tables created previously automatically get these pivot table features.
This release includes enhancements to the Analyze tab.
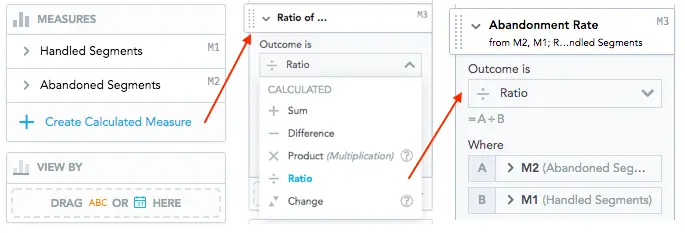
The Analyze feature now allows you to create new calculated measures directly in your insights. Use items from the Measures section and basic arithmetic functions to create new measures for your current insight.
For example, you can create measures to display abandonment rate as a ratio of abandoned segments to handled segments:
If you need to analyze data from your insights in other applications, you can now export insights from the Analyze tab to XLSX files (with merged or unmerged cells) or CSV files.
This release includes a more detailed structure for voice conversations, updates to the Control Center dashboard, and new color options to represent measures and attributes.
Voice conversations are now split into more granular segments that help you analyze transfers between queues within customer contacts. For more details, please check the updated article on Conversation Structure.
An additional set of built-in metrics and reports now provides insights into contact center KPIs such as SLAs and Handling Time.
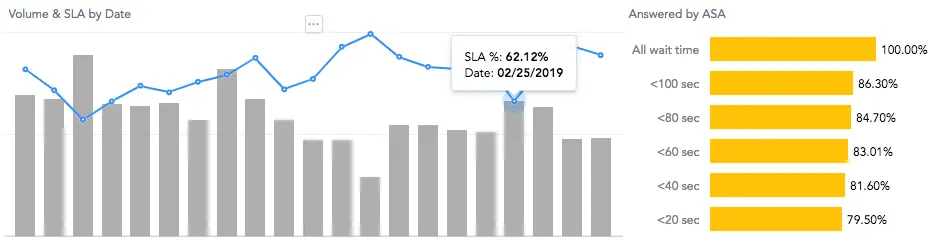
Navigate to the Queues and Handling Time dashboard tabs in your Control Center dashboard to check the updates. You can check the most recent, full list of built-in objects in the attached file: Flex Insights Metrics, Attributes & Reports.
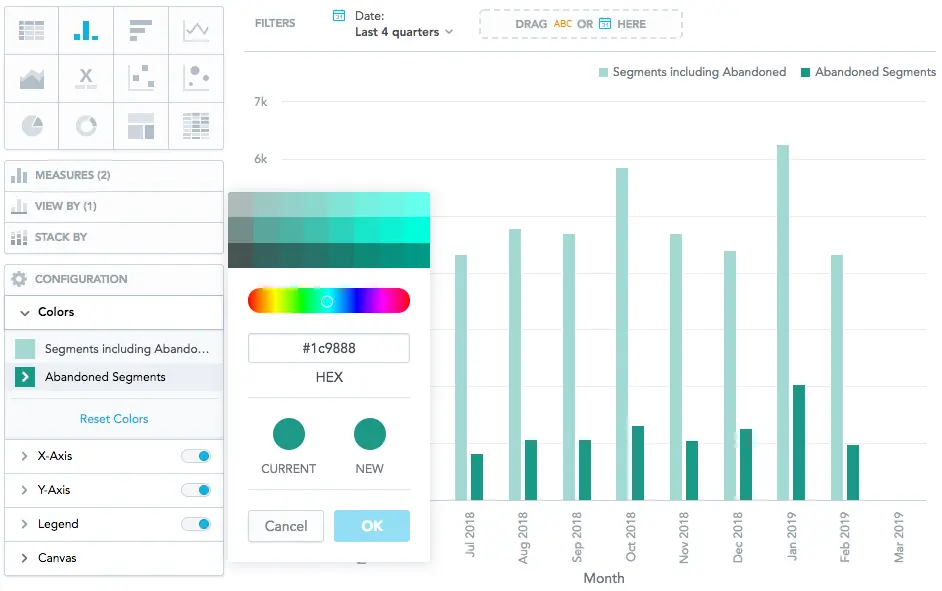
In the Analyze tab, you can now adjust any color that represents measures and attributes. You can select from a predefined set of colors from the color palette, choose a new color in the color picker, or enter a hexadecimal code to use your custom color. If the insight is included in a KPI Dashboard, the new colors are displayed there as well.