Dashboards
Public beta
Flex Insights (also known as Historical Reporting) is currently available as a public beta release and the information contained in the Flex Insights documentation is subject to change. This means that some features are not yet implemented and others may be changed before the product is declared as generally available. Public beta products are not covered by a Twilio SLA.
Any reference to "Historical Reporting", "Flex Insights API", "Flex Insights Historical Reporting", or "Flex Insights Historical Reporting API" in the Flex Insights documentation refers to Flex Insights.
Available through the Analytics Portal, a dashboard contains the reports, embedded web content, and other objects that collectively deliver a reporting solution for a category of interest.
Make sure you're familiar with these main features and functionalities to make your reporting workflows even more effective:
- Create and edit dashboards
- Sharing and permissions
- Tabs
- Dashboard filters
- Saved views
- Play conversations
- Drill down into more detail
- Export reports
- Send yourself a dashboard via email
Flex Insights' built-in dashboards serve as a starting point to inspire you to create custom reports that suit your needs. Built-in dashboards are locked and not editable.
You can create a new dashboard by selecting Add Dashboard from the dashboard gear dropdown. Alternatively, you can make a copy of an existing dashboard by clicking on the Save As option from the gear dropdown.
Warning
You must have the role of Editor in order to create and edit a dashboard.
New dashboards are hidden by default, allowing you to experiment and develop the dashboard privately and then share it only after it is complete.
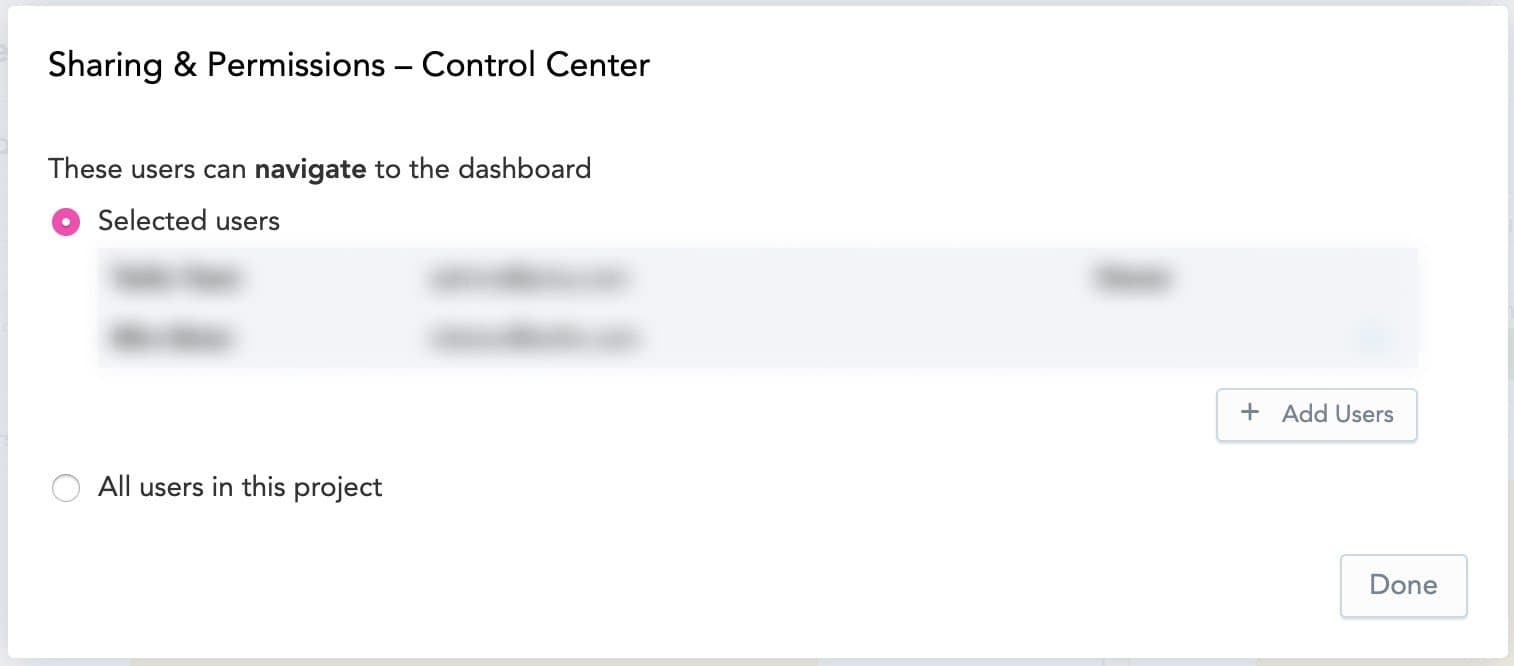
You can choose who is allowed to view and edit your dashboards. You may choose to hide a dashboard from all other users, share it with specific users, or share it with all users in a project.
Your dashboard's visibility settings are reflected in the dashboard embedded within Flex.
A dashboard contains one or more dashboard tabs.
The following image shows the Overview dashboard tab of the Control Center dashboard:
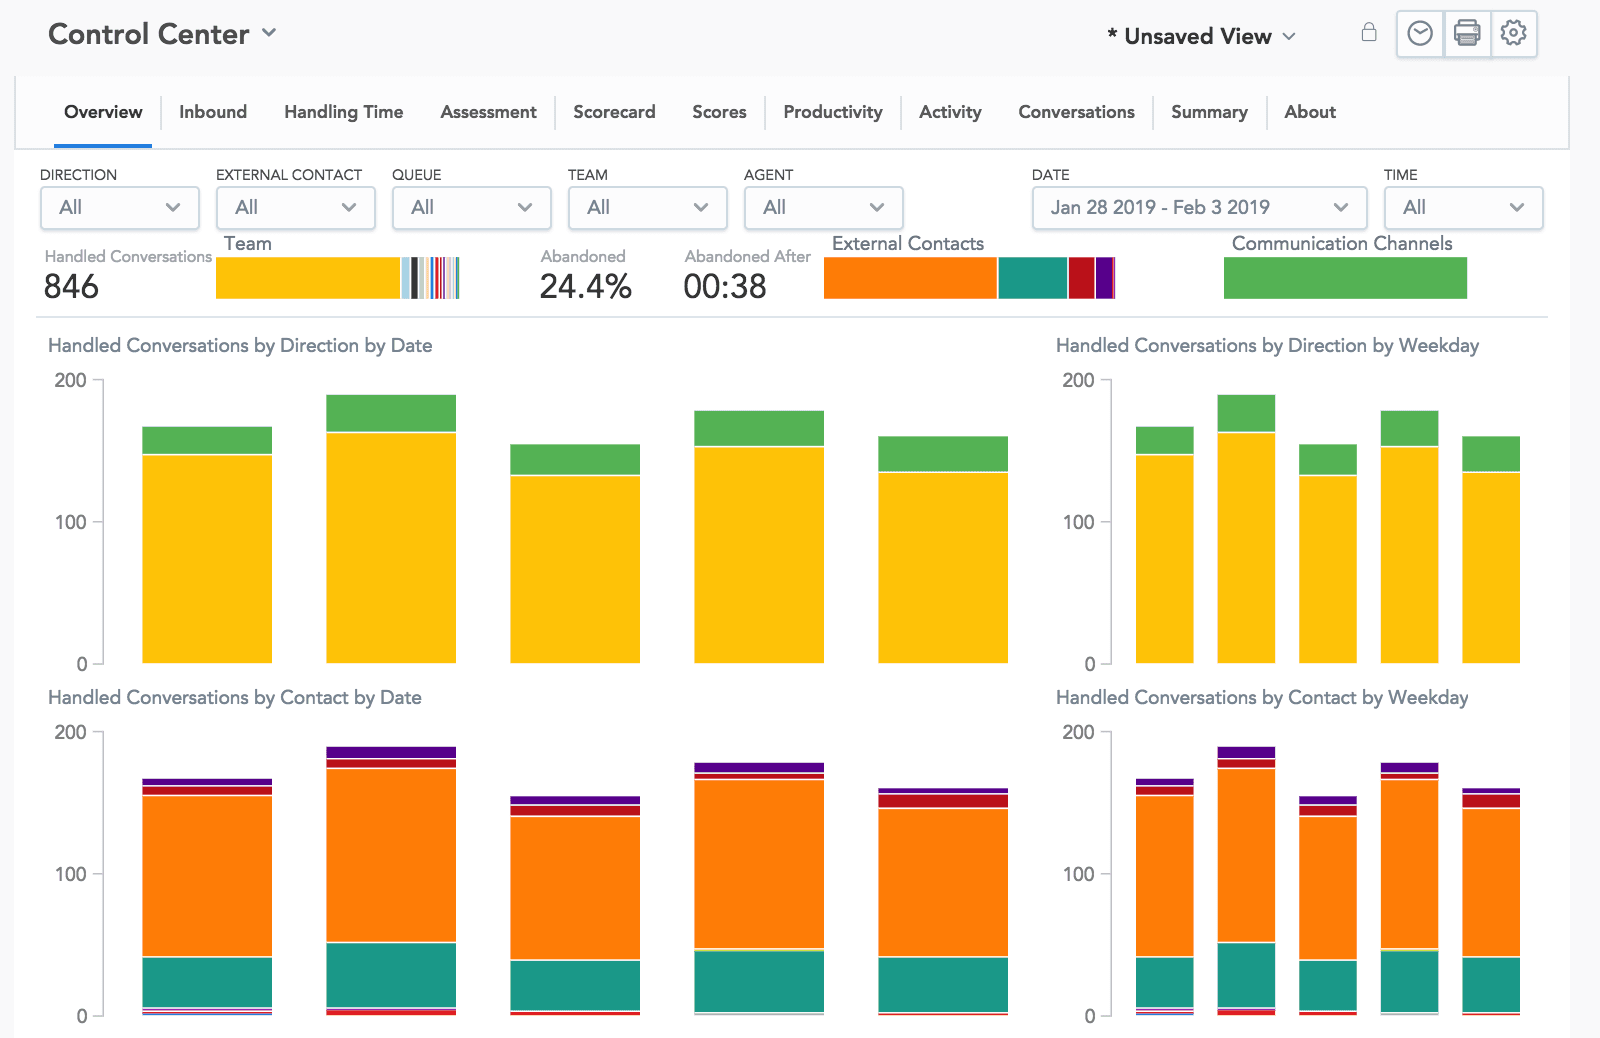
Other available dashboard tabs include Inbound, Handling Time, Assessment, Scorecard, Scores, Productivity, Activity, Conversations, and Summary.
Selected filters carry over when switching between dashboard tabs.
A dashboard filter allows you to filter report data based on a specified parameter value or r_ange of values_.
All dashboard filters at the top of a dashboard tab:
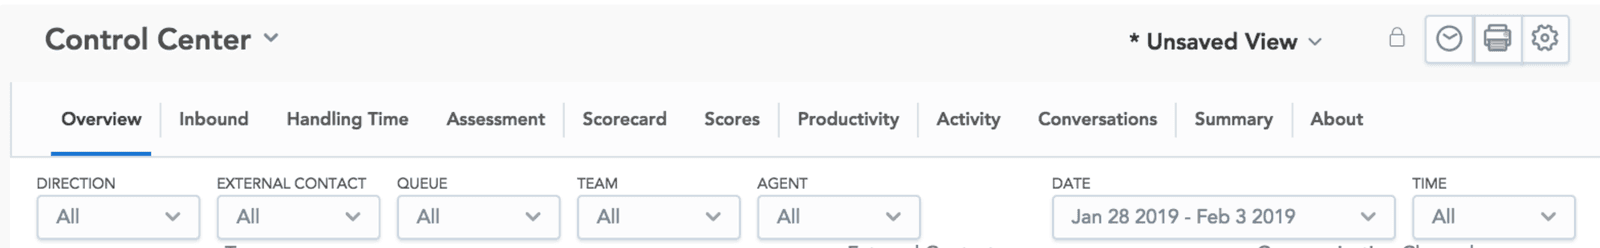
On the left, you commonly have different conversations attributes you can filter. On the right, there are date and time filters.
Filters are applied to all reports and measures on the dashboard tab unless an author of the dashboards decides otherwise.
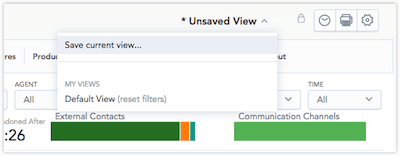
You can store your dashboard filter selection by saving a custom view. Saved views help you access previous filters in just a few clicks.
To save a current view click *Unsaved View > Save current view..., then name your view.
In order to be able to play conversations in Player it's necessary to append recording's URL links to a task's attributes. This can be done either automatically or via custom logic/source, please refer to an article here for more detail.
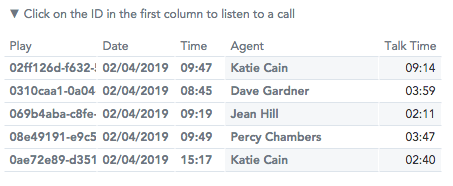
When you have a list of conversations or segments you can click on the segment ID to listen to a call.
Warning
When clicking on an ID of a conversation to launch the conversation player, your browser may block it as a pop-up. Please enable pop-ups for this domain.
You can click on values in different charts to open a pop-up window with a list of conversations and relevant metrics.
You can export your reports from the Reports and Dashboards sections to the following formats:
- PNG
- XLSX
- CSV
To export a report:
- Hover your mouse over a report to reveal a button with three dots next to the title
- Click Download As to open the list of export options
- Select a file type
- Save the report to your computer
You can regularly send yourself (or members of your team) a PDF of your dashboard via email. You can set the frequency and delivery time of emails. Additionally, you can send this email to more people on your team. Learn more about scheduling dashboard report emails here.