Using Predictions
Predictions are stored as computed traits in user profiles, with scores represented as percentage cohorts. For example, a score of 0.8 indicates the user is in the 80th percentile, or the top 20% of the cohort.
After selecting a cohort, use Predictions with the following Segment features:
- Audiences, build new audiences using Predictions as a base. Segment also provides prebuilt Suggested Predictive Audiences as part of Engage.
- Journeys; use Predictions in Journeys to trigger Engage marketing campaigns when users enter a high-percentage cohort, or send promotional material if a customer shows interest and has a high propensity to buy.
- Destinations; send your Predictions downstream to Warehouses, support systems, and ad platforms.
You can access generated Predictions in the Prediction tab of your Trait. The Prediction tab gives you actionable insight into your prediction.
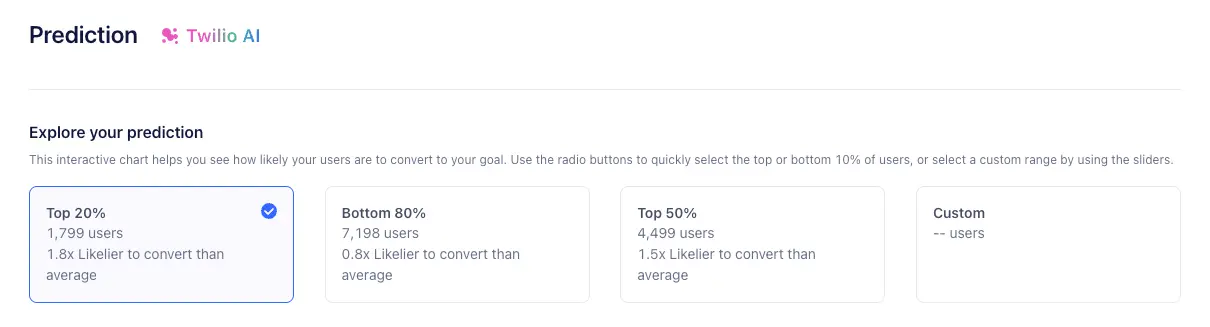
The Explore your prediction section of the Prediction tab visualizes prediction data and lets you create Audiences to target. An interactive chart displays a percentile cohort score that indicates the likelihood of users in each group to convert on your chosen goal. You can choose the top 20%, bottom 80%, or create custom ranges for specific use cases.
You can then create an Audience from the group you've selected, letting you send efficient, targeted marketing campaigns within Journeys. You can also send your prediction data to downstream destinations.
Predictions rank your customers by their likelihood to perform a specific conversion event, from most to least likely.
For each custom prediction, Segment monitors the percentile cohort where customers were ranked when they performed the predicted conversion event. After around 7 days, Segment creates a graph data visualization, allowing you to evaluate the prediction's accuracy based on real workspace data.
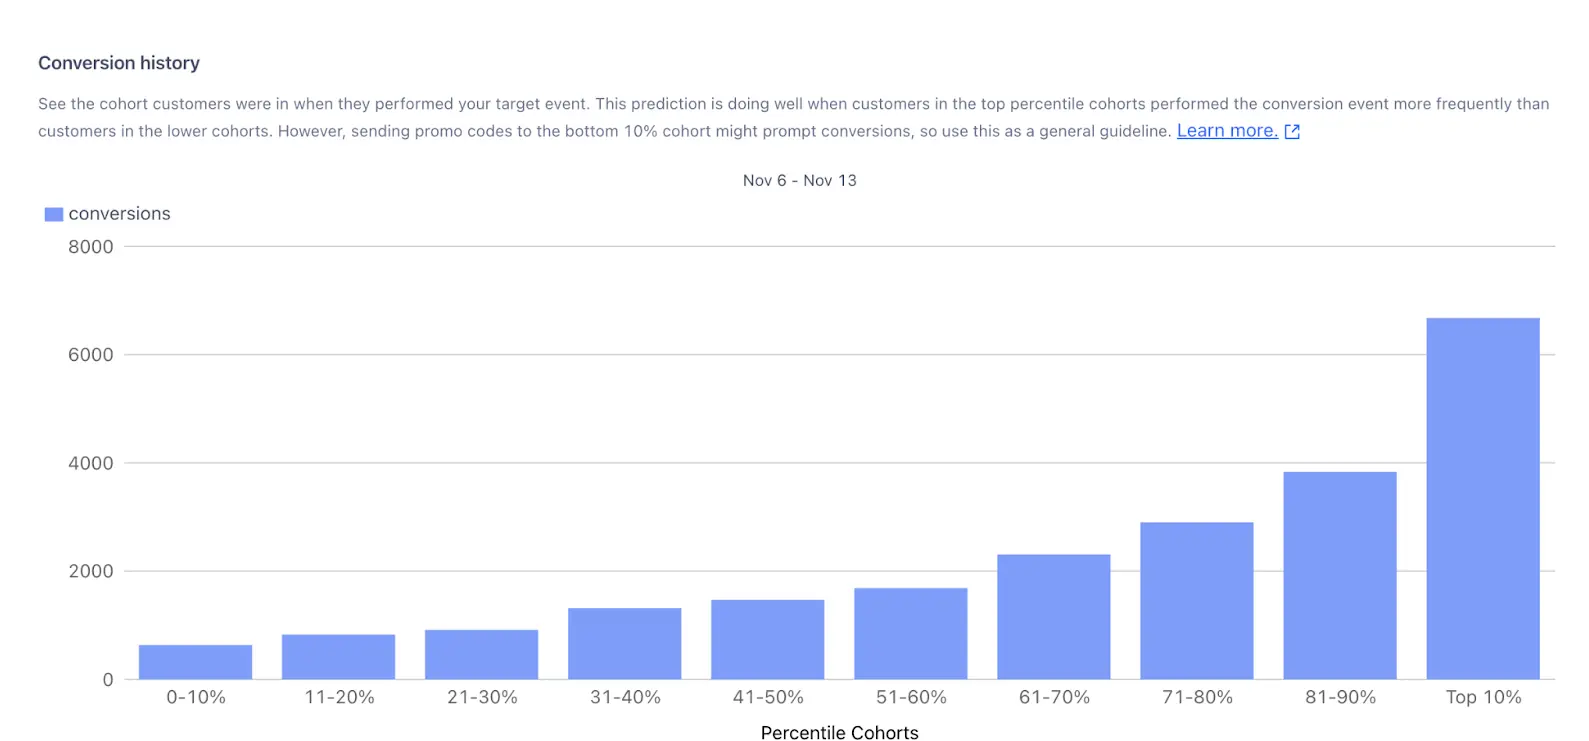
For example, suppose you're predicting the likelihood of customers completing an order_completed event. The graph shows that:
- Customers in the 91–100% cohort performed the event about 6,700 times.
- Customers in the 81–90% cohort performed the event about 3,900 times.
- Customers in the 71–80% cohort performed the event about 3,000 times.
This pattern shows that the prediction was extremely accurate in identifying customers most likely to convert. Ideally, most graphs will show a similar trend, where the highest-ranked cohorts have the most conversion activity.
However, this pattern can change depending on how you use Predictions. For example, if you run a marketing campaign targeting the bottom 10% cohort, you might see an increase in conversions for that group instead.
Like any AI or machine learning tool, Predictions may not always be perfect. Start small, test your predictions, and refine your approach as needed. Model monitoring makes it easier to measure and improve the accuracy of your predictions.
The Predictions tab's Understand your prediction section provides insights into the performance of the underlying predictive model. This information helps you understand the data points that contribute to the prediction results.
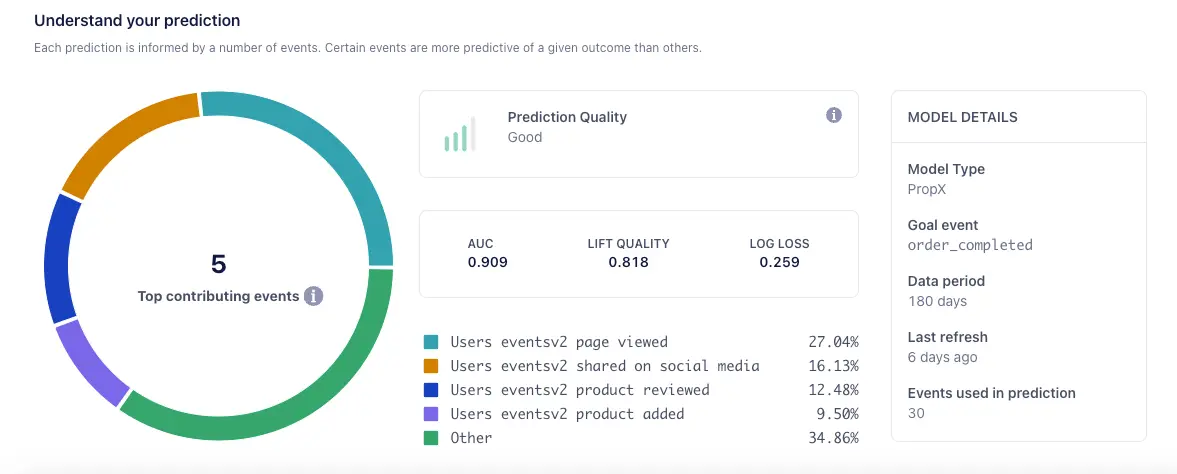
The Understand your prediction dashboard displays the following model metrics:
- AUC, or Area under the ROC curve; AUC values range from 0 to 1, with 1 indicating a perfect prediction and 0 indicating the opposite. Higher AUC indicates better predictions.
- Lift Quality, which measures the effectiveness of a predictive model. Segment calculates lift quality as the ratio between the results obtained with and without the predictive model. Higher lift quality indicates better predictions.
- Log Loss; the more a predicted probability diverges from the actual value, the higher the log-loss value will be. Lower log loss indicates better predictions.
- Top contributing events; this graph visually describes the events factored into the model, as well as the associated weights used to create the prediction.
Info
The Understand your prediction tab isn't available for the Predicted LTV computed trait because it relies solely on Order Completed events for its calculation. Other predictive traits use multiple event types, which enables this feature.
Predictions offer more value in some situations than others. This sections covers common scenarios where predictions have high impact, as well as others where alternative approaches may be more appropriate.
- Improve ad targeting; build targeted audience segments based on predictive behavior.
- Optimize campaign performance; reduce customer acquisition costs (CAC), and improve customer lifetime value (LTV) by building campaigns that target customers most likely to purchase or perform another desired action.
- Power more personalization; With Predictions, you can deliver the right message at the right time. You can create targeted customer Journeys with personalized offers and recommendations that boost conversion and promote upsell and cross sell.
- Win back unengaged customers; Predictions let you identify unengaged customers you can re-engage with personalized winback campaigns.
- Model improvement; You can extract Predictions from Segment and use them to improve proprietary machine learning models.
- Testing experiences; data teams can validate and strengthen existing machine learning models by testing proprietary models against Segment's out-of-the-box models.
- Save time on predictive modeling; data science teams can use Segment's predictive models, freeing up time to building other in-house models like inventory management and fraud alerting.
Predictions are most effective in the following situations:
- When your desired outcome is difficult to measure and not clearly defined, like activation, retention, engagement, or long-term value Journeys.
- When your product has more than 100,000 average monthly users; smaller sample sizes lead to less accurate statistical conclusions.
- When you need to save time building cohorts; Predictions lets marketers access and take action on predictive data without the help of data science teams, while also giving data teams out-of-the-box machine learning models they can use in downstream tools.
Predictions may not be as beneficial in the following situations:
- When you sell limited but highly-priced items, like enterprise software, complex medical machines, and so on; this also applies if you're in the B2B sector.
- When you don't yet have enough data; your model could produce errors if, for example, your target is too new and lacks sufficient data. Waiting a month could allow Segment to gather more predictive data.
Segment uses a binary classification model that uses decision trees.
Once Segment creates your prediction, you can check the model statistics page, where Segments shows you how the model was created. Segment also maintains automated systems that monitor model performance and will alert you if your model is not predictive.
Trait creation depends on the amount of data, but Segment expects predictions to be completed in around 24 hours. For larger customers, however, this could take 48 hours. Predictions shows a status of In Progress while computing; Segment updates this status when customers are scored.
These data science statistics measure the effectiveness of Segment's predictions when tested against historical data. For more information, refer to ROC Curve and AUC, The Lift Curve in Machine Learning, and Intuition behind log-loss score.
The Prediction Quality Score factors AUC, log loss, and lift quality to determine whether Segment recommends using the prediction. A model can have a score of Poor, Fair, Good, or Excellent.
The created trait value represents the user's percentile cohort. This value will refresh when we re score the customers based on your refresh cadence. If you see 0.85 on a user's profile, this means the user is in the 85th percentile, or the top 15% for the prediction.
Segment rebuilds the machine learning model every 30 days.
By default, Segment refreshes scores every 7 days. However, you can request that trait values update daily. Reach out to your CSM to determine your eligibility.
Predictive Traits can't be updated, but Predictive Audiences can. To modify a Predictive Trait, you'll need to recreate it.
You get five predictions as part of Engage Foundations or Unify Plus. To purchase more predictions, reach out to your CSM.
Predictive Audiences contribute to the Engage limit of 100 audiences. Whether you create the audience manually or with predictive modeling, the audience counts towards the 100-audience limit.
Yes.
Yes. Keep the following in mind when you work with Predictions:
- Predictions made for more than 100 million users will fail. Segment recommends making predictions only for non-anonymous users, or, as an alternative, use the Starting Cohort to narrow down the audience for which you want to make a prediction.
- Predictions will not work as intended if you track more than 5,000 unique events in your workspace.
- Prediction is failing with error "We weren't able to create this prediction because your requested prediction event is not being tracked anymore. Please choose a different prediction event and try again." Predictions are computed based on the available data and the conditions specified for the trait. A gap in tracking events for seven continuous days could potentially affect the computation of the prediction. Nevertheless, once data tracking resumes and there is enough data, the prediction should be recomputed.
The Predictions Builder doesn't display nested properties.
Segment calculates the average by adding the probabilities for all users and dividing by the total number of users. If a user's score in Likelier to convert than average is below 1, they are less likely to convert compared to the average user.