Voice Insights Conversation Relay Insights Dashboard
Legal Notice
Voice Insights Conversation Relay Insights is not a HIPAA Eligible Service and should not be used in workflows that are subject to HIPAA.
Conversation Relay Insights helps you monitor and improve the performance, reliability, and customer experience of AI-driven voice conversations built on Twilio Conversation Relay. By analyzing end-to-end conversational signals—like latency, interruptions, handling time, and call volume split between virtual and human agents—the dashboard highlights what's degrading the experience, where failures or friction are emerging, and how changes in agents or configurations impact outcomes. Centralized visibility across agents, time ranges, and operational segments accelerates debugging and time-to-value. With these actionable insights, product and engineering teams can quickly validate deployments, pinpoint bottlenecks, prioritize optimizations, and systematically deliver faster, more natural conversations that scale with confidence.
- Know the health of your voice AI experience: Continuously monitor Conversation Relay performance across virtual agent vs. human agent calls—including handling time, interruptions, silence, and latency—to ensure your voice agent remains responsive and stable in production.
- Diagnose degrading conversation quality: Pinpoint where customer experience is breaking down (e.g., increasing interruptions, frequent silence, longer handling times) and correlate shifts to specific agents, time windows, countries, or configuration changes.
- Find and fix latency and reliability bottlenecks: Break down end-to-end experience latency into speech-to-text, text-to-speech, network, and application components to identify the true source of delays, validate latency optimizations, and reduce awkward pauses that drive customer frustration.
- Accelerate debugging and deployment confidence: Surface connection failures, error patterns, and performance regressions so developers can validate integrations faster, shorten time-to-value, and resolve issues before they impact customers or scale.
- Prove and optimize operational efficiency and cost: Compare virtual agent vs. human agent trends and efficiency signals (e.g., token throughput, time spent, interruptions) to quantify impact, guide investment decisions, and reduce waste from slow or inefficient virtual agent interactions.
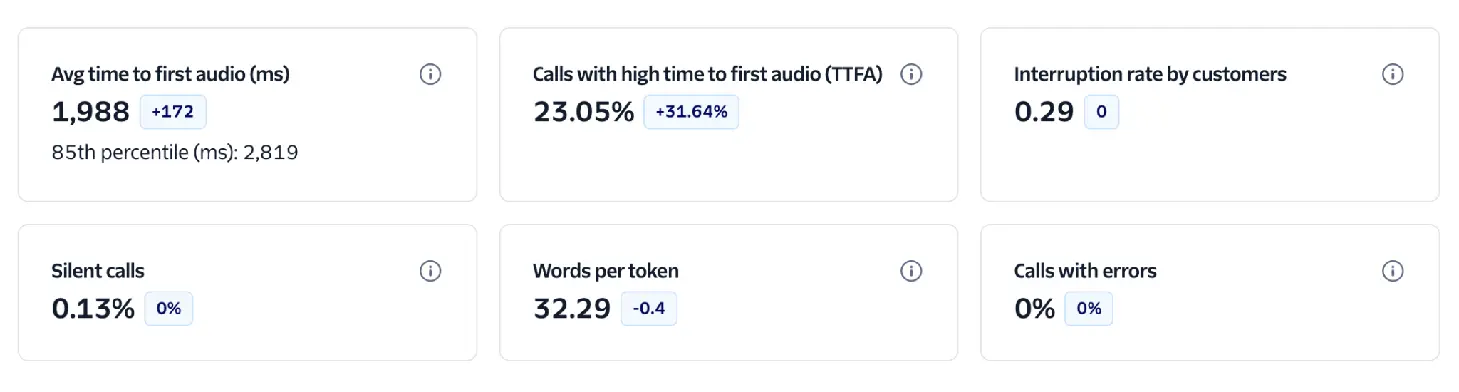
- Avg time to first audio (ms): The average time it takes for the virtual agent to begin speaking after the customer finishes talking. High values can indicate system delays in speech recognition, model processing, speech synthesis, or network connection, which can create awkward pauses and reduce engagement.
- Calls with high time to first audio (TTFA): The number of calls where the agent took longer than 1.2 seconds to start responding. This surfaces responsiveness issues that are most noticeable to customers and can help teams quickly spot performance regressions.
- Interruption rate by customers: How often customers talk over the virtual agent while it is speaking. High interruption rates can signal poor turn-taking, impatience with latency, responses that are too long, or an experience that isn't listening effectively.
- Silent calls: The percentage of calls that were completely silent from at least one side (customer, agent, or both). Silent calls may be caused by connection issues, system delays, misconfigurations, or user confusion.
- Words per token: The average number of words represented by each token produced by the virtual agent. This helps you understand token behavior and efficiency—especially when comparing agents or configurations that stream tokens versus delivering responses in larger chunks.
- Calls with errors: The number of calls that encountered one or more Conversation Relay-related errors. This KPI helps you monitor reliability, detect integration issues early, and prioritize debugging when error rates spike.
What is a token?
Tokens in Conversation Relay are the chunks of text we receive from your WebSocket in the token attribute of your messages. They may not directly map to token usage in your LLM. If tokens seem low in these charts, you may be sending large chunks of text to Conversation Relay instead of streaming tokens.
The total number of calls on this account, including virtual agents and human agents.
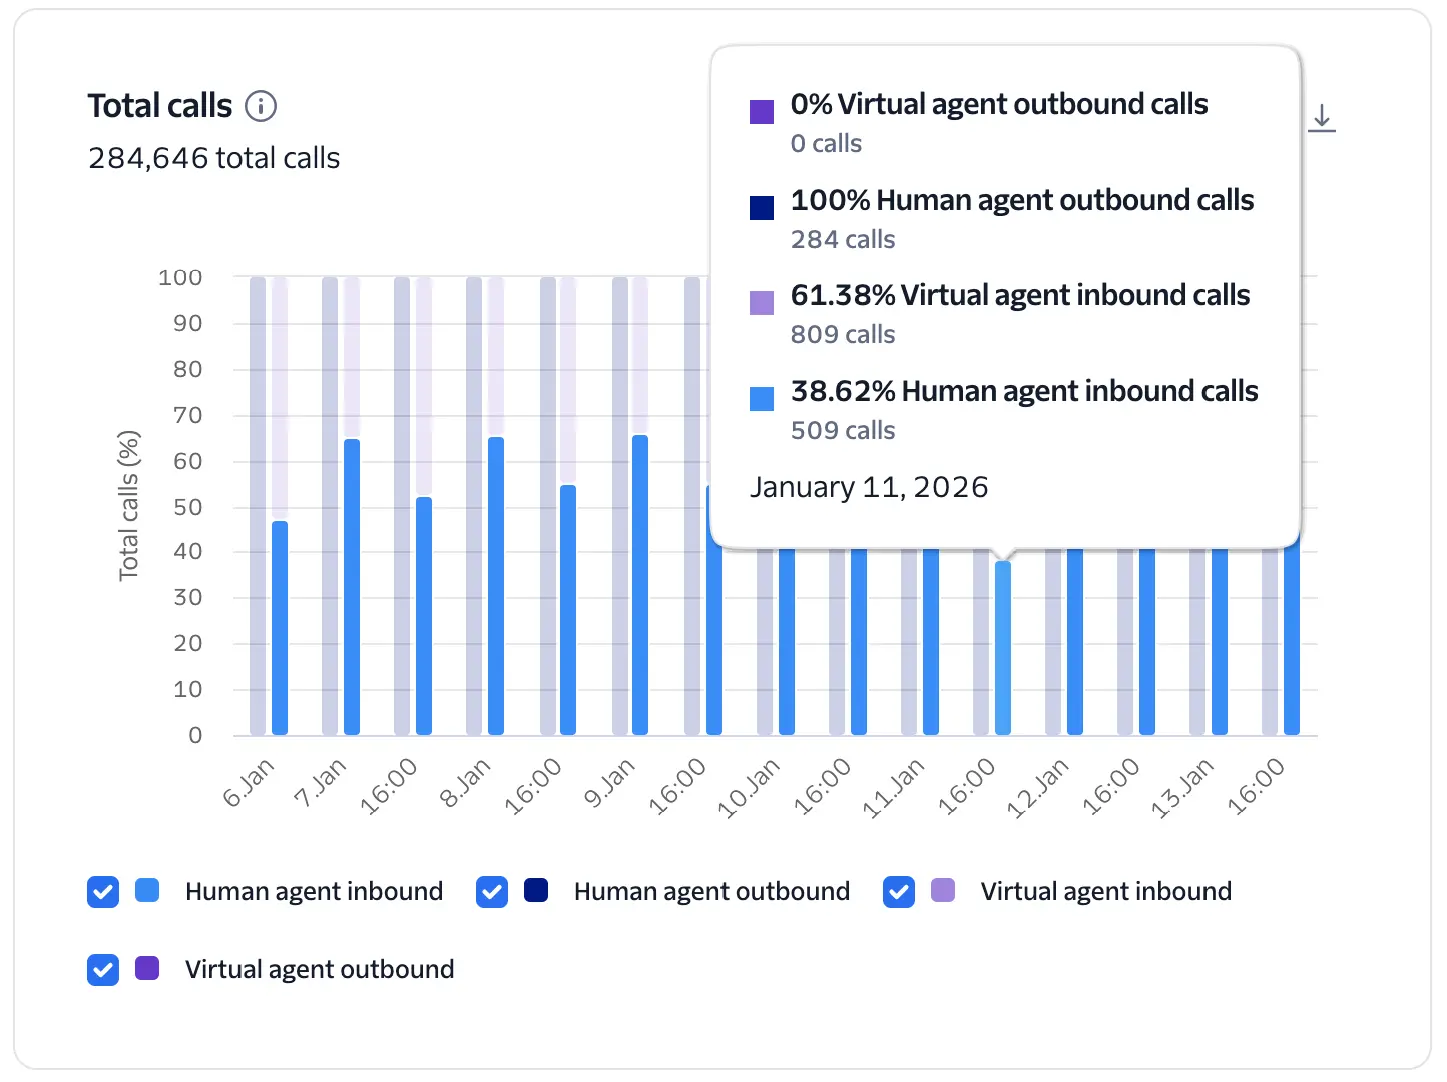
This chart provides a high-level view of call volume across your account, comparing Virtual Agent calls against Human Agent calls and further segments by call direction (Inbound vs. Outbound).
Calls are categorized as "Virtual Agent" if they execute the <Connect><ConversationRelay> TwiML. Direction is determined as follows:
- Inbound: Calls to your Twilio phone numbers, calls originating from Twilio Voice SDK users, and SIP trunking origination calls.
- Outbound: Calls made from your account via
<Dial>, the Calls API, the Conference Participants API, and SIP trunking termination calls.
Compare the mix of human vs. virtual agent calls with your targets for adoption of automated call handling. Adjust the top-level filters to narrow the calls for more specific analysis by phone number. A rising trend in Virtual Agent calls relative to Human calls indicates successful AI adoption and scale. Sudden drops in Virtual Agent volume may signal configuration errors or issues with the upstream WebSocket connection.
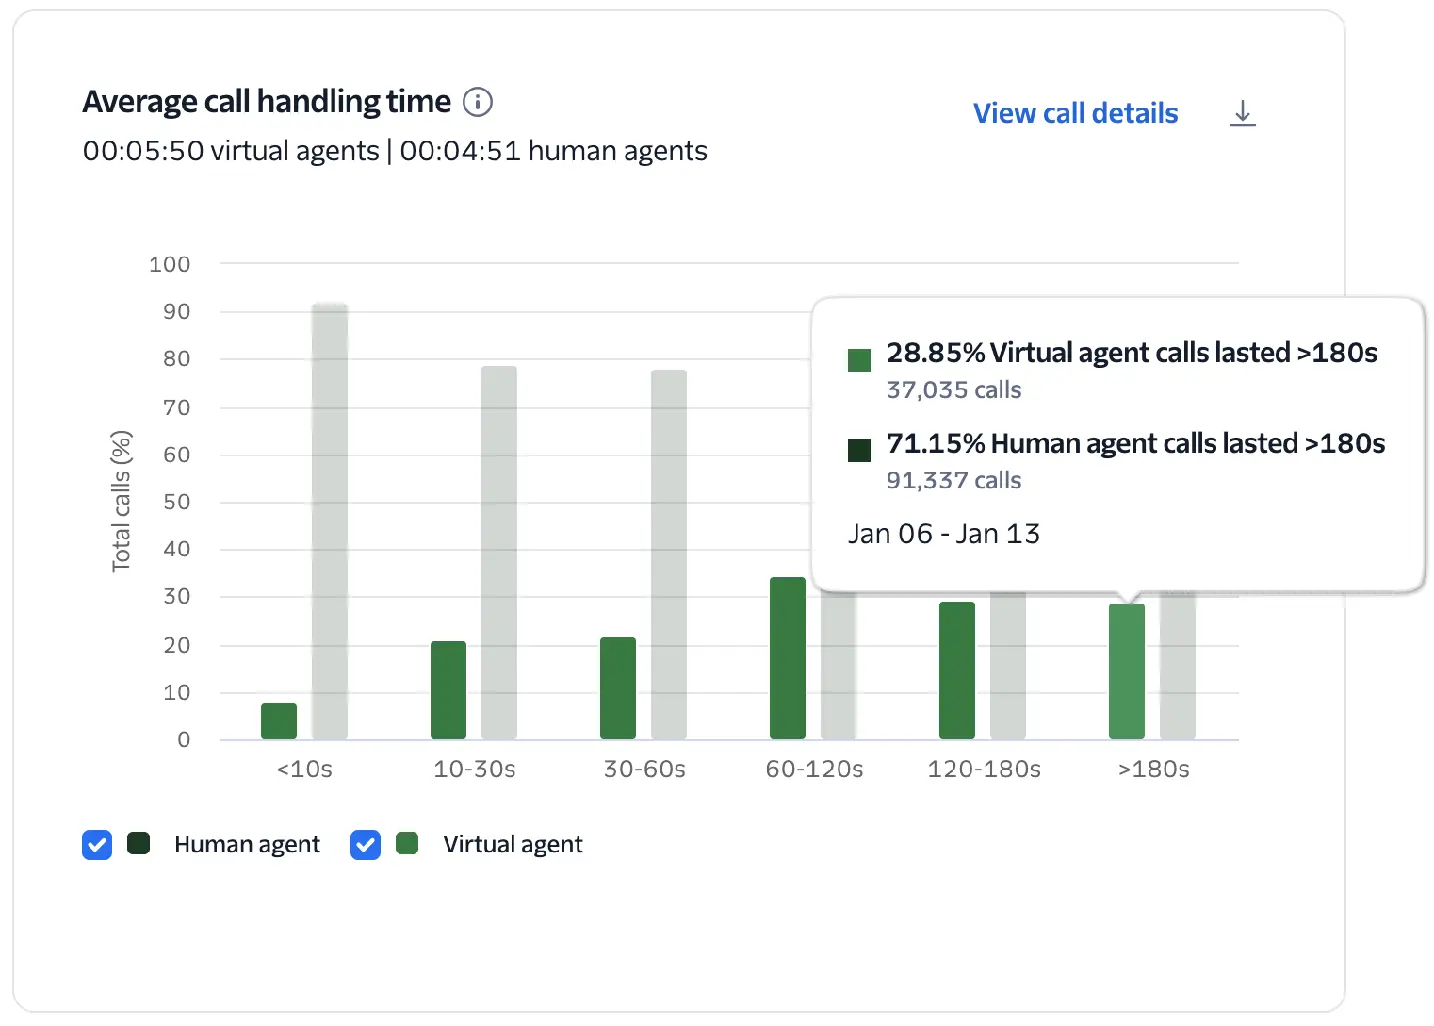
Average call handling time
Total duration of a call from start to end, including all AI and human interactions. Helps identify efficiency or latency issues. Long durations may indicate complex queries or delayed responses.
This chart visualizes the percentage of human vs. virtual agent calls and groups them into duration buckets ranging from short (<10s) to long (>180s). This allows you to compare the handling-time efficiency of your virtual and human agents.
Measured as the total time in seconds between when the call was answered and when it ended. Calls that were handled by both a virtual agent and transferred to a human agent count only as virtual agent calls.
Longer durations for virtual calls may indicate complex user inquiries, but they can also signal high latency or "loops" in the conversational flow, as well as calls that are handed off to a human agent. Conversely, very short virtual agent calls (<10s) can indicate a system issue prematurely disconnecting (compare with Who Hung Up, Silent Calls, and Calls with Errors).
- Review long duration calls to identify points of friction, unnecessary back-and-forth, or human handoffs. Combine with Conversational Intelligence to identify contributing factors from the conversation transcripts.
- Check the interruption rate and latency on long calls; high interruptions during long calls suggest the virtual agent is being too verbose or the latency is causing a more difficult experience.
- For short calls, compare with Who Hung Up, Silent Calls, and Calls with Errors to identify system issues causing premature disconnect.
Identifies whether the customer or the agent ended the call. Frequent customer hang-ups may suggest dissatisfaction, confusion, or system unresponsiveness.
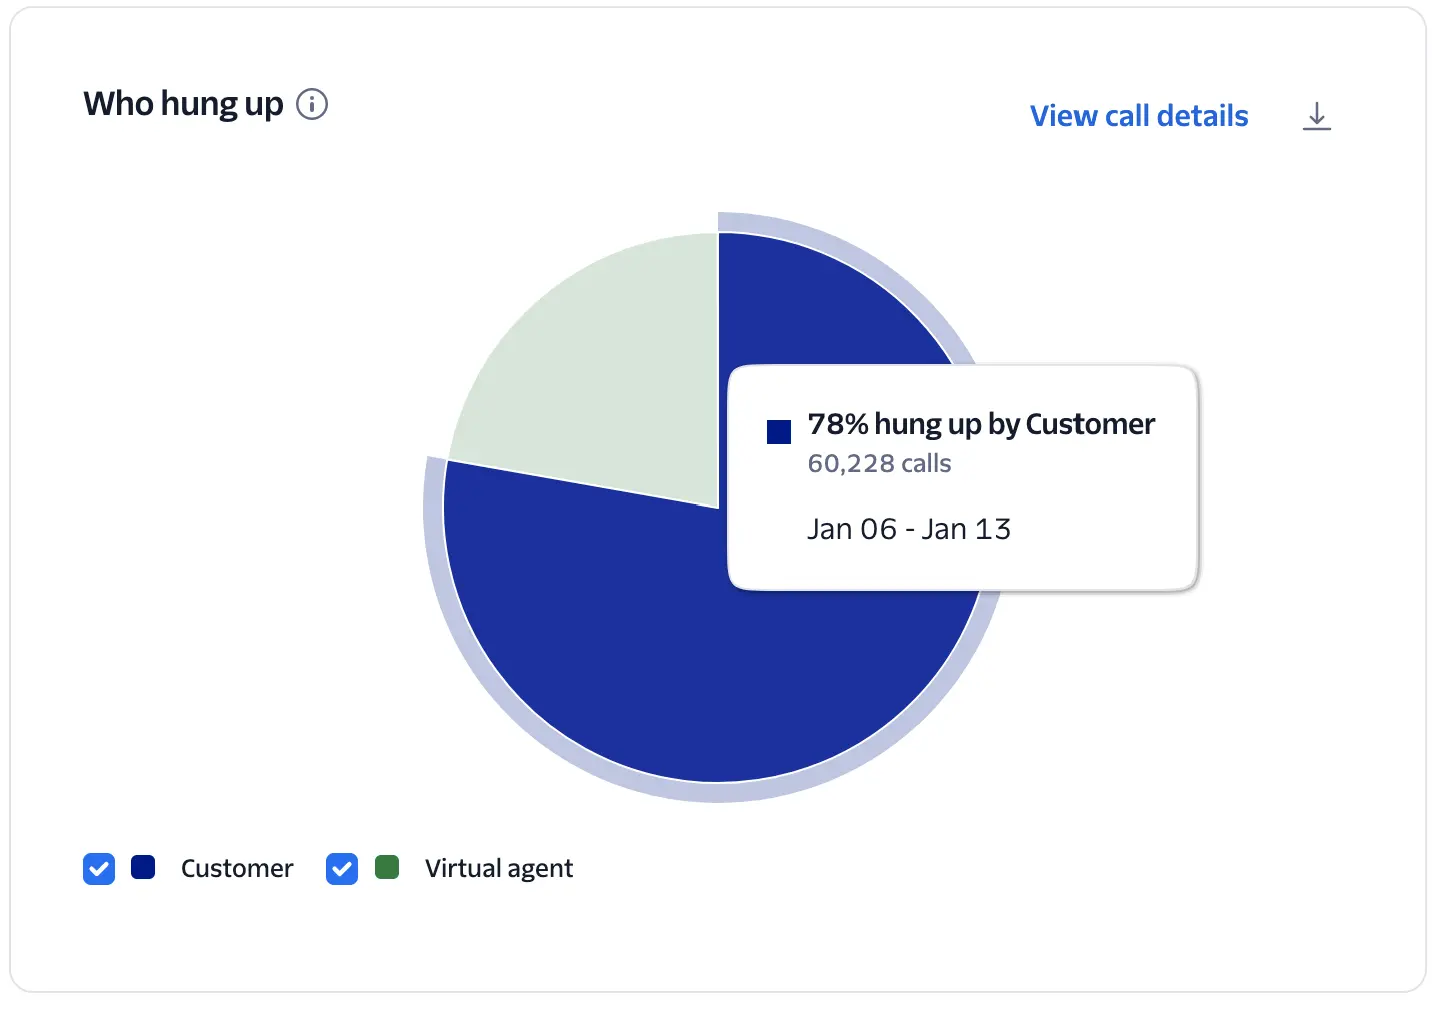
A pie chart identifying whether the Customer or the Agent hung up the call.
The system uses call hangup data to determine if the disconnect was initiated by the customer or the virtual agent.
A high percentage of customers hanging up isn't necessarily a cause for concern, as it may simply mean they got what they needed and hung up. But customer hang-ups may indicate dissatisfaction, confusion, or system unresponsiveness when correlated with spikes in calls with errors, high latency, and short duration calls.
- Compare hangups with other charts to get a better understanding of customer behavior, including Calls with Errors, Virtual Agent Response Time, Average Call Handling Time, and Silent Calls.
Measures how quickly the virtual agent replies after a customer finishes speaking. Longer response times may indicate latency in processing, intent detection, or TTS generation.
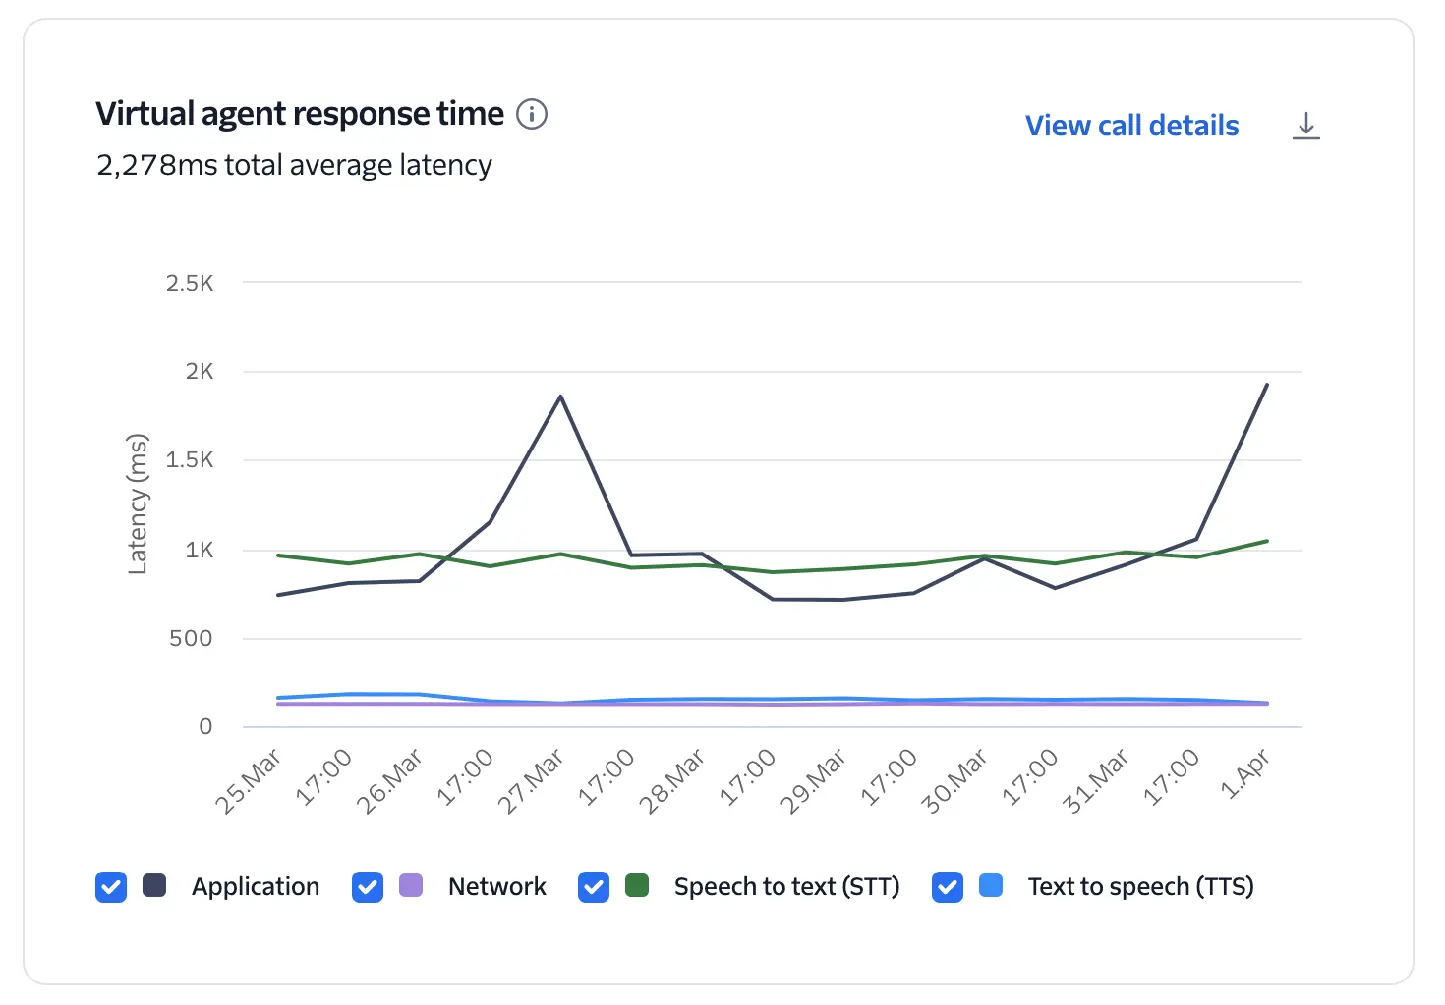
This chart breaks down the total average latency into its core components: Application, Network, Speech-to-text, and Text-to-speech.
Response time (or latency) is calculated for the following components:
- Network: The round-trip time (RTT) between Twilio and the developer's application via the WebSocket.
- Speech-to-text (STT): The time elapsed between the end of a customer's utterance and the point where a full transcription is generated and ready to be processed by your application.
- Application: Time between the last block of STT text sent to the application via the developer's WebSocket and the first token received back from the application.
- Text-to-speech (TTS): Time between receiving the text response from the application and when TTS audio starts. This measurement includes the round-trip time between Twilio and the TTS provider.
Scope of latency measurements
These metrics measure components from the perspective of Twilio's network. They do not include the last-mile latency between the end user and Twilio's media edge, which might include multiple carrier networks, cellular latency, or internet congestion. Last-mile latency depends on the type of call, quality of the connection, and geographic location of the end user.
Measuring speech-to-text latency
Speech-to-text (STT) latency measurement is calculated from transcription metadata provided by the STT vendor. Its accuracy varies by model and language. English is typically accurate within 100ms, while other languages can vary up to 250ms. The latency measurements described in the documentation are not guarantees of performance.
Natural human conversation typically has gaps of only a few hundred milliseconds; delays over one second feel slow, and over two seconds can break the flow of conversation.
- Target Latency: Aim for <1200ms on the upper bound to ensure turn-taking feels natural.
- Pinpointing Bottlenecks: Use the breakdown to see which component is the primary driver of delay and make adjustments.
- If application latency is high, utilize streaming instead of waiting for full transcriptions.
- Learn more about core latency in Voice AI agents.
Top 5 errors that occurred on calls handled by a virtual agent.
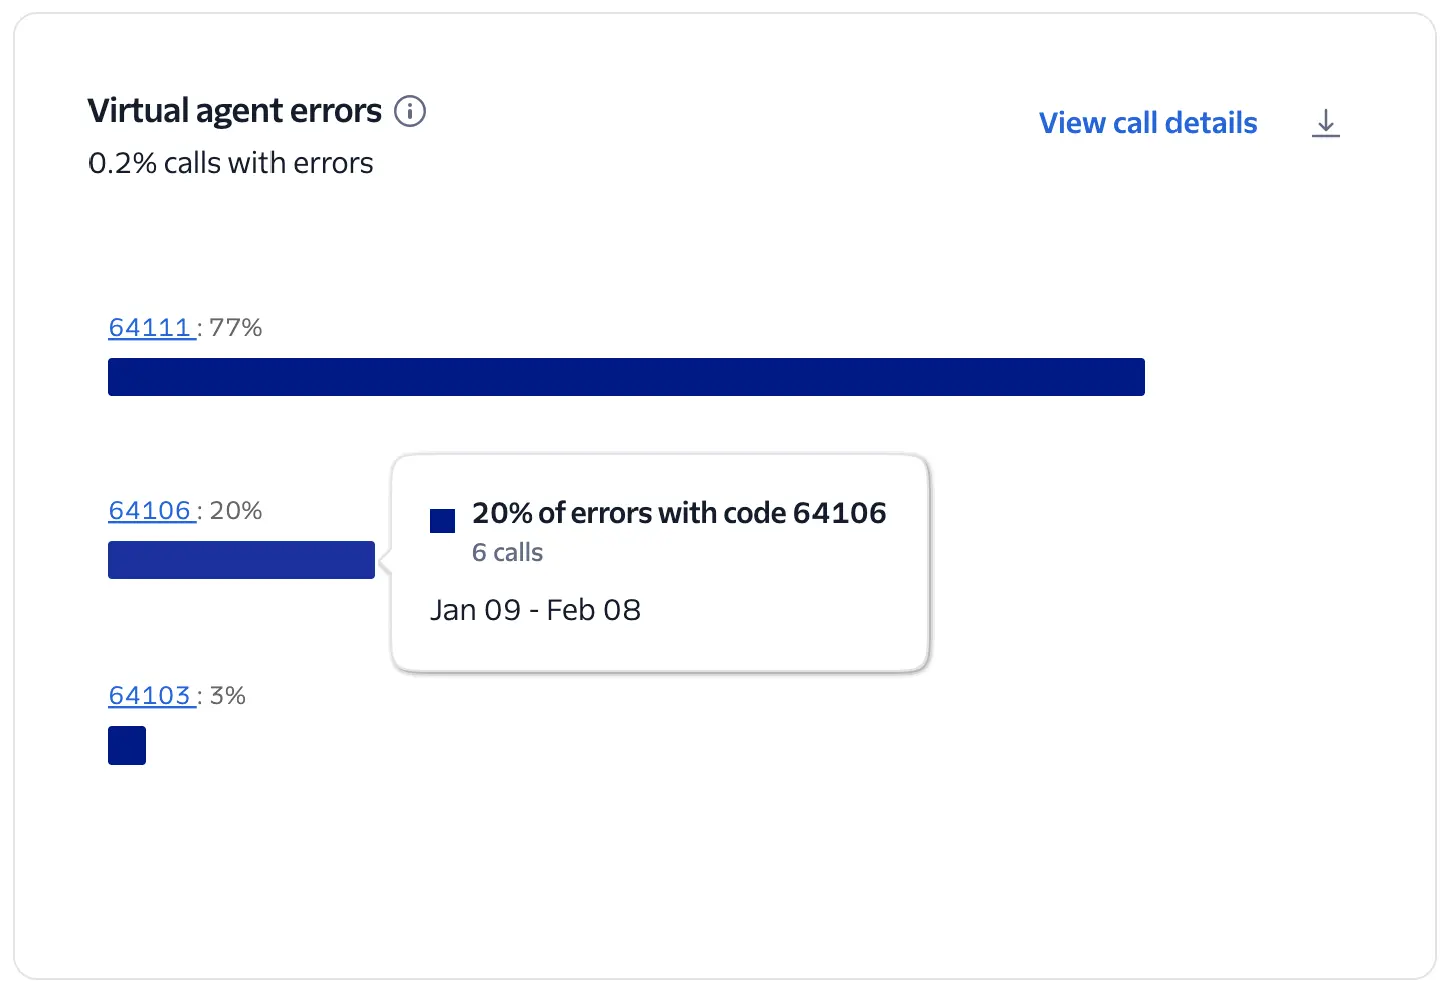
This chart visualizes the top 5 error codes encountered during Conversation Relay sessions across your account.
The system calculates the percentage of each error code among all Conversation Relay calls with errors, including the total count when you hover over the chart.
Review the errors reported on the chart and click the Error Code link to get details of the issue and suggestions for how to resolve.
Tracks when the virtual agent or customer talks over the other. High interruption rates can indicate poor turn-taking, overlapping speech, or impatience with delays.
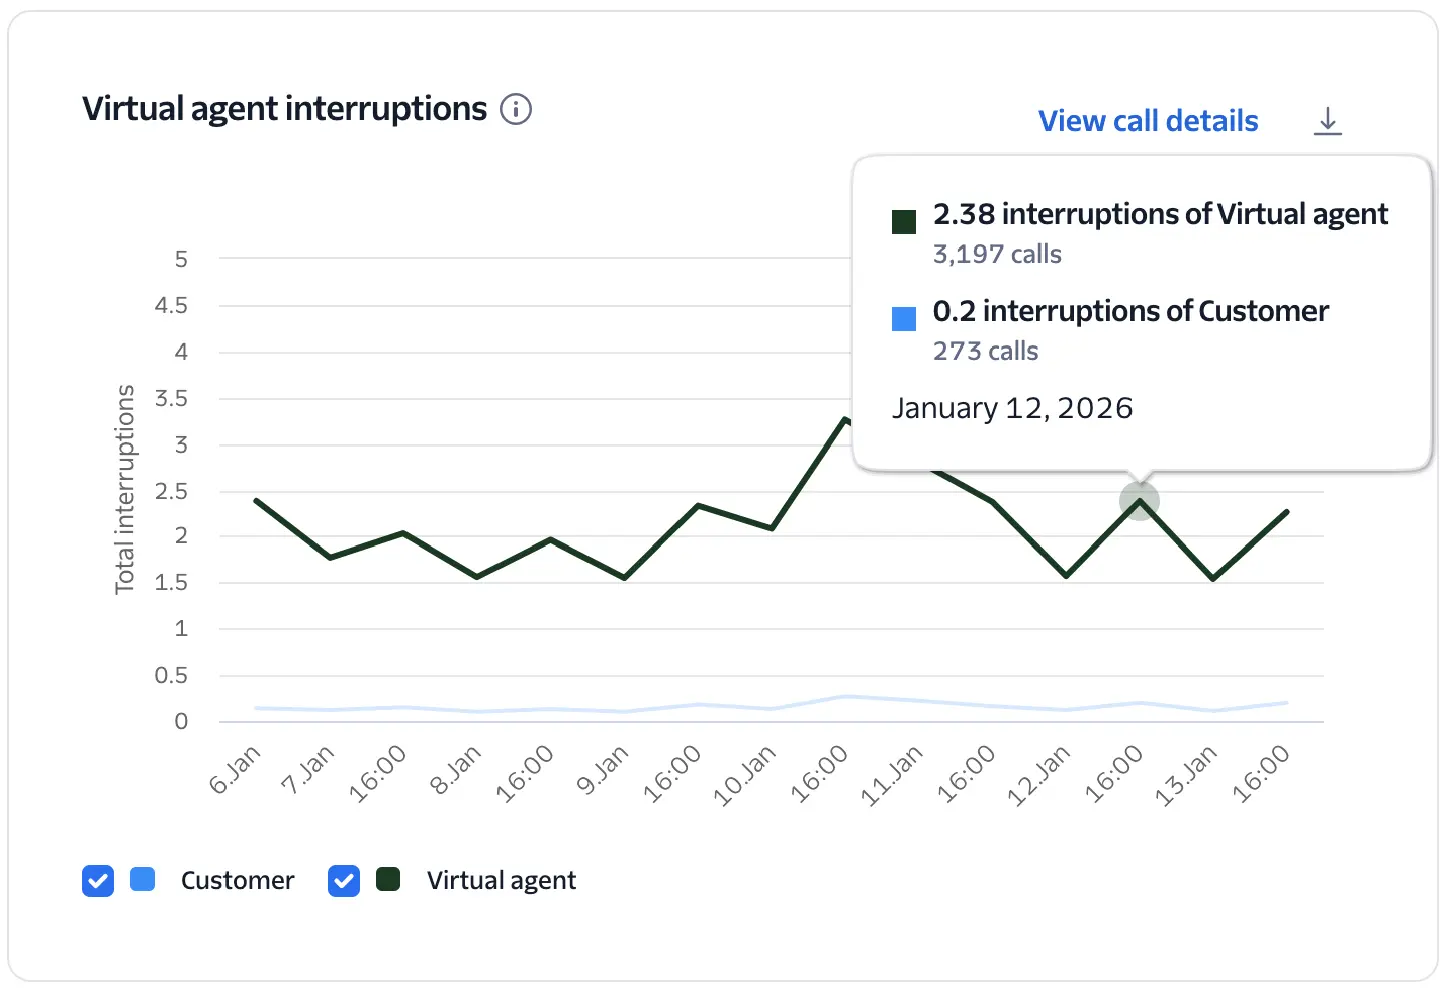
Tracks "turn-taking" health by measuring how often the customer talks over the agent and vice versa.
- Interruptions of virtual agent: Counts instances where the customer begins speaking before the virtual agent has finished speaking.
- Interruptions of customer: Counts instances where the virtual agent begins speaking before the customer has finished.
High interruption rates of the virtual agent may indicate high latency in the conversation or too much verbosity from the virtual agent. Interruptions of the customer may indicate the virtual agent incorrectly detected the end of the customer's response or an audio issue preventing the customer's speech from being captured correctly.
Shows instances where the call had silence from at least one side (customer, agent, or both). These might be caused by connection issues, system delays, or user confusion.
- Review calls with high interruption rates to determine if it is being caused by an audio issue, high latency, or unexpected user behaviors.
- Adjust the
interruptSensitivityparameter.
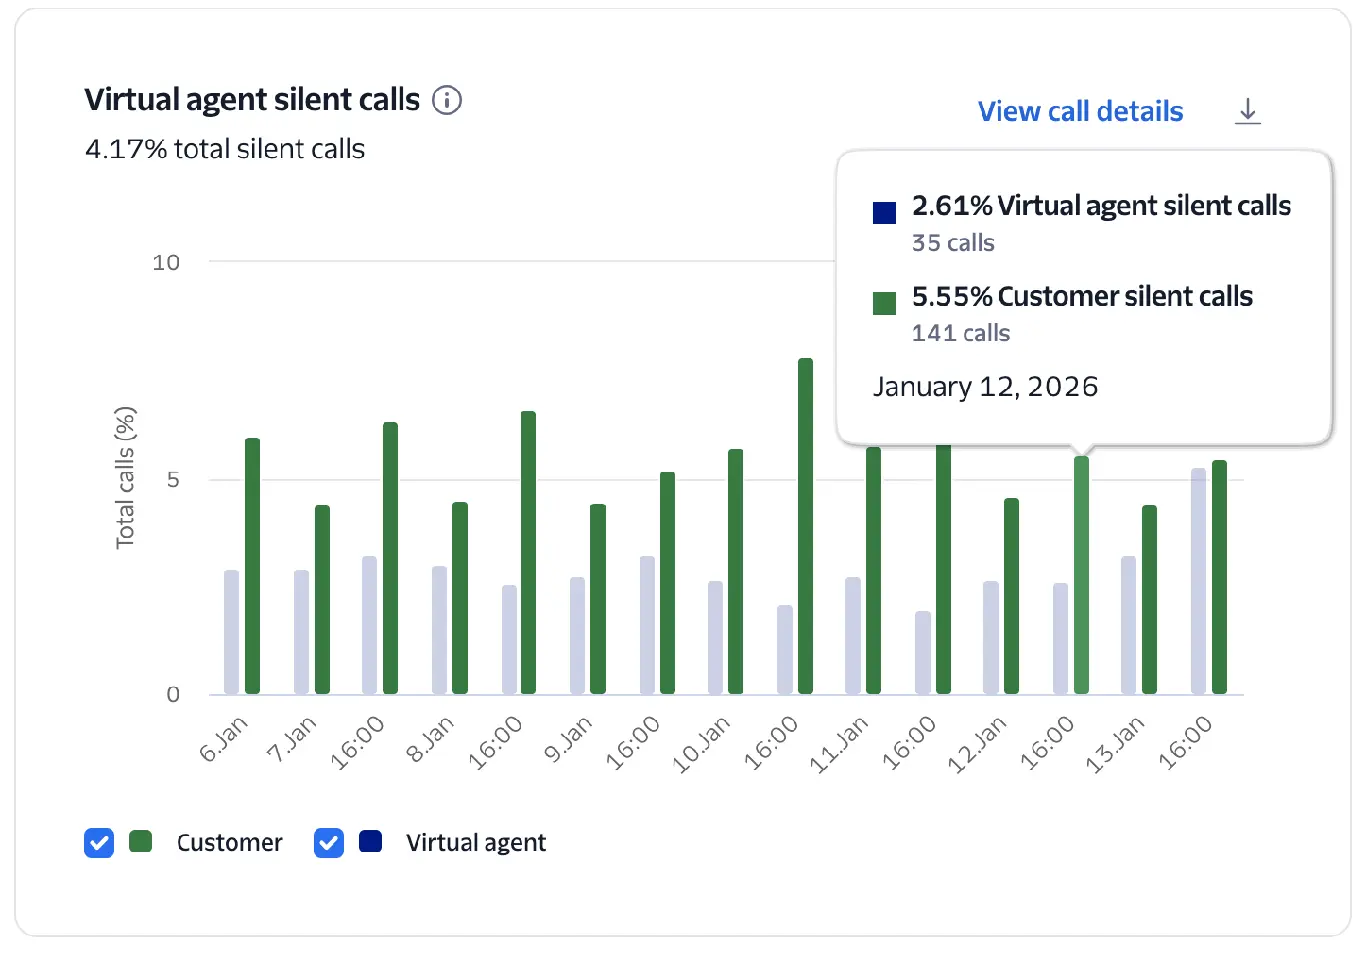
This chart tracks the percentage of calls that were completely silent from at least one side—the customer, the agent, or both. It helps identify instances where the audio path may be broken or the user is disengaged.
The chart measures the count and percentage of Conversation Relay calls that were completely silent from either the customer or the virtual agent's side.
High rates often correlate with connection issues, system delays, or customer confusion. Silent virtual agent calls suggest a failure to generate a response from the application.
- Correlate silent calls with Calls with Errors to see if a technical failure prevented the agent from speaking.
- Review the silent call events and recordings for clues about what might be happening.
Average rate at which the virtual agent processes and generates tokens during speech generation. A measure of language model throughput and efficiency.
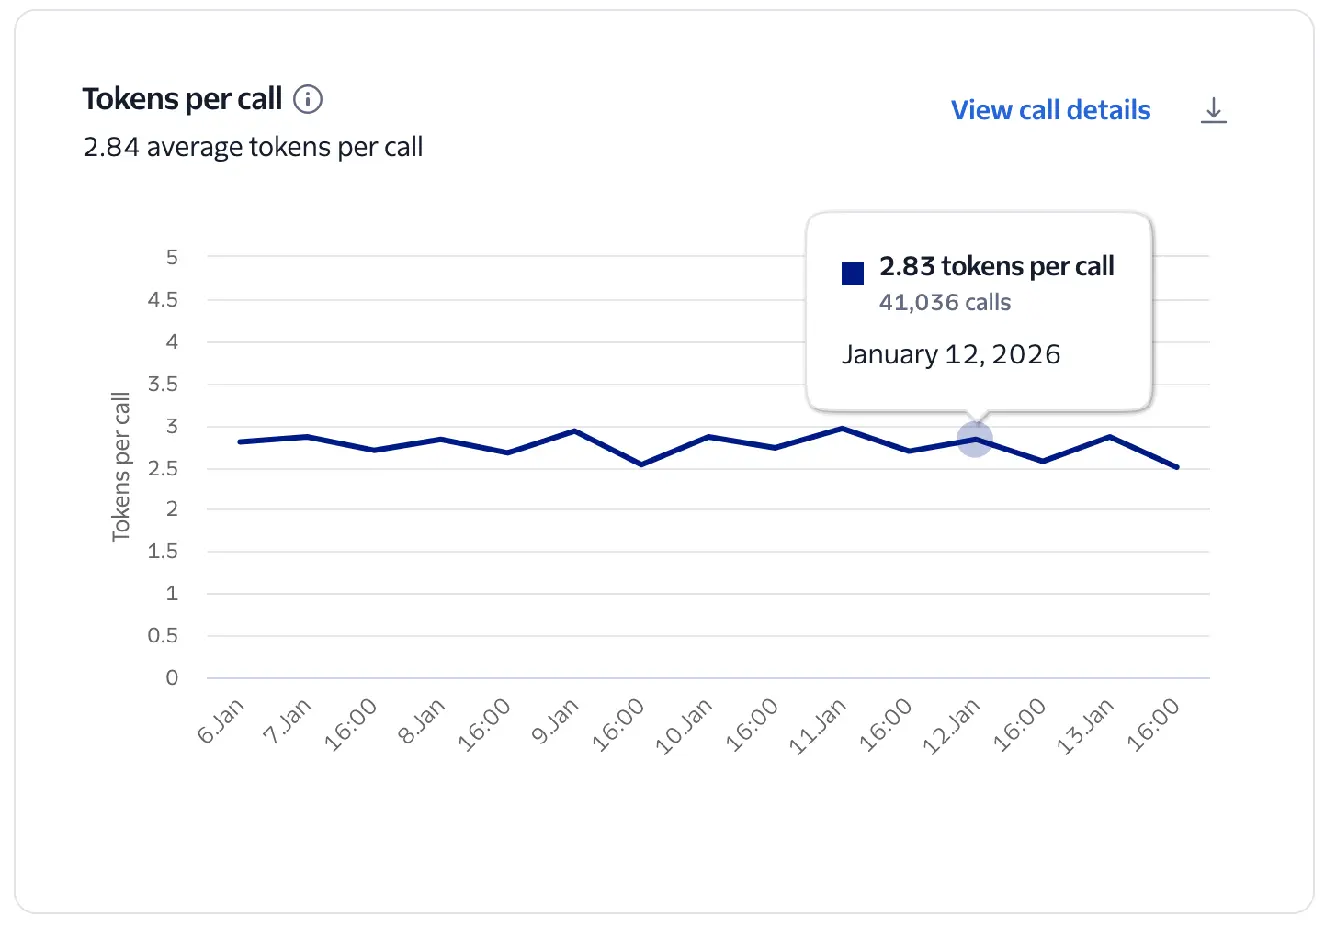
This chart measures the average rate at which your virtual agent generates tokens.
Calculated as the total number of tokens divided by the total number of Conversation Relay calls.
Tokens in this chart represent what Conversation Relay received from your WebSocket in the token attribute of your messages.
Tokens per call
If you are not using token streaming, a single token may contain an entire response, which results in a lower Tokens per call metric.
- Stream your tokens to Conversation Relay so that audio responses to your customers can begin sooner.
The average number of words spoken by the AI voice agent during a single call.
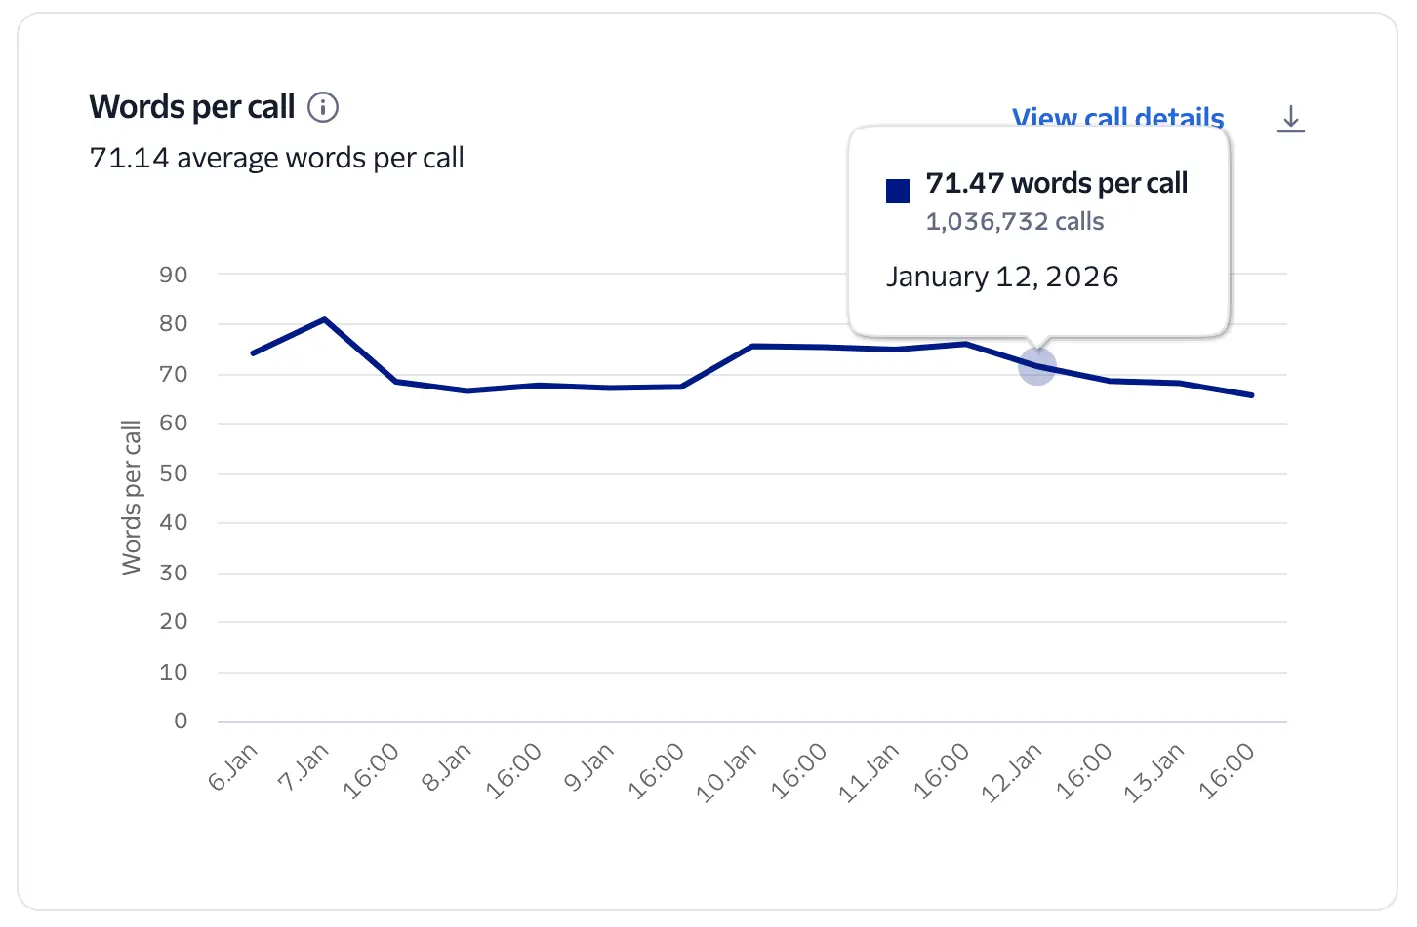
This metric tracks the average number of words spoken by the virtual agent during a call.
It's calculated as the total number of words over the total number of Conversation Relay calls during the selected time period.
This metric helps you measure the verbosity of your virtual agent.
- If Words per Call is high but Turns per Call is low, your agent may be speaking for too long without allowing customer input.
Number of conversational exchanges (customer + agent) per call. Indicates interaction pacing. Very low TPC may signal latency or unengaged users.
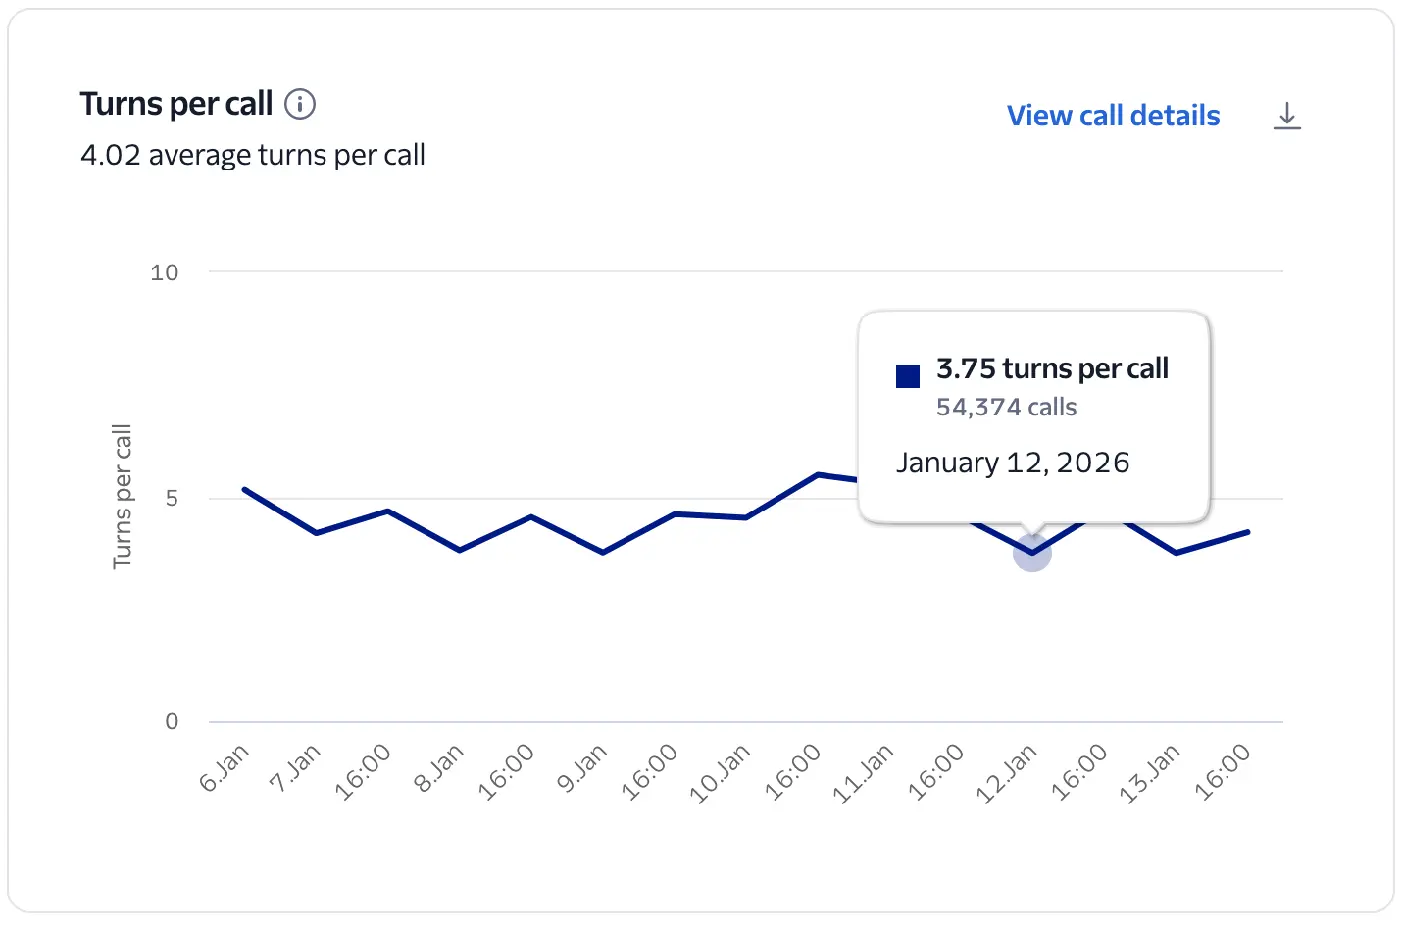
This chart visualizes the number of turns per Conversation Relay call during the given time frame. This is an indicator of interaction pacing and engagement.
It's calculated as the total number of turns over the total number of Conversation Relay calls during the selected time period. A turn is identified as the start of customer speech followed by the start of virtual agent speech.
A moderate number of turns suggests a deep, successful interaction, while very few turns may signal that users are unengaged or the agent is failing to prompt for further input. A high number of turns may indicate a complex issue or signal a frustrated customer who isn't getting help in a timely manner.
- Compare with latency and average call handling time. Long calls with high turns may signal the virtual agent is failing to reach a successful resolution.
Identifies the language used in speech-to-text (STT) input and text-to-speech (TTS) output. Inconsistent or incorrect detection may lead to miscommunication or mismatched responses.
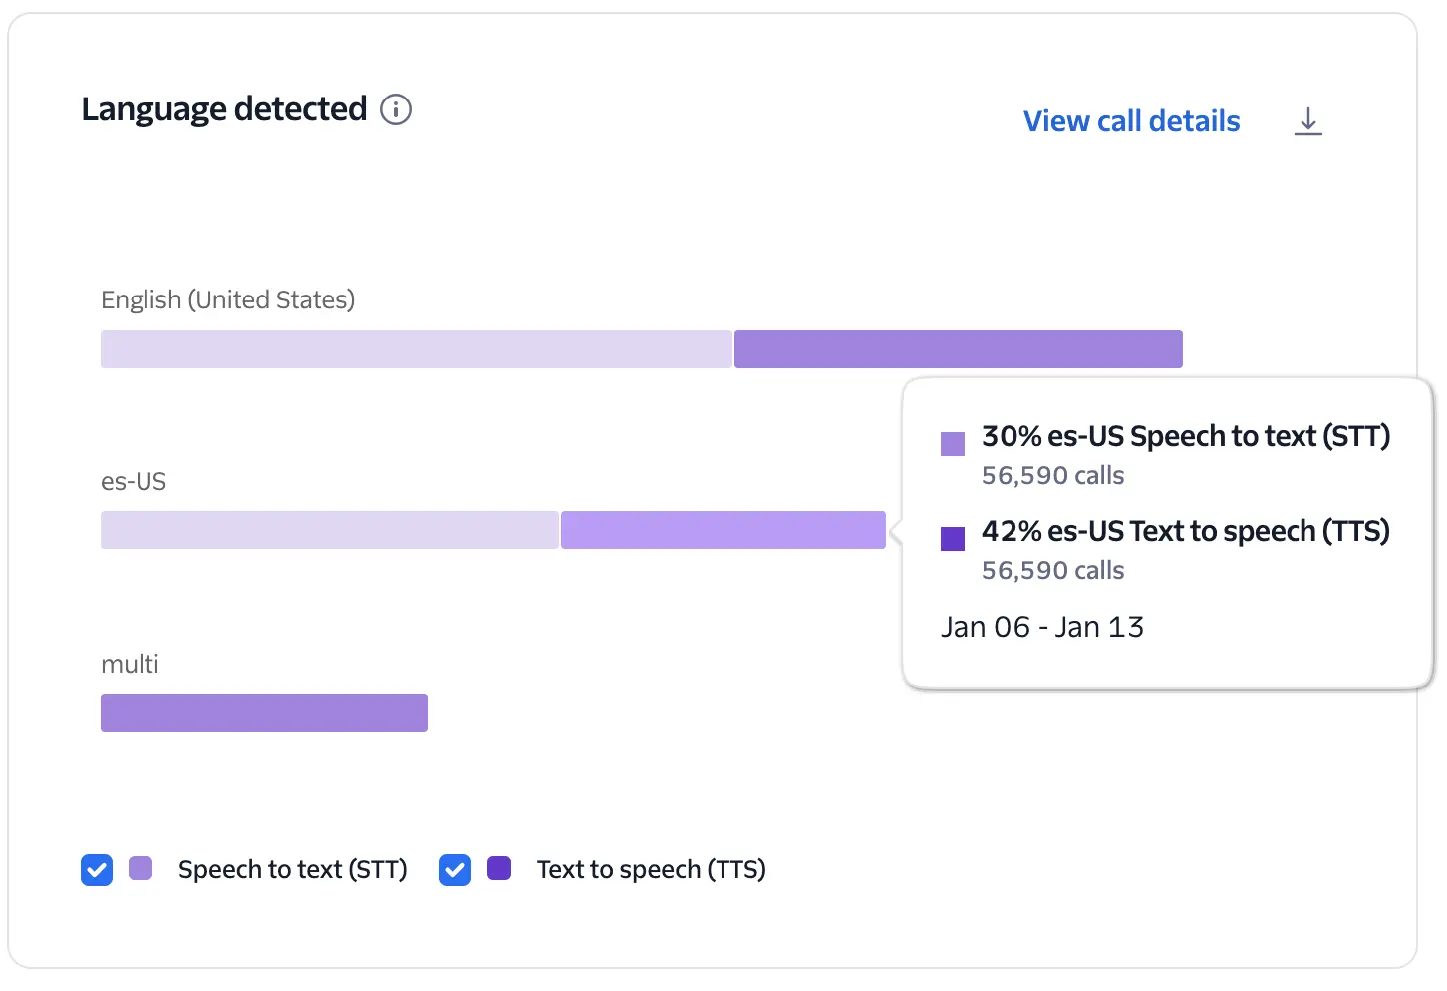
This chart visualizes the occurrences and percentages of actual detected languages during Conversation Relay calls for each TTS and STT provider. It helps identify the languages your customers are actually using compared to your configured settings.
The system identifies languages based on your TwiML configuration and usage:
- Specific configurations: If languages are explicitly configured (for example,
es-USoren-US), the chart will display those codes only if they were actually used during the call. - Multi-language configuration: If
multiis configured as the language, the chart will displaymultias the language code.
This chart shows the distribution of languages being used when interacting with your virtual agent, which can help you better understand your customers' language needs.
- Review these metrics to validate that your agent's language support aligns with your actual customer demographics.
- If you see languages in your configuration that never appear in the chart, you might be able to simplify your implementation to improve performance.