Dashboards
This section covers common requirements for real-time dashboards for a contact center.
There are two types of common reporting interfaces:
- Dashboards - primarily visual graphs - Described in this document
- Historical reports - primarily text based tables - Described here
Twilio has a set of partners who can provide out of the box dashboards end reports, or you can build these yourself using the data and tools Twilio makes available.
For each recommended graph or table, this document lists how you would derive this from the TaskRouter event stream, OR how you would get it from the TaskRouter statistics APIs. You would typically use one mechanism or the other, dependent on what technology you are using for building this.
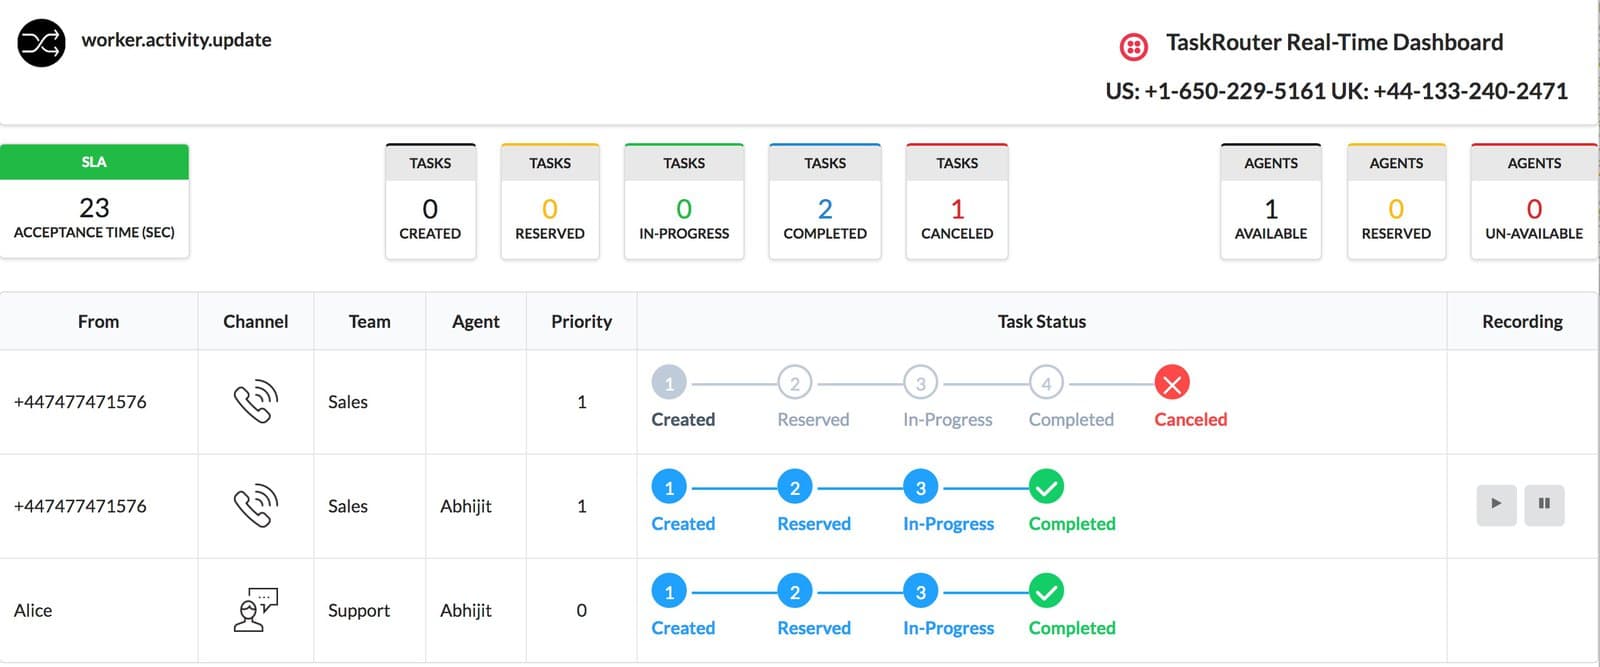
Dashboards are typically used by a supervisor 'on the floor' of the contact center. Because these are used for active management, they really need to include the real-time value of each statistic, as well as the historical graph.
A contact center dashboard would typically cover the following high level areas:
- Summary
- Queues
- Agents
All the graphs should be able to be toggled between different time ranges. Ideally that should include down to the specific hour.
Additional things to consider when building this:
- It is useful if the report auto-refreshes at a sensible cadence if left open.
- For certain values it is useful for them to be truly real-time. We recommend using Twilio Sync for this function - using the event stream data from TaskRouter to populate a Sync map with the values needed. Note: in the future this will be an integrated feature of TaskRouter.
- It is useful if the screen can be set to a mode with a display suitable for acting as a 'wallboard' display (e.g. remove as much chrome/config as possible and just show graphs, or even just the real-time numbers blown up big)
- It is useful to be able to configure a specific SLA for each graph, and use that to display whether the graph breaches over the SLA, and also color code the real-time figures if breaching the SLA
We would recommend that you use Twilio Sync to power your realtime dashboards, and populate the data in the Sync maps based on updates from the TaskRouter event stream
- TaskRouter generates the event and calls the Event Callback URL associated with the workspace
- This invokes the server side python app to consume the event and call the additional Twilio TaskRouter Statistics APIs to get aggregated statistics
- Next, the Sync documents are updated with changes using the Sync REST APIs
- The frontend web app subscribes to the same Sync documents for changes vis the Sync JS SDK
- When changes are detected by the frontend, the UI is updated
You can find a full working code example of this here: https://github.com/ameerbadri/twilio-taskrouter-realtime-dashboard
The following table lists graphs which are often displayed on a summary dashboard.
| Graph | Purpose | How to get from TaskRouter Event Stream | How to get from TaskRouter stats API |
|---|---|---|---|
| Average waiting time for tasks by date | To see the overall trend in waiting time | Derive from average TaskAge parameter from (reservation.accepted OR task.canceled) event | AvgTaskAcceptanceTime on the Workspace cumulative statistics |
| Average waiting time for tasks by queue | To see which queues have longest waiting time (in order to consider assigning more agents) | Derive from average TaskAge parameter from (reservation.accepted OR task.canceled) event filtered by TaskQueueName | AvgTaskAcceptanceTime on the TaskQueu cumulative statistics |
| Average waiting time for tasks by day of week | To see which days are busiest (for agent planning purposes) | Derive from average TaskAge parameter from (reservation.accepted OR task.canceled) event | AvgTaskAcceptanceTime on the Workspace cumulative statistics with individual queries for each day |
| Average waiting time for tasks by hour | To see which hours are busiest (for planning breaks) | Derive from average TaskAge parameter from (reservation.accepted OR task.canceled) event where timestamp on that event is within given bucket | AvgTaskAcceptanceTime on the Workspace cumulative statistics with individual queries for each hour of each day |
| Number of tasks queued (by hour) | Derive from task.created event | TasksEnteredn the Workspace cumulative statistics with individual queries for each hour of each day | |
| Number of tasks queued (by day of week) | Derive from task.created event where timestamp is time created | TasksEnteredn the Workspace cumulative statistics with individual queries for each day of week | |
| Number of agents logged in (by time) | Derive from worker.activity.update and filter by WorkerActivityName is Idle | It's possible to create custom Activity States. Where this is true, you must use the REST API to fetch activity states and which ones map to available. | |
| Number of agents logged in (by day of week) | Derive from worker.activity.update and filter by WorkerActivityName is Idle | ||
| Number of agents logged in (by hour) | Derive from worker.activity.update and filter by WorkerActivityName is Idle | ||
| Number of agents logged in (by Queue) | Not possible | ||
| Total Number of tasks waiting / In progress / abandoned | Waiting tasks is tasks received a task.created event with no subsequent reservation.accepted for same task SID Abandoned tasks is number of task.canceled events Tasks in progress is number of reservation.accepted events with no subsequent task.completed for the same task SID |
It should be possible to view a larger number of stats broken down per queue. Selecting one queue at a time is OK. Being able to select multiple queues and have stats aggregated is beneficial.
There should be a graph for each of the following statistics:
| Graph | Purpose | How to get from TaskRouter Event Stream | How to get from TaskRouter stats API |
|---|---|---|---|
| Waiting time (duration) | Derive from (reservation.accepted OR task.canceled) events with average of TaskAge for all tasks for given TaskQueueName | ||
| Customers waiting (tasks) | Count of taskqueue.entered events and subtract taskqueue.moved, and reservation.accepted events for the same taskSid. | ||
| Logged in workers (agents) | Not possible | ||
| Tasks Received | Count of taskqueue.entered events and subtract taskqueue.moved for the same taskSid. | ||
| Tasks Handled | Count of reservation.accepted events for the given TaskQueueName | ||
| Tasks Abandoned | Count of task.canceled events for the given TaskQueueName | ||
| Average abandon time | Average of TaskAge for task.canceled events for the given TaskQueueName | ||
| Average call duration | Average of TaskAge for task.completed events for the given TaskQueueName | ||
| Agent states | Aggregated view of WorkerActivityName from the most recent worker.activity.update events for each unique WorkerSid |
Some graphs currently cannot be extracted from TaskRouter data and need data to be stored yourself in a different database. These will be addressed in the TaskRouter roadmap:
- Disposition Codes (calls)
- Wrap-up Time (duration)
- Calls answered (calls/hr)
- Calls timed out (calls/hr)
- Time in queued calls (%)
- Time in internal calls (%)
- Time in external calls (%)
- Time in outgoing calls (%)
- Time otherwise unavailable (%)
- Time logged in (%)
- Wrap-up Time*
- Agent States
Some graphs currently cannot be extracted from TaskRouter data and need data to be stored yourself in a different database. These will be addressed in the TaskRouter roadmap:
- Disposition Codes (calls/hr)*