Voice Insights Frequently Asked Questions
Learn how Twilio Voice Insights analyzes call quality and performance metrics for voice calls and conferences. This tool provides both high-level cumulative statistics and granular per-interval data to help you diagnose audio issues like jitter and packet loss.
You can use this guide to send voice notifications, automate self-service tasks, build inbound and outbound contact centers, deploy AI agents, run a sales dialer, track calls, establish PSTN connectivity, and create AI/ML transcription.
See Related reference documentation to learn more about the API calls and resources used in this guide.
The Voice Insights Dashboard and Call Summary pages in Console are included with every voice minute as a feature of the Twilio platform. These pages represent what we commonly refer to as Voice Insights; in the absence of greater detail assume these are what is being talked about when we talk about Voice Insights.
Voice Insights Advanced Features is a per-minute paid feature enabled on an individual account basis which exposes additional capabilities, including:
- Logging of call events and metrics
- Metrics tab in Console which displays the captured metrics and events
- Programmatic availability of events, metrics, and summary records via API and Event Streams
It depends. There are two primary use cases where Voice Insights Advanced Features is required: one is the capture of per-interval metrics and events; two is programmatic access via API or Event Streams.
Twilio does not write per-interval metrics or events to disk unless Voice Insights Advanced Features is enabled on the account; we analyze the stream of metrics and events in-flight, calculate the cumulative metrics for the call, and store those cumulative stats in the Call Summary. If cumulative statistics for calls is not sufficient for your purposes and you need to know not just that a potential issue was detected, but also when it was detected, on which stream, how the performance changed, and for how long, enabling Voice Insights Advanced Features will result in Twilio writing those details to disk and making them available to you via Console and API.
If you need access to any of the Voice Insights resources via API or Event Streams, then Voice Insights Advanced Features must be enabled. Some customers consume Voice Insights data and build sophisticated monitoring and alerting applications, some use Call Summary data to decorate their own internal call records, and some customers write everything to a data lake "just in case" they need it beyond 30 days. If you want to consume Voice Insights Call Summary, Events, Metrics, or Conference Insights Conference Summary and Participant Summary endpoints, you will need to have Voice Insights Advanced Features enabled on the account. Attempts to request resources for accounts which did not have Voice Insights Advanced Features enabled when the call was created will result in an HTTP 401 Unauthorized response.
Sensors in the Twilio Voice SDKs and on Twilio media gateways gather call metrics and events and send them to the Voice Insights platform for analysis and aggregation.
Insights is available for all calls made using Twilio Voice SDKs for JavaScript (v1.3+), mobile SDKs for Android and iOS (v3.0+), using the Programmable Voice APIs, or calls placed using Elastic SIP Trunking.
Metrics and events are provided as-is for calls placed using unsupported Voice SDK for JavaScript 1.2 and mobile SDKs for Android and iOS 2.0. With this in mind you may see unexpected or impossible values for certain metrics.
In the world of Voice-over-IP network metrics and audio quality are essentially synonymous, and our analysis of hundreds of billions of calls over more than ten years supports the theory that network transport issues are the number one contributor to reports of audio quality degradation for VoIP calls.
In the old school world of plain-old-telephone-services the only transport metric that mattered was physical continuity of copper wires buried underground, but in a VoIP telecom deployment when people talk about "choppiness" on a call what they are actually talking about is packet loss. When they talk about "noise" or "robotic speech" they are almost certainly talking about jitter. Many reports of "one-way audio" and "dropped calls" are really high post-dial delay.
We monitor and report on these metrics because without visibility into the underlying behavior of the network infrastructure it is not possible to detect, diagnose, or resolve the causes of quality issues.
In-stream audio issues like echo, or noise that is not related to jitter or packet loss, can't be detected by Voice Insights today but may be captured in any recordings of the calls made using Twilio. In our experience, most echo is due to a call participant having their speaker volume or microphone gain set high enough that the output of the speaker is picked up by the microphone and pumped back into the media stream.
Twilio's media gateways can detect missing RTP streams or streams which contain only silence. We will mark those calls has having contained silence in the Call Summary API response and in the Call Summary properties in Console. Note that silence detection is not the same thing as human speech detection, so a call could conceivably contain no one speaking but display enough background noise to result in Twilio failing to mark the call as having been silent.
We look at our external signaling edge and the direction of which party sent the SIP BYE.
We use the source of the SIP BYE at our signaling edge to determine who hung up. From a SIP perspective a call needs to have been answered before it can be ended via a SIP BYE, so calls that are no-answer, failed, or canceled we will not provide who hung up; however you can infer that any unanswered call was ended by the calling party.
For Voice SDK calls, who hung up might be missing due to multiple reasons: computer crashes, network issues, the browser being closed or crashing while the call was in progress, the client object being destroyed before the event could be sent to Twilio Insights, or any other behavior that results in Twilio not receiving the final events from the SDK unexpectedly. These will appear as "disconnected by: unknown" when viewing Insights data in Console and aggregate reports.
Dropped calls are challenging to detect programmatically because the overwhelming majority of calls that are reported as "dropped calls" look normal from an application and signaling perspective. The best way to know if a call was a dropped call is to ask your user. The Voice SDKs come with a feedback API that can be integrated directly into your application to capture the subjective user feedback. The feedback values submitted with this method are made available by the Voice Insights Call Events API. For non-SDK calls, Twilio provides a separate Feedback API and additionally makes the feedback available via call logs in the console.
In the absence of direct input from your users, the Voice Insights Call Summary includes the final SIP response which allows you to locate calls that did not end normally; any calls that do not end with a SIP 200 OK are considered abnormal sessions.
For Voice SDK calls you can look at the disconnected by reason; if you see unknown that means that a computer crash, browser crash, network loss, or application error prevented the final event reporting to Twilio, and whatever condition caused this almost assuredly resulted in the call being dropped as well.
For Voice SDK calls we sample each second; for Carrier and SIP calls we sample the cumulative stats for the previous 10 seconds every 10 seconds.
Our quality thresholds are based of ITU-T standards for VoIP quality, and do indeed lean toward sensitivity. The goal behind highlighting issues at-or-below the edges of perceptibility is to allow detection and mitigation to occur before users notice; however, we also provide cumulative metrics in the call Summary, which allow you to craft your own internal threshold for performance.
Almost all quality issues for Voice SDK calls are due to local network conditions, which are typically caused by things like misapplied or absent quality of service (QoS), asymmetric bandwidth allocations, or bandwidth limitations. We expose a more sensitive threshold of data for Voice SDK calls to allow developers to identify and respond to changing quality conditions before their users notice by surfacing warnings in their applications and giving prescriptive instructions; e.g. "quality issues detected, try moving to a different location".
Different destinations have different expectations for post-dial delay, and accordingly varying thresholds for acceptable PDD. In the US, for example, PDD higher than 6 seconds is typically something that could be escalated to the carrier; however, in South Africa PDD of 10 seconds is common and considered acceptable, so tagging calls to South Africa with PDD > 6 seconds would result in us tagging basically all the calls in South Africa, reducing the utility of the data to uncover outliers in performance.
Due to GDPR Voice Insights data is only stored for 30 days, so the Dashboard is limited to 30 days worth of data. Since only 30 days worth of data is available, we can only show comparisons for up to 15 days. CSV export is limited to 2000 rows.
For SIP Interface and Elastic SIP trunking calls you can view your local SIP infrastructure logs and pcaps, and compare with the Twilio public pcap available in the call resource page in Console.
Voice SDK SIP errors are often due to unexpected application behavior. We recommend enabling debug logging in your apps and reproducing the issue to understand the cause.
SIP errors that originate from the carriers are currently not actionable by you directly. In case there are issues with a specific carrier are impacting your users, you can reach out to Twilio Support with the data to get more help.
An API is available as part of Voice Insights Advanced Features that provides access to call events, metrics, and summaries.
Voice Insights data is retained for 30 days after the call is made.
In order to provide the dynamic filtering and search functionality in the Voice Insights Dashboard the top-level aggregations don't operate on values directly but on their hashes, and thus they return approximate results. The call logs use linear counting which has excellent precision on low-cardinality sets but does not provide multi-dimensional searches and top-level filtering like the Voice Insights Dashboard does. In practice, we typically see differences of less than five on sets of calls with ~100K results.
Enable Voice Insights Advanced Features to see call events and metrics. In Twilio Console, go to Monitor > Insights > Voice > Settings. In the legacy Console, go to the Voice Insights Settings page.
Missing metrics/events/summaries can be caused by:
- local network configuration blocking publishing to the Insights events gateway
- expired tokens
- publishing delays on the Voice Insights backend
Advanced features data is available only while the feature is active on the account, any calls placed before the feature is enabled will not be flagged by the Voice Insights infrastructure, and the per-interval metrics and event stream will not be stored.
Twilio will tag a call with high latency if the Twilio-internal RTP time for outbound packets received at the media edge for a call SID is greater than 150ms. The Call Summary will show the received latency for the provided call SID; i.e. how long it took packets from the media edge for the other side of the call to traverse Twilio's network on the way to the media edge for this call SID. We are tagging the received call and not the sending call because it is the received call that most commonly experiences the effects of the latency; e.g. there are long gaps between their speech and responses, they are being talked over, etc.
Twilio RTP latency shows the average and max Twilio-internal media stream traversal time in milliseconds. The Voice Insights platform analyzes the timestamps of when RTP packets are received at the ingress of Twilio's media gateway and compares that timestamp against the timestamp of the same packets at the egress on the other media edge.
The overwhelming number of calls marked as having high latency are calls with participants in distant geographic locations; e.g. a Voice SDK user in the Philippines dialing into a conference being mixed in Ireland. Calls placed using a conference call flow will have a small jitter buffer that can result in conference calls being more prone to be marked as having high latency; high jitter from Voice SDK participants can cause the jitter buffer to swell and delay playout of their media to the other participants in the conference. . Optimizing the region selections for Voice SDK instances and conferences is the best way to mitigate the impact of internal RTP traversal time. Ultimately if you have users separated by large distances, some degree of Twilio-internal latency can't be avoided.
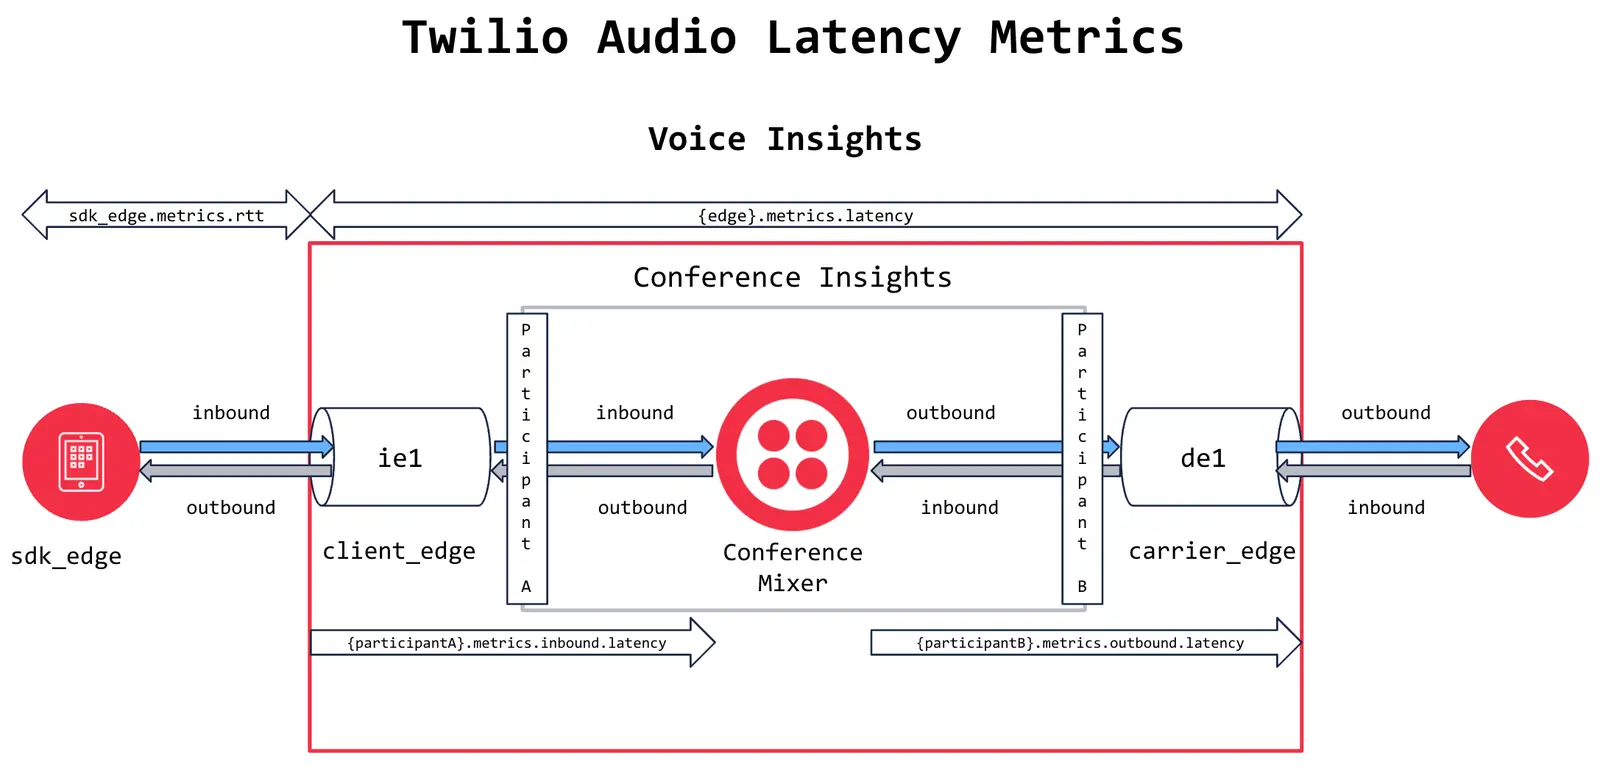
High round trip time (RTT) indicates the measurement of how long it took packets to arrive at the Voice SDK application sensors from Twilio's media gateway has breached 400 ms in 3 out of the last 5 samples. This measurement captures latency outside of Twilio's infrastructure.
High latency indicates that the average of the Twilio internal RTP traversal time was greater than 150 ms. This measurement capturers latency inside of Twilio's infrastructure, from when a packet arrived at Twilio's media edge, to when it exited Twilio's media edge on the other side of the call.
Participant latency indicates how long it took packets from a given participant to arrive at the conference mixer, and how long it took packets from other participants in the conference to arrive at the participant.
No. The SDK-level events like constant audio warnings and low MOS warnings can be instrumented without needing to pay for advanced features. Availability of the events via Console is an advanced feature.
Implement handlers for network-quality-warning-raised group to warn users that their local network conditions might be impacting call quality—use the SDK to display warnings and prescriptive actions to users in the application; e.g. "check headset connection" or "move to an area with better WiFi".
Implement handlers for audio-level-warning-raised events to show visual indication to users that their audio is not being detected by the application.
Create post-call surveys using feedback events asking users to rate the subjective quality of experience and correlate responses with other metrics and properties to identify commonalities in call behavior changes.
The "To" for a Voice SDK call is the Twilio application SID; the TwiML returned from the webhook configured in the application SID will create a child call, and that child call will contain the expected "To" details.
Twilio's conference mixers have a small jitter buffer that can reduce or eliminate jitter received on one call before passing it along to the other calls. The tradeoff for this is a proportional increase in latency.
It's possible. RTP media streams are sent via User Datagram Protocol (UDP) which is a fire-and-forget protocol with no error correction. Jitter and packet loss for UDP transport is a fact of life in any network, and calls whose media streams traverse large distances (e.g. a Voice SDK call in Singapore terminating in a conference mixed in Brazil) are more likely to be impacted by inevitable-but-rare backbone-level jitter and packet loss.
WebRTC uses RTCP to indicate the number of packets sent from the gateway to the Voice SDK application. Based on the RTCP sender reports if the sensors in the SDK are expecting packets, but packets don't arrive, those expected-but-missing packets will be calculated as packet loss. If the RTCP sender report indicates that no packets are expected, the absence of packets will not be calculated as packet loss, but will be reported as low bytes sent/received.
It's challenging to infer the subjective user experience from transport-level metrics alone. In general, it's safe to say packet loss >5% is going to result in noticeably choppy audio; average jitter >5 is going to result in robotic audio, and RTT > 1000 ms is going to result in people either talking over each other or long periods of silence between speech.
Transport-level metrics like jitter and packet loss are attempts at monitoring indicators that can contribute to call quality degradation; however, browsers like Chrome have dynamic adaptive jitter buffers that can mask the impact of jitter by introducing latency. Codecs like Opus have packet loss concealment algorithms that can smooth out the impact of missing packets. At the SDK level we don't have a good sense for the jitter buffer or packet loss concealment activities at any given time, so we report on the underlying transport metrics in the absence of subjective feedback. SIP and PSTN carrier infrastructure may also be implementing jitter buffers or transcoding to reduce quality issues.
The short answer is, we can't. We can infer the subjective experience from objective metrics, but we don't have end-to-end visibility of the performance characteristics of local hardware, local networks, intermediate carriers, etc. Voice Insights call tagging is based off the International Telecommunications Union ITU-T standards for VoIP quality, and we have tuned the performance based on years of feedback from customers to expose potential issues at the detectable-but-tolerating level. The idea behind this is that if we were to wait for the detectable-and-frustrated or frustrated-and-abandoning thresholds to be breached it would be too late to do anything about it. Erring on the side of alerting early allows developers to detect emerging issues before they become problems, and to provide guidance to users on behaviors that could be influencing the call in real time; e.g. "Poor network connection detected, try moving to a different location".
Another variable is variance in tolerance between individuals, and sometimes whole regions. You may have some users who are highly sensitive to latency and find it unacceptable, while others are more than willing to adjust their speech patterns to get in sync with a transcontinental conference call, just like some users balk at the first crackle of jitter and some are fine with piecing together choppy speech.
Ultimately your use case and your users' preferences will dictate whether or not something was a real problem, regardless of what the metrics say, and the best way to know is to ask them. Consider creating post-call surveys asking users to rate the subjective quality of experience and correlate responses with other metrics and properties to identify commonalities.
Not directly; the IP address reported to Insights would be that of the VPN IP, not the local device location. You can sometimes infer this from conversations with users; e.g. a user who is physically located in Germany but whose IP is showing up as being in Spain.
Not at this time. We are working on including signal strength and battery metrics in future versions of Insights for the mobile SDK, but the PLMN conditions are not available today.
The metrics reported at the carrier gateway represent what Twilio received from the PSTN. Twilio's Super Network is monitoring these connections in real-time and will raise quality degradations to carriers and file incidents as appropriate. Destination carriers often have status pages that can be checked for their local conditions as well, but they tend to be very conservative and slow to update.
Voice Insights is limited to inferring quality issues from proxy metrics like jitter and packet loss or silence detection. Voice Insights has visibility into what we sent from, and was received by, our media edges; degradation introduced on the way to the destination due to poor signal strength or a carrier issue would be transparent to Voice Insights today.
Twilio has created a free self-paced online course for Voice Insights on our Twilio Training platform. If you're looking for something a little higher level, check out our SIGNAL conference talks from 2021, 2020, 2019, or 2018.
This guide covers a feature that can support the following use cases:
You can use the feature in this guide to get insights whenever you send voice notifications using your app. For example, you can programmatically call customers to notify them of important updates, such as emergency weather closings, and learn how many calls connect successfully.
To learn more advanced features that you can use with voice notifications, see Voice notifications.
You can use the feature in this guide to get insights whenever you automate outbound calls that gather user input using the keypad. For example, you can create appointment reminders that allow customers to confirm, cancel, or reschedule their appointment by pressing a number on their keypad, and track how many customers respond.
To learn more advanced features that you can use with self-service automation, see Voice self-service automation.
You can use the feature in this guide to monitor the quality of incoming calls to your contact center and troubleshoot agent or connectivity issues.
To learn more advanced features that you can use with inbound contact centers, see Voice inbound contact center.
You can use the feature in this guide to get insights for your programmatic outbound call center that dials customers for telemarketing.
To learn more advanced features that you can use with outbound call centers, see Voice outbound contact center.
You can use the feature in this guide to monitor the network performance and latency of calls handled by AI-driven agents.
To learn more advanced features that you can use with AI agents, see AI agents.
You can use the feature in this guide to track call connection rates and audio quality for your sales team's outbound dialing activities.
To learn more advanced features that you can use with sales dialers, see Voice sales dialer.
You can use the feature in this guide to analyze the performance and metadata of calls routed for marketing attribution.
To learn more advanced features that you can use with call tracking, see Voice call tracking.
You can use the feature in this guide to diagnose signaling and media issues when connecting your infrastructure to the public switched telephone network.
To learn more advanced features that you can use with PSTN connectivity, see Voice PSTN connectivity.
You can use the feature in this guide to get insights whenever you capture the audio of your outbound calls for AI-driven analysis. By recording the call, you can send raw audio to machine learning models for real-time transcription, sentiment analysis, or automated post-call summarization.
To learn more advanced features that you can use with AI or ML transcription, see Voice AI/ML transcription.
Explore the following guides to build on what you've learned in this guide:
- Make outbound phone calls with Twilio Programmable Voice: Start placing calls programmatically using the REST API.
- Record phone calls: Capture call audio for storage or transcription.
- Respond to incoming phone calls: Learn how to handle inbound calls using TwiML.