Insights, Troubleshooting, and Diagnostics
Twilio has tools for understanding, troubleshooting, and enhancing your Twilio Video applications throughout the development lifecycle. You can use these tools to perform pre-call quality checks, as well as to gain insight into your application's performance and participants' experiences during or after a video call.
Video Insights brings self-service tooling to the Twilio Console to provide analytics and aggregations for observing your application, discovering trends, and troubleshooting rooms and participants.
The Video Log Analyzer REST API provides programmatic access to data generated by Programmable Video Rooms and Participants.
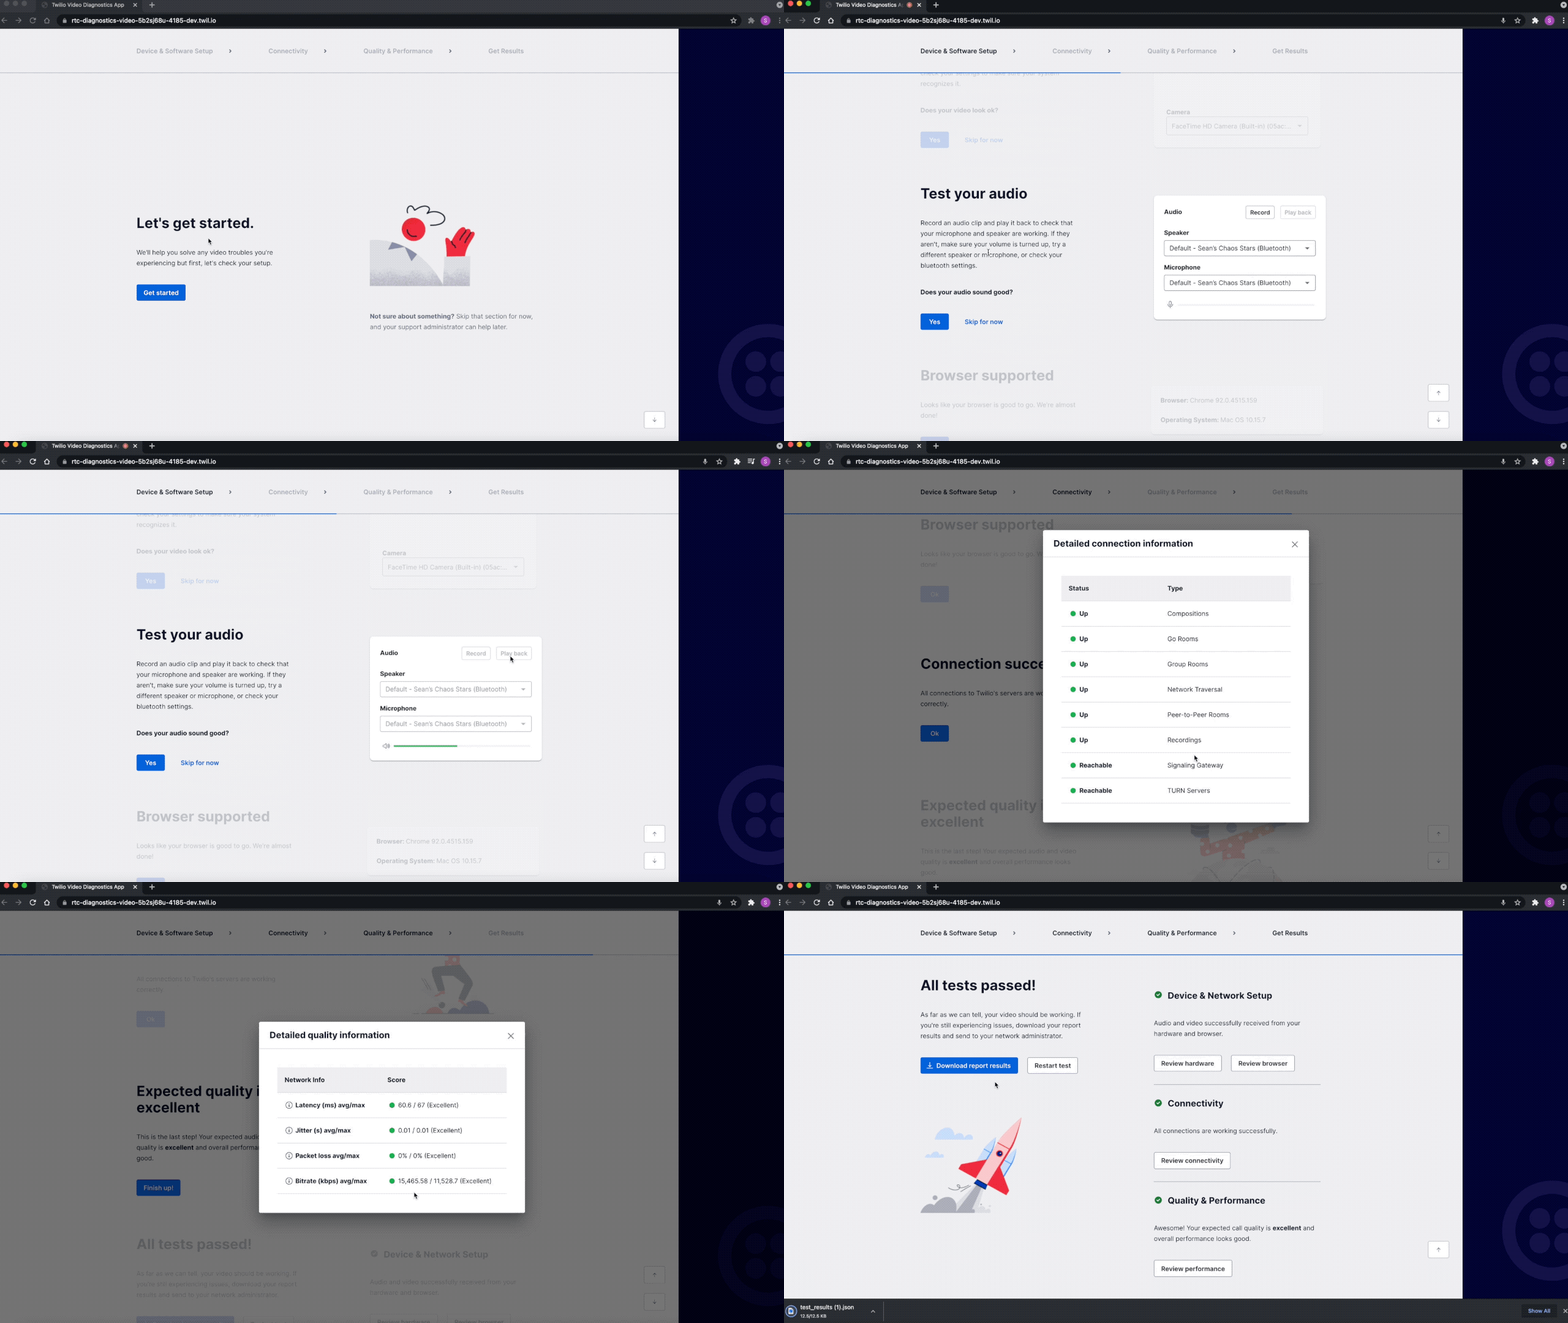
The Twilio Video Diagnostics Application is an open-source ReactJS application that tests participants' device and software setup, connectivity with the Twilio Cloud, and network performance. It uses Twilio's RTC Diagnostics SDK and Preflight API to provide end-users feedback about their network quality and device setup and also includes recommendations for improving their video call quality.

Learn more about the JavaScript Video diagnostics application.
The RTC Diagnostics SDK and Preflight API can also be used independently in your application to test your participants' device setup and network connectivity.
Twilio's RTC Diagnostics SDK for JavaScript applications provides functions to test a participant's input and output devices, including microphones, speakers, and cameras, as well as functionality to confirm that a participant meets the network bandwidth requirements required to make a voice call or conduct a video call.
This is a general WebRTC SDK and does not rely on Twilio infrastructure. You can incorporate it into your applications for pre-call testing or troubleshooting user issues during a call.
The Preflight API, available in versions 2.16.0 and above of the Twilio Video JavaScript SDK, provides functions for testing connectivity to the Twilio Cloud. The API can identify signaling and media connectivity issues and provide a report at the end of the test.
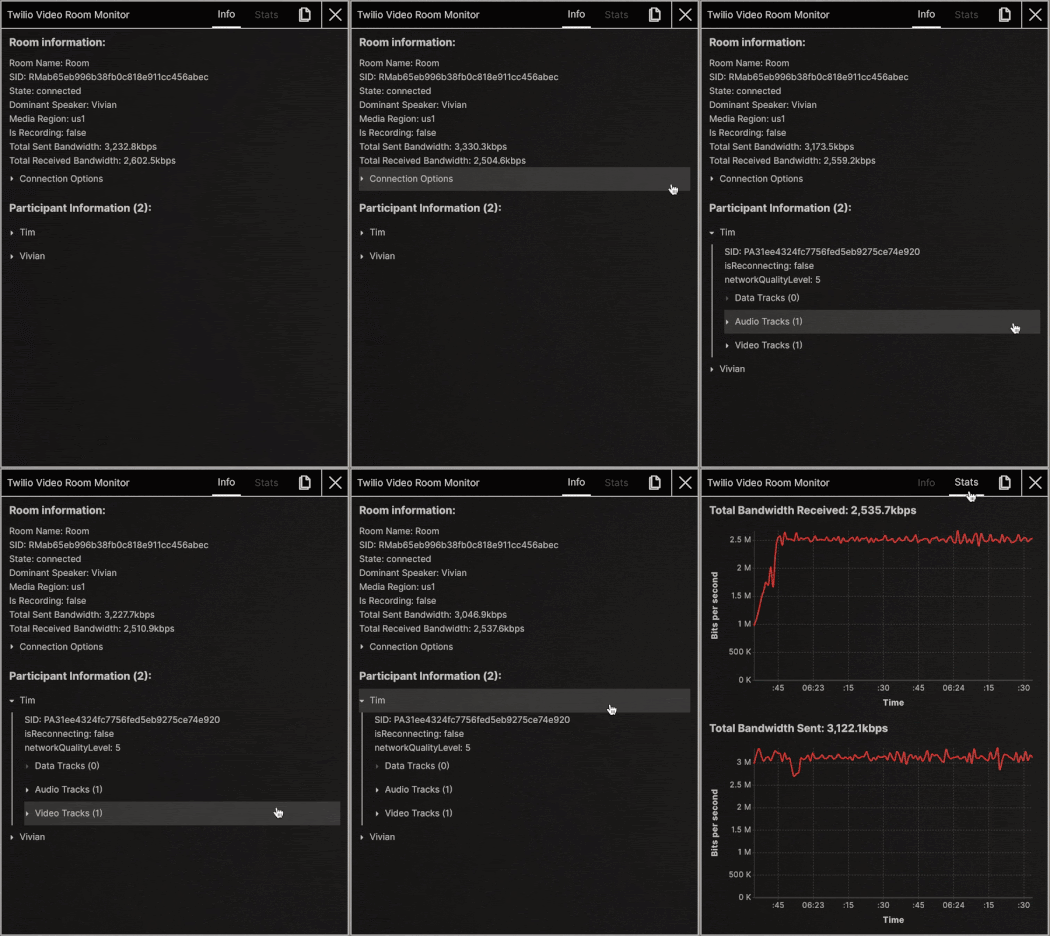
Twilio's JavaScript Room Monitor is a browser-based tool that displays real-time information and metrics about a Twilio Video Room. It gathers and processes information from the Room object, including information about Participants' bandwidth, packet loss, and jitter, and displays the information in a modal window in the video application.

The JavaScript Room Monitor can be added to any Twilio Video JavaScript application to help during all stages of development and/or for debugging in-progress calls.
The JavaScript Logger allows you to capture logs generated by the Twilio Video JS SDK in real-time so that you can monitor your frontend applications and see how they behave in production.