Event Delivery
The Event Delivery tool helps you understand if data is reaching your destinations, and also helps you to see if Segment encountered any issues delivering your source data.
Segment sends billions of events to destinations every week. If Segment encounters any errors when attempting to deliver your data, Segment reports them in the Event Delivery tool.
Available for server side event streaming destinations only
This feature is only available for server side integrations (also known as cloud-mode destinations). You will not be able to use this for client side integrations (also known as device-mode destinations) because device-mode data is sent directly to the destination tool's API. In order to report on deliverability, the data must be sent to destinations using a server side connection.
Not available for Warehouses or Amazon S3
These destinations work differently from other destinations in Segment, and aren't supported.
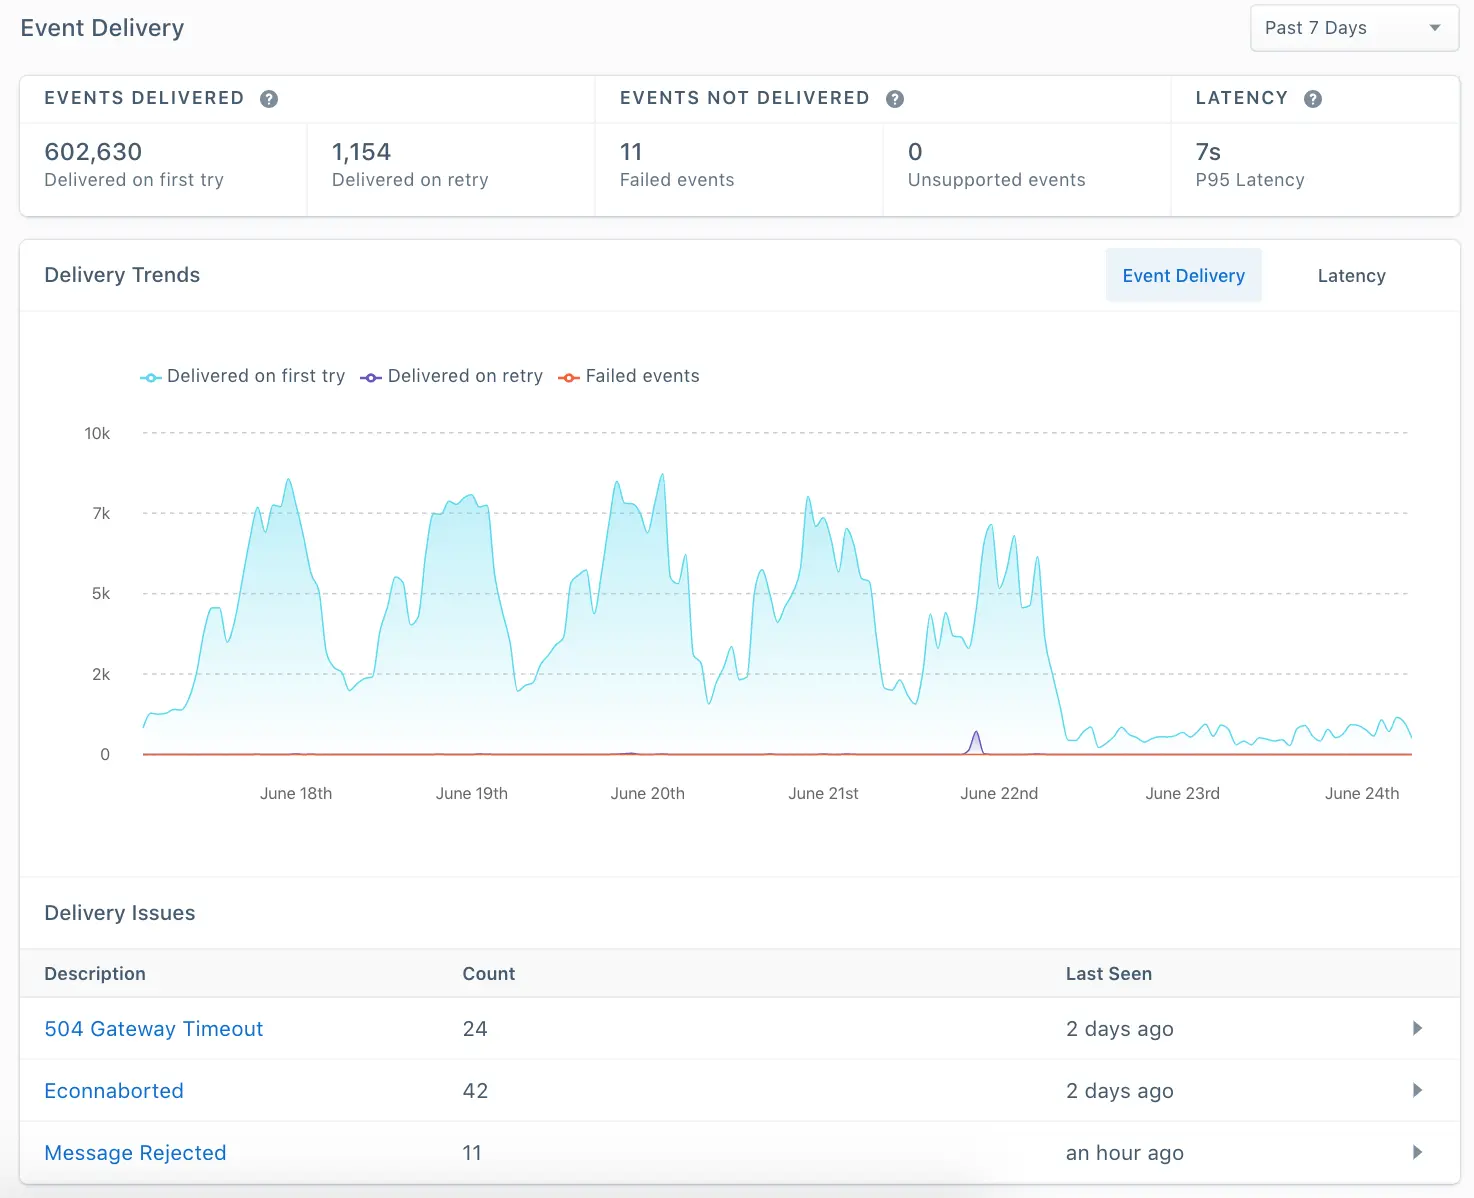
Here's an example of what the Event Delivery tool looks like:
Scenarios when this tool will be useful:
- When data seems to be missing in your destination. For example, you have Google Analytics set up as a destination and your recent data looks incomplete.
- When setting up a destination for the first time. For example, you are connecting Google Analytics to your Node Source. Once you've entered your credentials and turned the destination on, you can use this feature to see whether events are successfully making it to GA in near realtime.
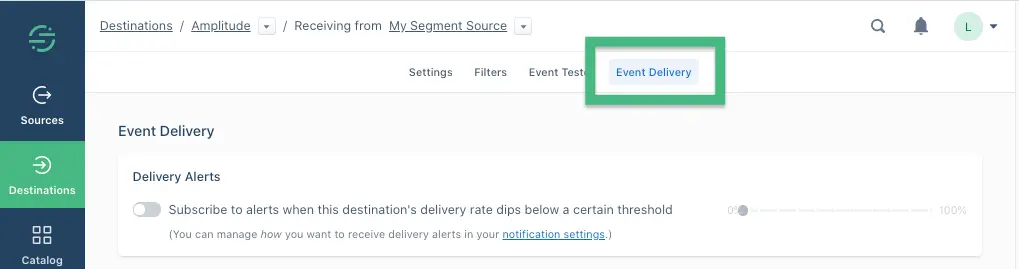
Event Delivery can be accessed within any supported destination in the App. It's located on the tab under "Settings" for each destination.
The UI consists of three key parts that report on Segment's ability to deliver your source data: Key Metrics, Error Details, and Delivery Trends.
There's a drop down menu to select your time period. All of the UI is updated based on the time period you select.
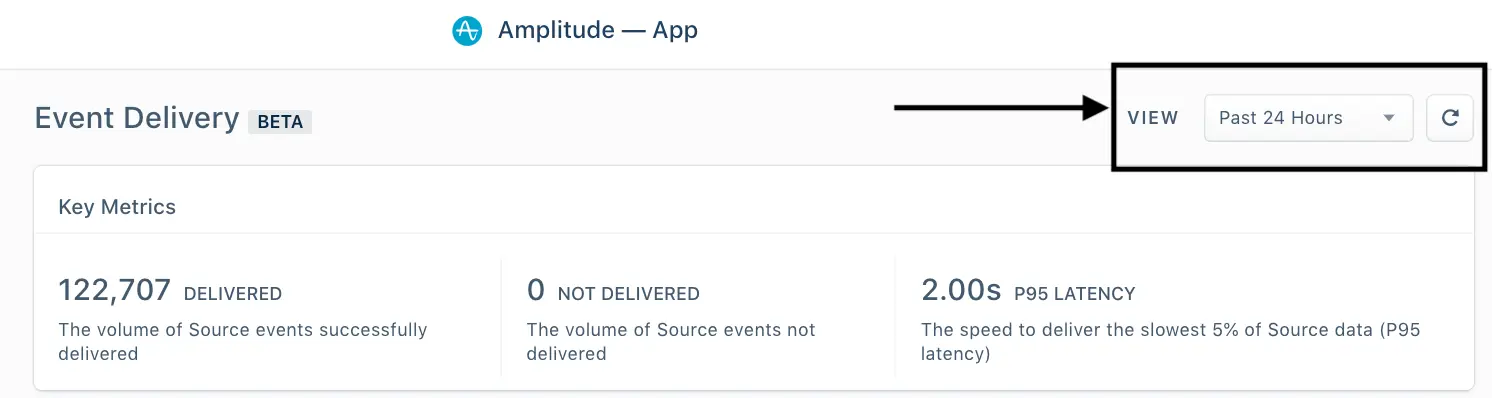
From left to right in the above graphic:
- Delivered: This tells you the number of messages Segment successfully delivered to a destination in the time period you selected.
- Not Delivered: This count tells you the number of messages Segment was unable to deliver. If this number is higher than zero, you will see the reasons for this failure in the errors table below.
- P95 Latency: This is the time it takes for Segment to deliver the slowest 5% of your data (known as P95 latency). The latency reported is end-to-end: the event being received through the Segment API to the event being delivered to partner API. This helps tell you if there is a delay in your data and how bad it is.
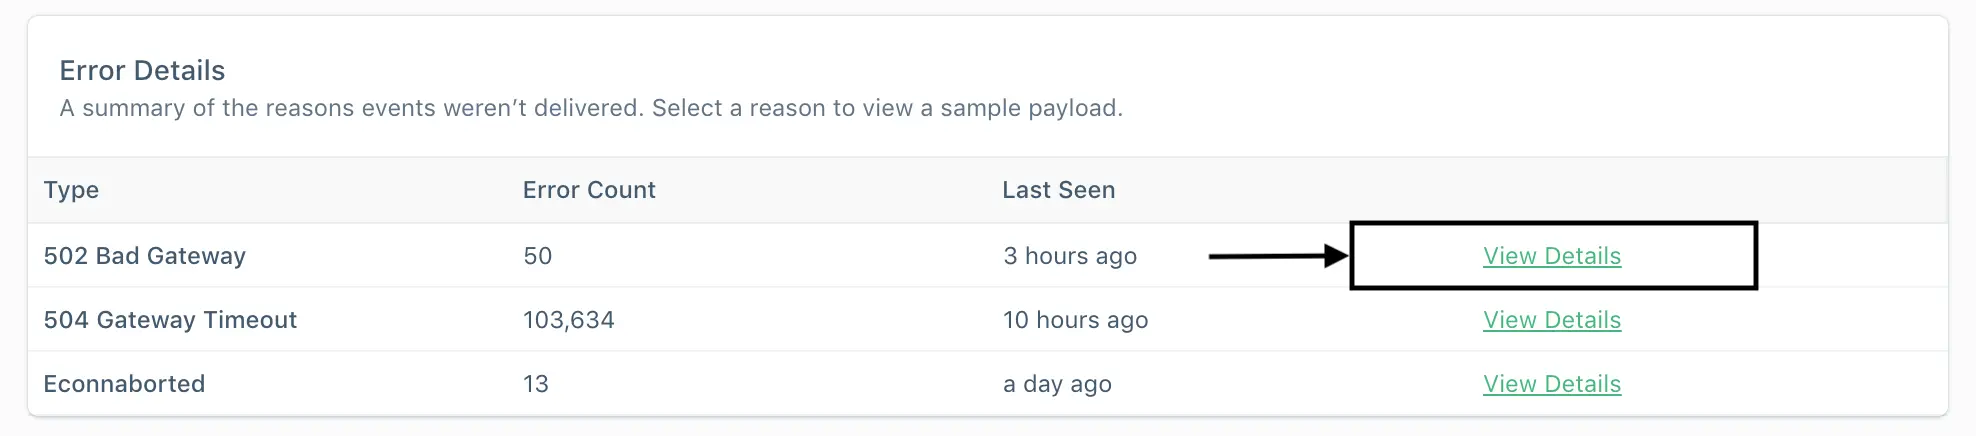
The purpose of the table is to provide you a summary of the different errors we've seen in a given period and the most important information on them. All of the rows in the table are clickable and expand to give you more information.
Info
View Segment's list of Integration Error Codes for more information about what might cause an error.
When there's an error, Segment wants to give you as much information as possible to help you resolve the issue. See below for an example of what this view looks like.
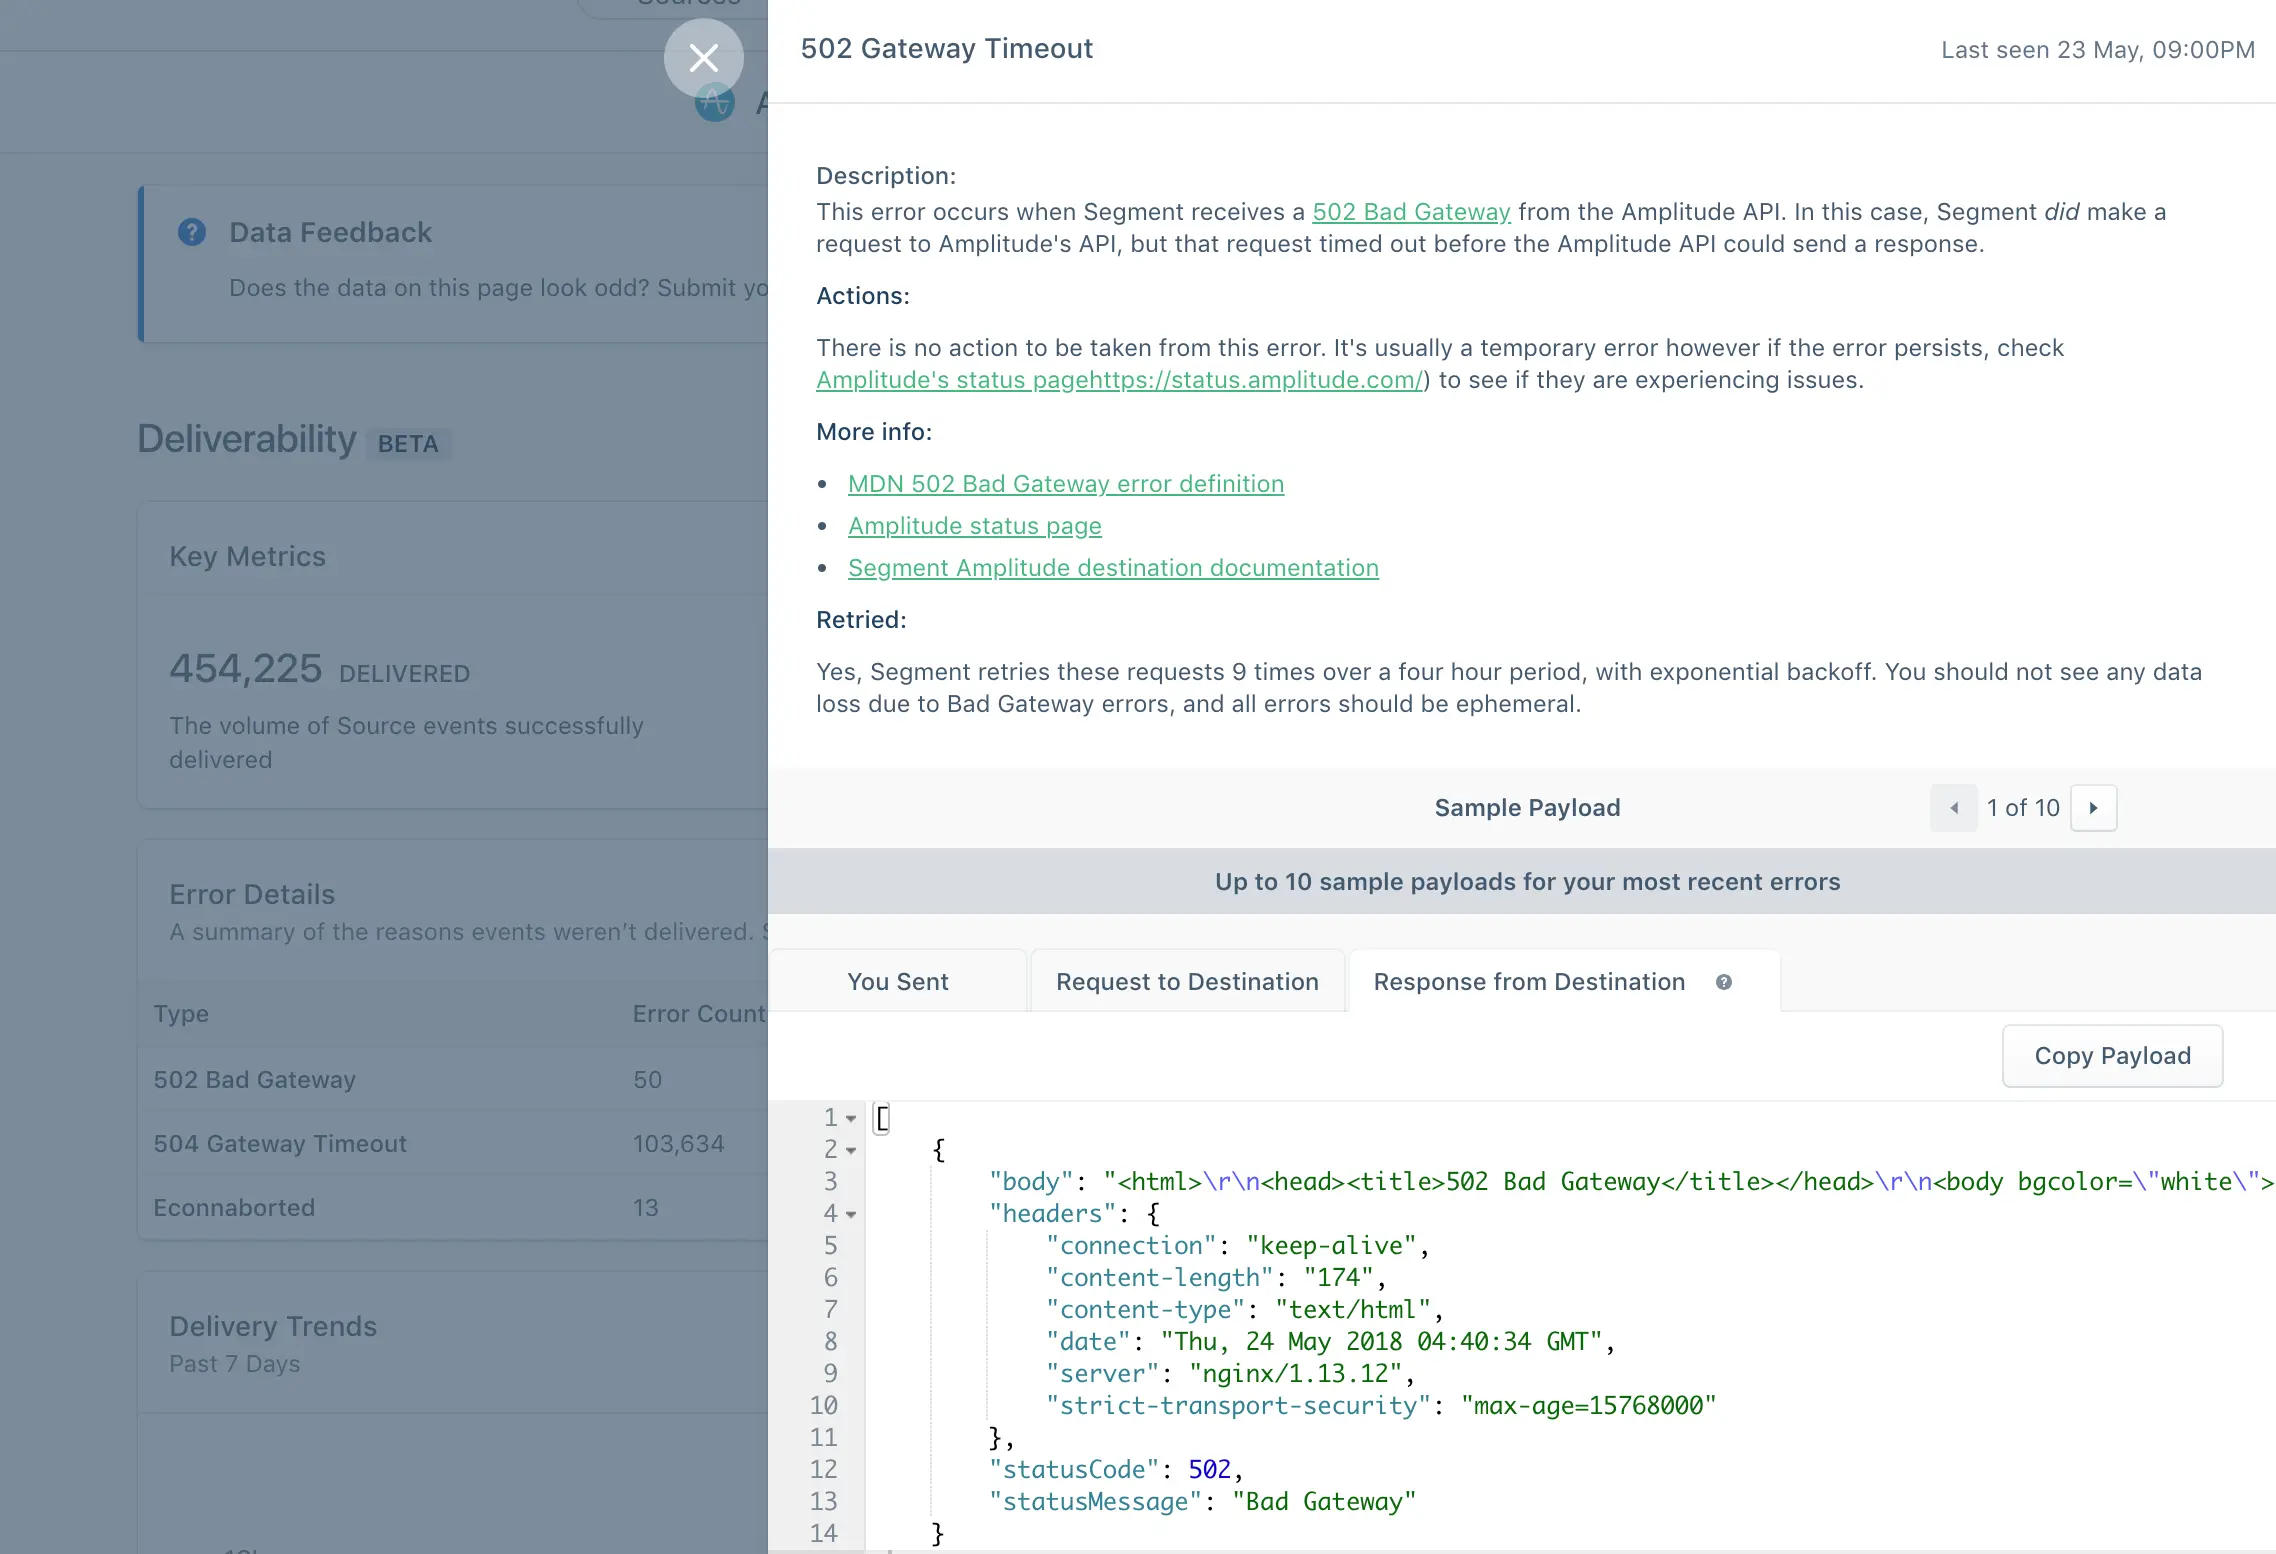
This view includes:
The event delivery UI provides a human-friendly summary of the error, based on the payload Segment received back from the partner.
These are actions you can take, based on what Segment knows about the issue.
This section displays links to any documentation that might be helpful to you.
To help you debug, Segment provides sample payloads from every step of the data's journey:
- You Sent - the data you sent to Segment's API.
- Request to Destination - the request Segment made to the Partner API. This payload will likely be different from what you sent it because Segment is mapping your event to the partner's spec to ensure the message is successfully delivered.
- Response from Destination - the response Segment received from the Partner API. This will have the raw partner error. If you need to troubleshoot an issue with a Partner's Success team, this is usually something they'll want to see.
You can opt in to receive email alerts regarding failed events/syncs by going to your workspace Settings > User Preferences > Activity Notifications > Destinations. Then you can select the option to be alerted by Email, In-app, or both.
When debugging, it's helpful to see when issues start, stop, and trend over time.
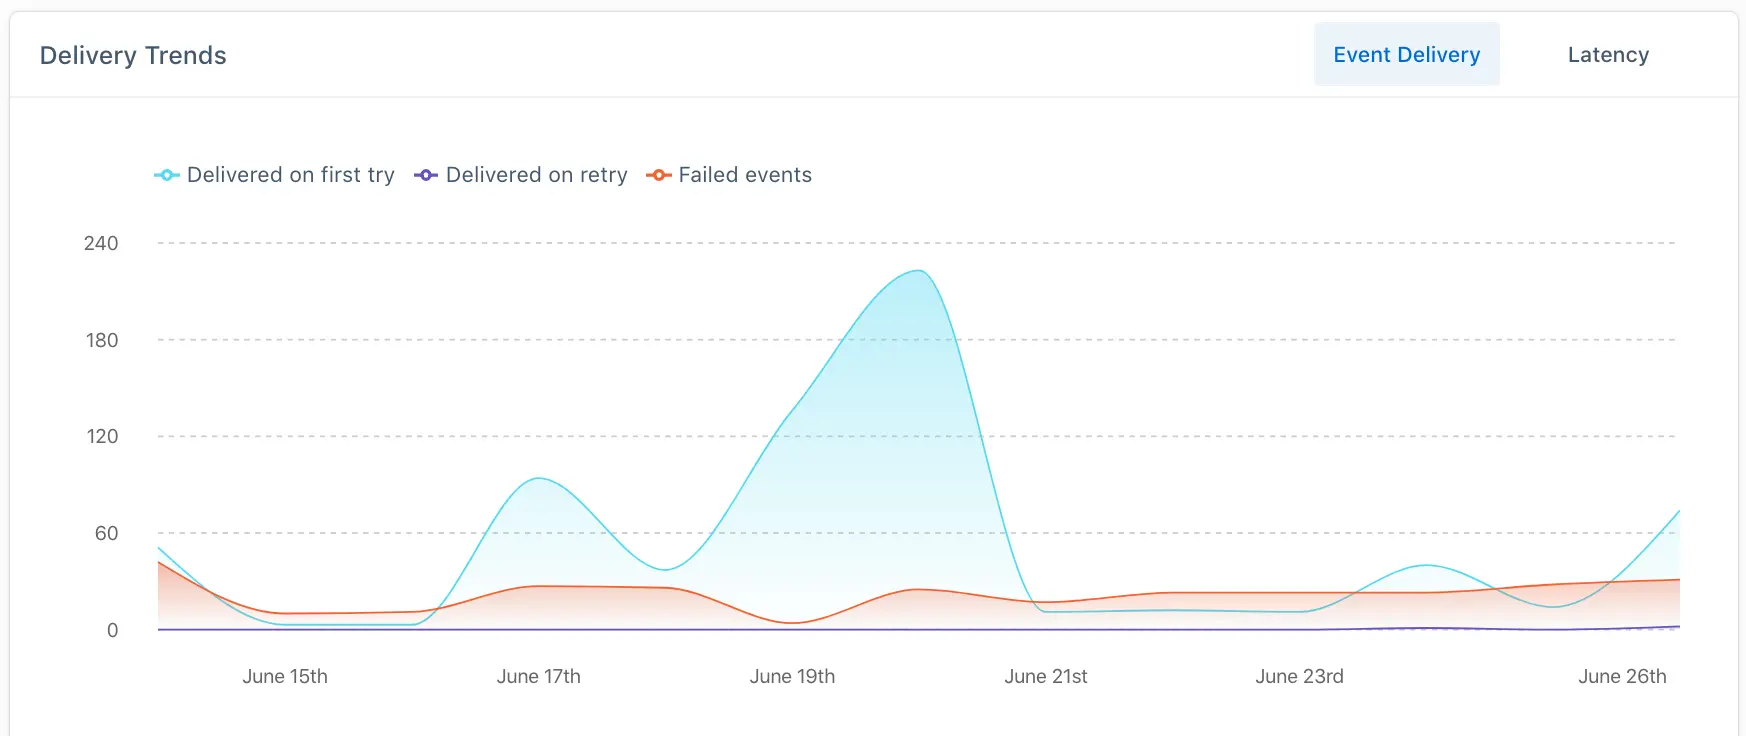
- Delivered: The number of events that were successfully delivered in the time period you selected.
- Not delivered: The number of events that were not successfully delivered in the time period you selected.
How P95 latency has trended over the time period you selected.