Useful SQL Queries for Redshift
Below you'll find a library of some of the most useful SQL queries customers use in their Redshift warehouses. You can run these in your Redshift instance with little to no modification.
Ways to improve query speed
If you're looking to improve the speed of your queries, check out Segment's Speeding Up Redshift Queries page.
You can use SQL queries for the following tasks:
Success!
If you're looking for SQL queries for warehouses other than Redshift, check out some of Segment's Analyzing with SQL guides.
The Track call allows you to record any actions your users perform. A Track call takes three parameters: the userId, the event, and any optional properties.
Here's a basic Track call:
1analytics.track('Completed Order',2item: 'pants',3color: 'blue'4size: '32x32'5payment: 'credit card'6});
A completed order Track call might look like this:
1analytics.track('Completed Order', {2item: 'shirt',3color: 'green'4size: 'Large'5payment: 'paypal'6});
Each Track call is stored as a distinct row in a single Redshift table called tracks. To get a table of your completed orders, you can run the following query:
1select *2from initech.tracks3where event = 'completed_order'
That SQL query returns a table that looks like this:
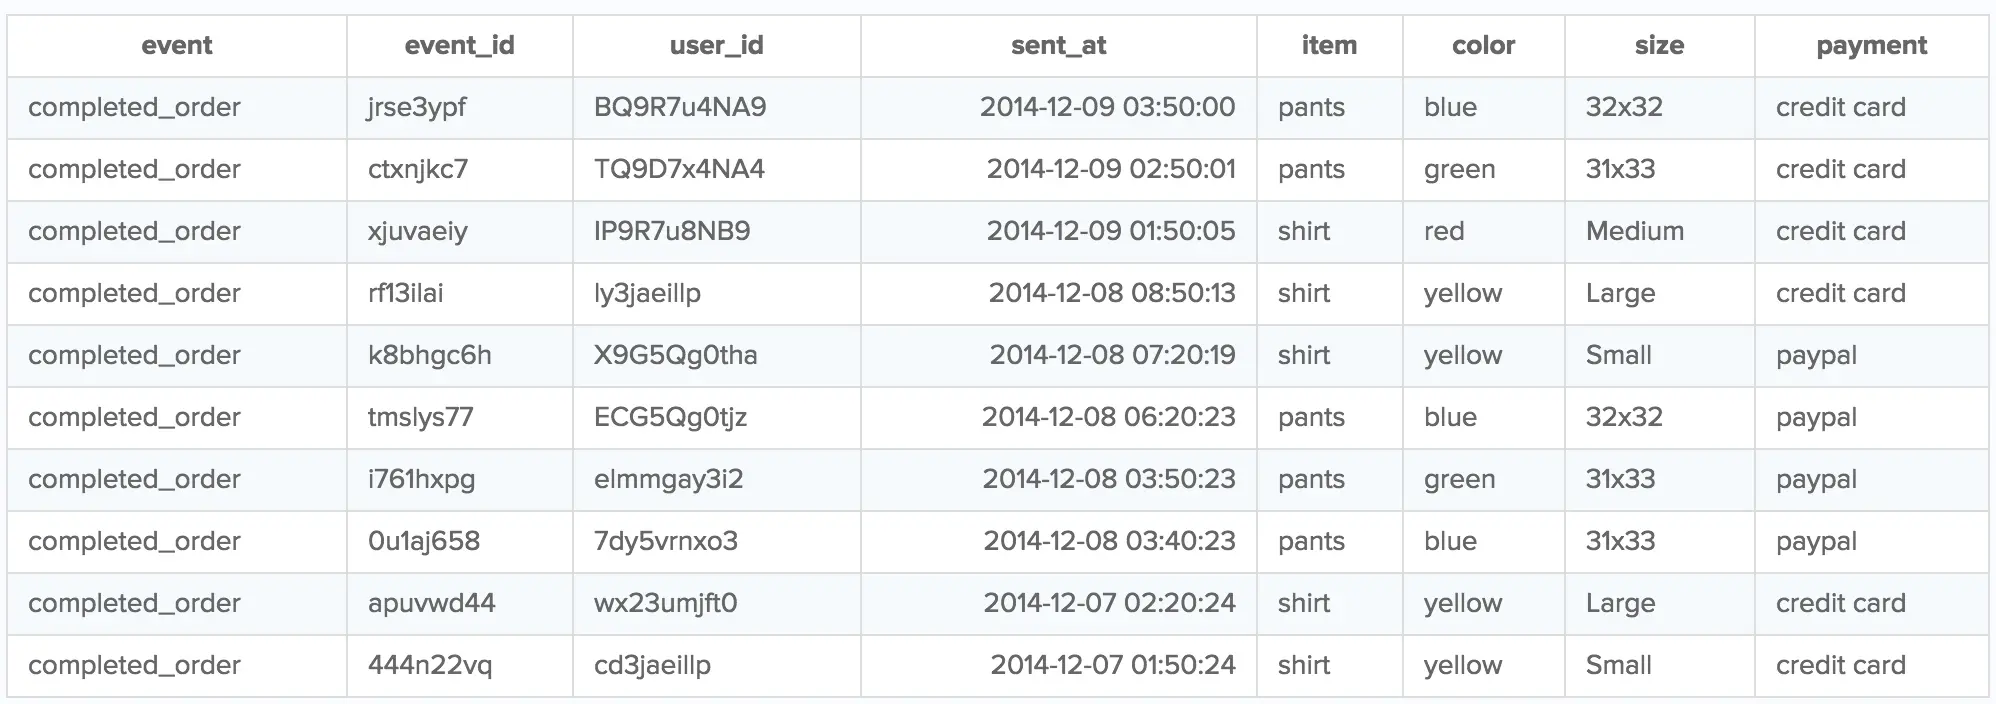
But why are there columns in the table that weren't a part of the Track call, like event_id?
This is because the Track method (for client-side libraries) includes additional properties of the event, like event_id, sent_at, and user_id!
If you want to know how many orders were completed over a span of time, you can use the date() and count function with the sent_at timestamp:
1select date(sent_at) as date, count(event)2from initech.tracks3where event = 'completed_order'4group by date
That query returns a table like this:
| date | count |
|---|---|
| 2021-12-09 | 5 |
| 2021-12-08 | 3 |
| 2021-12-07 | 2 |
To see the number of pants and shirts that were sold on each of those dates, you can query that using case statements:
1select date(sent_at) as date,2sum(case when item = 'shirt' then 1 else 0 end) as shirts,3sum(case when item = 'pants' then 1 else 0 end) as pants4from initech.tracks5where event = 'completed_order'6group by date
That query returns a table like this:
| date | shirts | pants |
|---|---|---|
| 2021-12-09 | 3 | 2 |
| 2021-12-08 | 1 | 2 |
| 2021-12-07 | 2 | 0 |
Segment's API does not impose any restrictions on your data with regard to user sessions.
Sessions aren't fundamental facts about the user experience. They're stories Segment builds around the data to understand how customers actually use the product in their day-to-day lives. And since Segment's API is about collecting raw, factual data, there's no API for collecting sessions. Segment leaves session interpretation to SQL partners, which let you design how you measure sessions based on how customers use your product.
For more on why Segment doesn't collect session data at the API level, check out Twilio's Facts vs. Stories: Why Segment has no Sessions API blog.
Each of Segment's SQL partners allow you to define sessions based on your specific business needs. With Looker, for example, you can take advantage of their persistent derived tables and LookML modeling language to layer sessionization on top of your Segment SQL data.
To define sessions with raw SQL, a great query and explanation comes from Mode Analytics.
Here's the query to make it happen, but read Mode Analytics' blog post for more information. Mode walks you through the reasoning behind the query, what each portion accomplishes, how you can tweak it to suit your needs, and the kinds of further analysis you can add on top of it.
1-- Finding the start of every session2SELECT *3FROM (4SELECT *5LAG(sent_at,1) OVER (PARTITION BY user_id ORDER BY sent_at) AS last_event6FROM "your_source".tracks7) last8WHERE EXTRACT('EPOCH' FROM sent_at) - EXTRACT('EPOCH' FROM last_event) >= (60 * 10)9OR last_event IS NULL1011-- Mapping every event to its session12SELECT *,13SUM(is_new_session) OVER (ORDER BY user_id, sent_at ROWS BETWEEN UNBOUNDED PRECEDING AND CURRENT ROW) AS global_session_id,14SUM(is_new_session) OVER (PARTITION BY user_id ORDER BY sent_at ROWS BETWEEN UNBOUNDED PRECEDING AND CURRENT ROW) AS user_session_id15FROM (16SELECT *,17CASE WHEN EXTRACT('EPOCH' FROM sent_at) - EXTRACT('EPOCH' FROM last_event) >= (60 * 10)18OR last_event IS NULL19THEN 1 ELSE 0 END AS is_new_session20FROM (21SELECT *,22LAG(sent_at,1) OVER (PARTITION BY user_id ORDER BY sent_at) AS last_event23FROM "your_source".tracks24) last25) final
The Identify method ties user attributes to a userId.
1analytics.identify('bob123',{2email: 'bob@initech.com',3plan: 'Free'4});
As these user traits change over time, you can continue calling the Identify method to update their changes. With this query, you can update Bob's account plan to "Premium".
1analytics.identify('bob123', {2email: 'bob@initech.com',3plan: 'Premium'4});
Each Identify call is stored in a single Redshift table called identifies. To see how a user's plan changes over time, you can run the following query:
1select email, plan, sent_at2from initech.identifies3where email = 'bob@initech.com'
This SQL query returns a table of Bob's account information, with each entry representing the state of his account at different time periods:
| user_id | plan | sent_at | |
|---|---|---|---|
| bob123 | bob@intech.com | Premium | 2021-12-20 19:44:03 |
| bob123 | bob@intech.com | Basic | 2021-12-18 17:48:10 |
If you want to see what your users looked like at a previous point in time, you can find that data in the identifies table. To get this table for your users, replace 'initech' in the SQL query with your source slug.
If you only want the current state of the users, convert the identifies table into a distinct users table by returning the most recent Identify call for each account.
The following query returns the identifies table:
1select *2from initech.identifies
That query returns a table like this:
| user_id | plan | sent_at | |
|---|---|---|---|
| bob123 | bob@intech.com | Premium | 2021-12-20 19:44:03 |
| bob123 | bob@intech.com | Basic | 2021-12-18 17:48:10 |
| jeff123 | jeff@intech.com | Premium | 2021-12-20 19:44:03 |
| jeff123 | jeff@intech.com | Basic | 2021-12-18 17:48:10 |
If all you want is a table of distinct user with their current traits and without duplicates, you can do so with the following query:
1with identifies as (2select user_id,3email,4plan,5sent_at,6row_number() over (partition by user_id order by sent_at desc) as rn7from initech.identifies8),9users as (10select user_id,11email,12plan13from identifies14where rn = 115)1617select *18from users
Let's say you have an identifies table that looks like this:
| user_id | plan | sent_at | |
|---|---|---|---|
| bob123 | bob@intech.com | Premium | 2021-12-20 19:44:03 |
| bob123 | bob@intech.com | Basic | 2021-12-18 17:48:10 |
| jeff123 | jeff@intech.com | Premium | 2021-12-20 19:44:03 |
| jeff123 | jeff@intech.com | Basic | 2021-12-18 17:48:10 |
If you want to query the traits of these users, you first need to convert the identifies table into a users table. From there, run a query like this to get a count of users with each type of plan:
1with identifies as (2select user_id,3email,4plan,5sent_at,6row_number() over (partition by user_id order by sent_at desc) as rn7from initech.identifies8),9users as (10select plan11from identifies12where rn = 113)1415select sum(case when plan = 'Premium' then 1 else 0 end) as premium,16sum(case when plan = 'Free' then 1 else 0 end) as free17from users
And there you go: a count of users with each type of plan!
| premium | free |
|---|---|
| 2 | 0 |
The group method ties a user to a group. It also lets you record custom traits about the group, like the industry or number of employees.
Here's what a basic group call looks like:
1analytics.group('0e8c78ea9d97a7b8185e8632', {2name: 'Initech',3industry: 'Technology',4employees: 329,5plan: 'Premium'6});
As these group traits change over time, you can continue calling the group method to update their changes.
1analytics.group('0e8c78ea9d97a7b8185e8632', {2name: 'Initech',3industry: 'Technology',4employees: 600,5plan: 'Enterprise'6});
Each group call is stored as a distinct row in a single Redshift table called groups. To see how a group changes over time, you can run the following query:
1select name, industry, plan, employees, sent_at2from initech.groups3where name = 'Initech'
The previous query will return a table of Initech's group information, with each entry representing the state of the account at different times.
| name | industry | employees | plan | sent_at |
|---|---|---|---|---|
| Initech | Technology | 600 | Premium | 2021-12-20 19:44:03 |
| Initech | Technology | 349 | Free | 2021-12-18 17:18:15 |
If you want to see a group's traits at a previous point in time, this query is useful (To get this table for your groups, replace 'initech' with your source slug).
If you only want to see the most recent state of the group, you can convert the groups table into a distinct groups table by viewing the most recent groups call for each account.
The following query will return your groups table:
1select *2from initech.groups
The previous query returns the following table:
| name | industry | employees | plan | sent_at |
|---|---|---|---|---|
| Initech | Technology | 600 | Premium | 2021-12-20 19:44:03 |
| Initech | Technology | 349 | Free | 2021-12-18 17:18:15 |
| Acme Corp | Entertainment | 15 | Premium | 2021-12-20 19:44:03 |
| Acme Corp | Entertainment | 10 | Free | 2021-12-18 17:18:15 |
However, if all you want is a table of distinct groups and current traits, you can do so with the following query:
1with groups as (2select name,3industry,4employees,5plan,6sent_at,7row_number() over (partition by name order by sent_at desc) as rn8from initech.groups9),10organizations as (11select name,12industry,13employees,14plan15from groups16where rn = 117)1819select *20from organizations
This query will return a table with your distinct groups, without duplicates.
| name | industry | employees | plan | sent_at |
|---|---|---|---|---|
| Initech | Technology | 600 | Premium | 2021-12-20 19:44:03 |
| Acme Corp | Entertainment | 15 | Premium | 2021-12-20 19:44:03 |