SMS Pumping Protection Insights
SMS Pumping Protection uses automatic fraud detection to block messages flagged as being suspicious for SMS pumping fraud from being sent. It works by analyzing your current and historical SMS traffic for unusual patterns. When there are unexpected fluctuations in your SMS traffic for a specific location, or system-known malicious activity, this feature will automatically block messages to phone numbers associated with the suspected fraud.
SMS Pumping Protection Insights provides you with data visualizations and filtering capabilities to:
- Monitor estimated cost savings from SMS Pumping Protection.
- Analyze trends in messages scanned by SMS Pumping Protection.
- Understand the geographic breakdown of your SMS Pumping Protection.
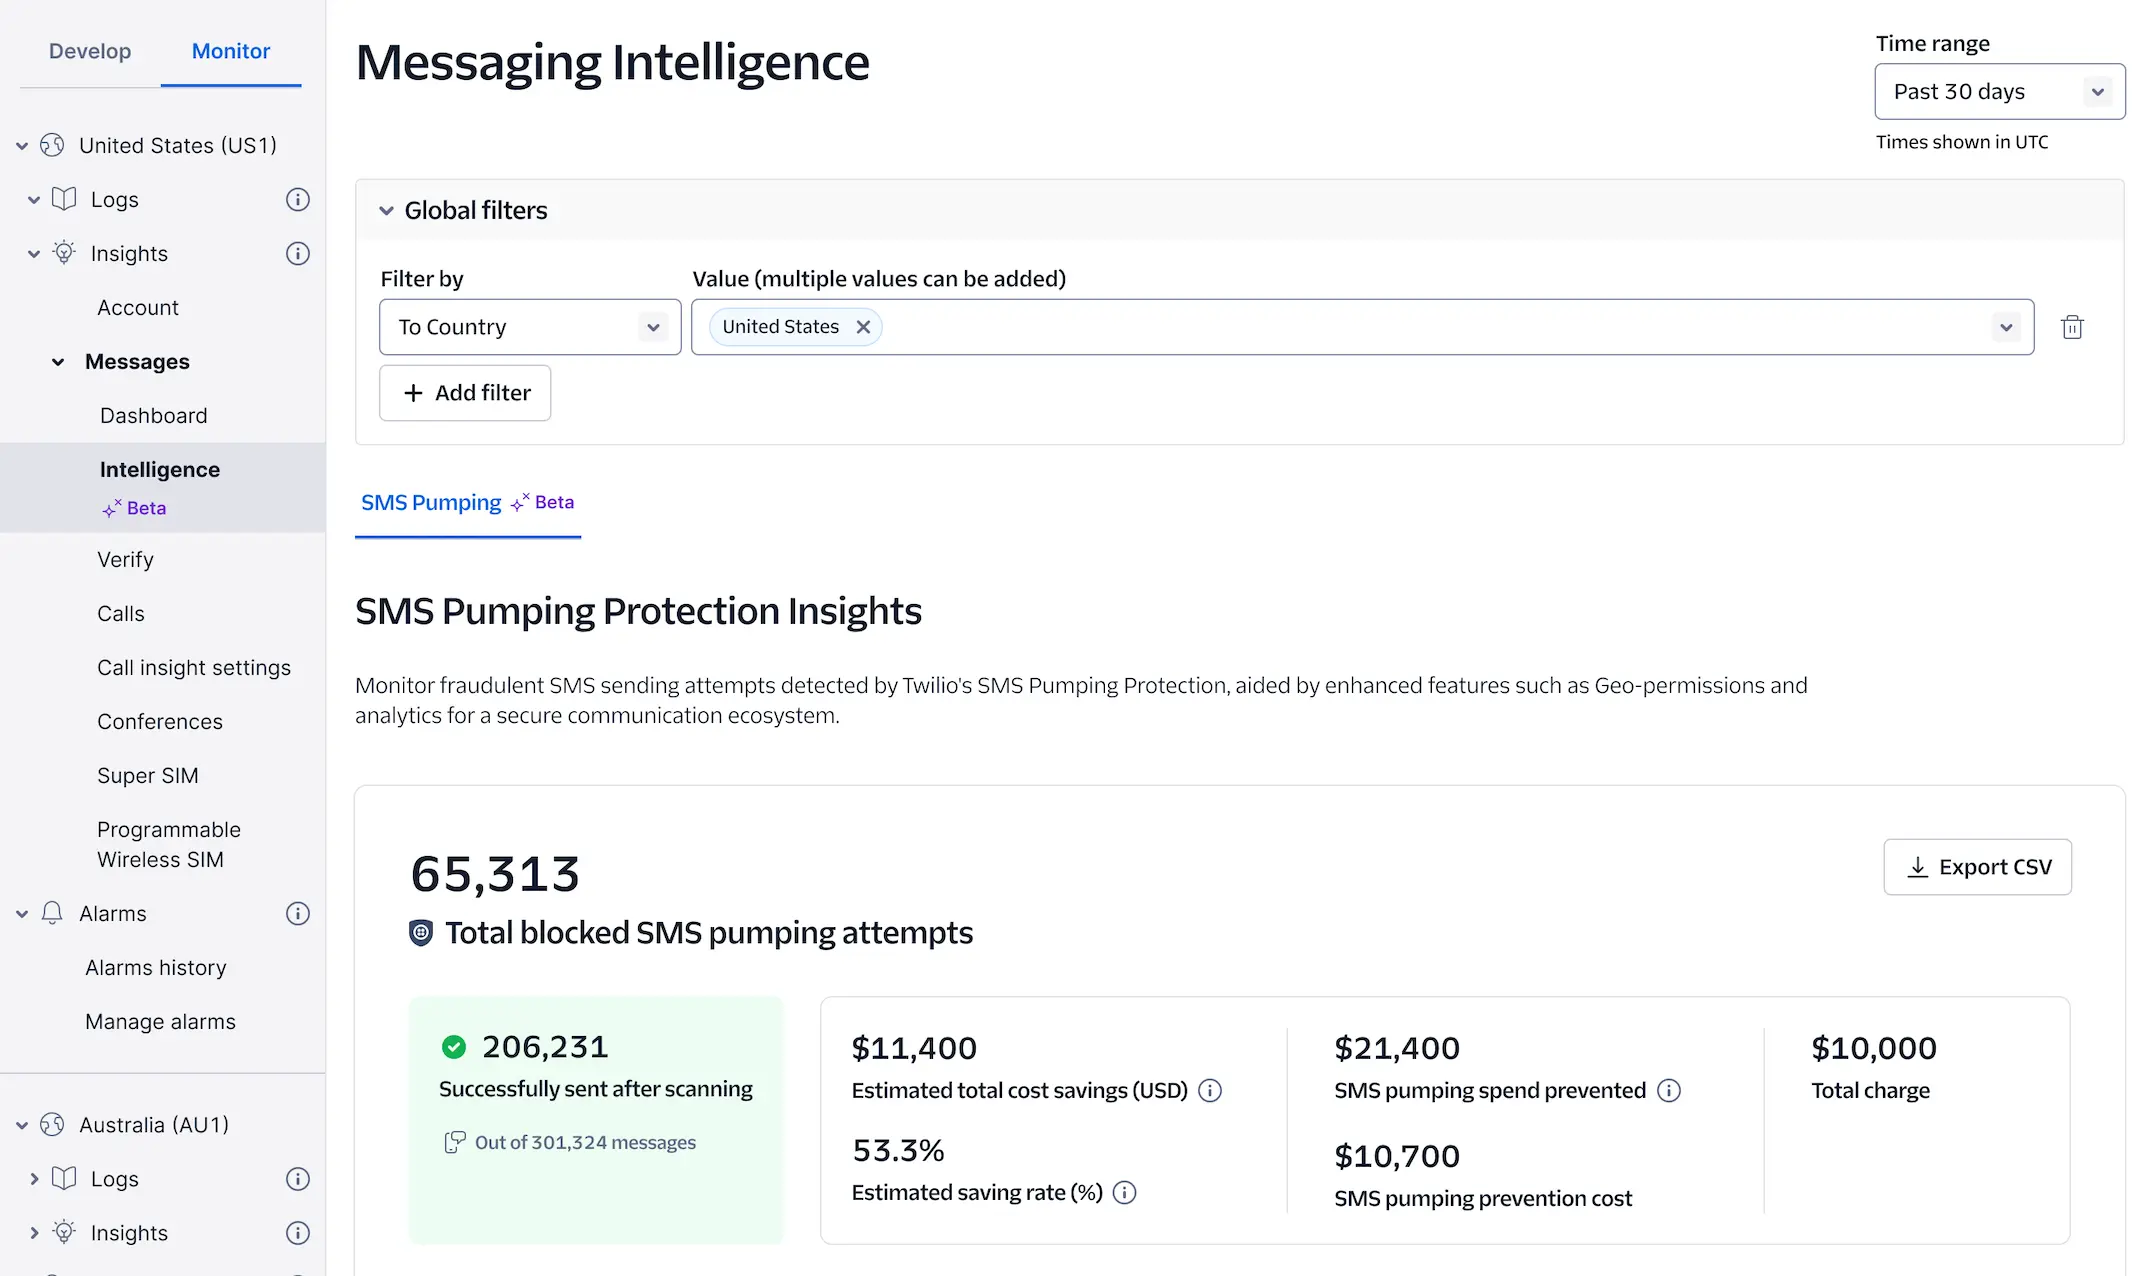
SMS Pumping Protection Insights can be found in the Console by navigating to Monitor > Insights > Intelligence. The Messaging Intelligence Console page contains:
- The SMS Pumping tab with the SMS Pumping Protection Insights dashboard.
- Controls to filter your dashboard data.
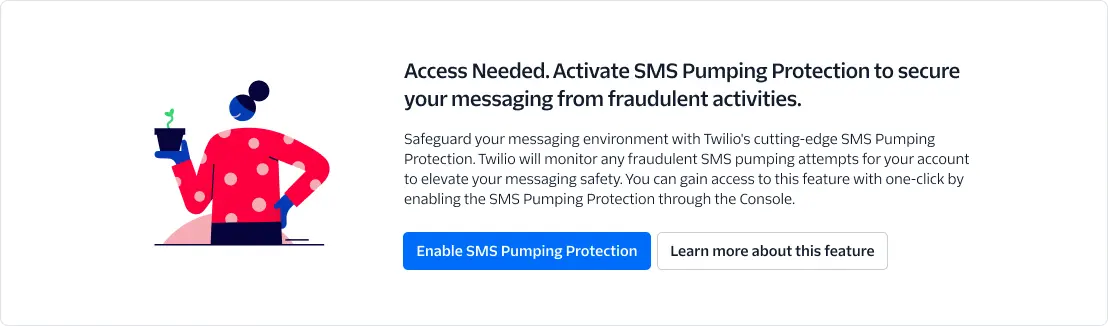
Before you can benefit from the information provided by SMS Pumping Protection Insights, you must ensure that SMS Pumping Protection is enabled for your account.
If you navigate to SMS Pumping Protection Insights in Console and see the banner titled Access Needed. Activate SMS Pumping Protection to secure your messaging from fraudulent activities, your SMS Pumping Protection is disabled.
- Press the Enable SMS Pumping Protection button to enable SMS Pumping Protection.
- Press the Learn more about this feature button to gain a better understanding of what SMS Pumping Protection is and why it is important to use.
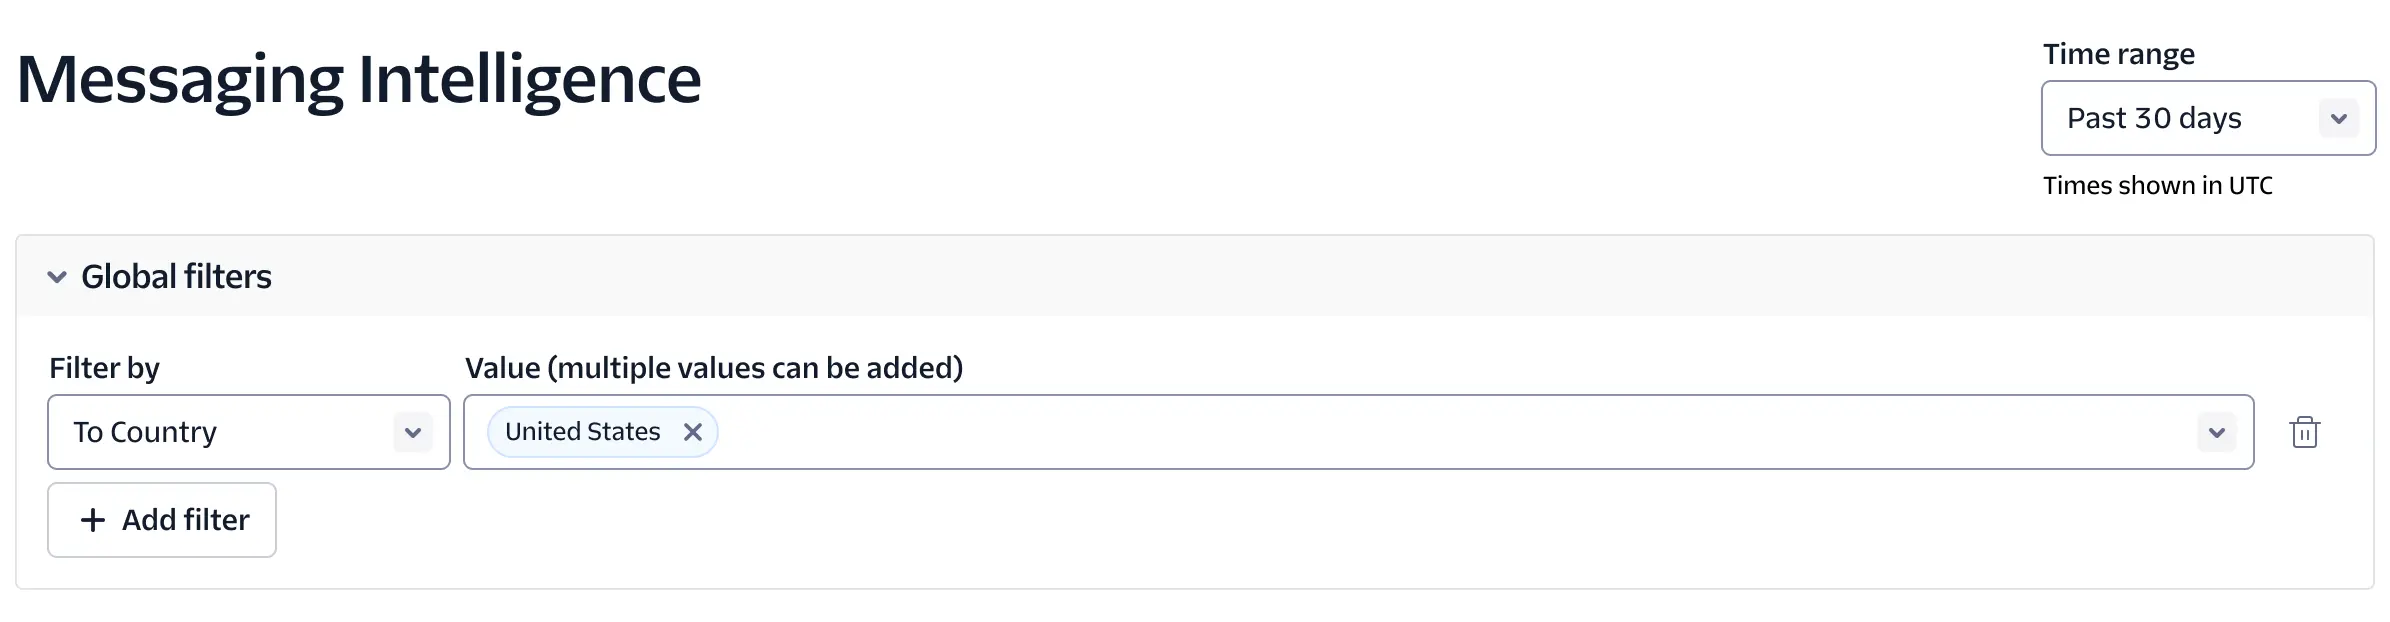
You can filter the data displayed in your SMS Pumping Protection Insights dashboard in two ways:
- By Time Range
- Using one or more Filter by criteria applied as Global Filters. Filter by criteria supported for SMS Pumping Protection Insights are:
- From Country
- To Country
- Subaccount
Use the Time Range selector and Filter by dropdowns at the top of the dashboard to narrow your data. Add one or more Global Filters for From Country, To Country, or Subaccount.
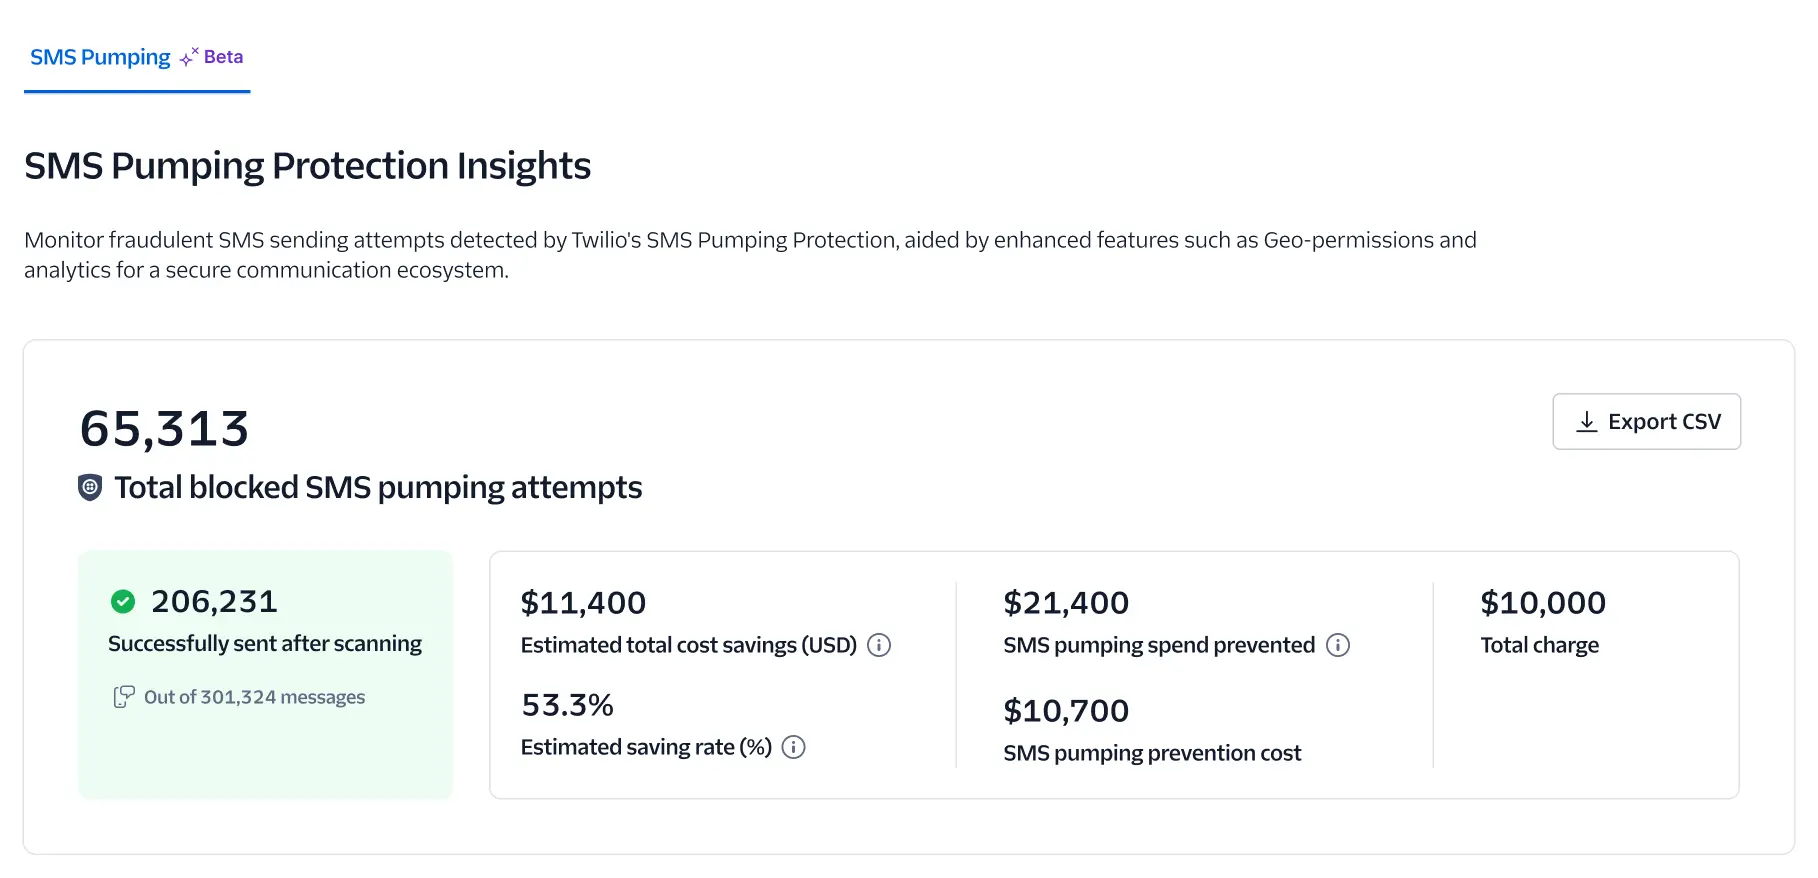
The top section of your SMS Pumping Protection Insights dashboard focuses on providing you key indicators of the performance and cost savings achieved by using SMS Pumping Protection.
This dashboard section contains the following message volume information:
- Total blocked SMS pumping attempts
- Number of messages successfully sent after scanning
- Total number of messages sent
In order to monitor the financial impact of using SMS Pumping Protection this section displays your:
- Estimated total cost savings (USD)
- Estimated savings rate (%)
- SMS pumping spend prevented
- SMS pumping prevention cost
- Total charge
You can press the info icon next to these dashboard items to see additional information. Press the Export CSV button to download the data displayed in this section for further analysis.
The top section of the dashboard displays key metrics including total blocked SMS pumping attempts, messages successfully sent after scanning, estimated cost savings, savings rate, spend prevented, prevention cost, and total charge. Press the info icon next to any metric to see additional details. Use the Export CSV button to download this data.
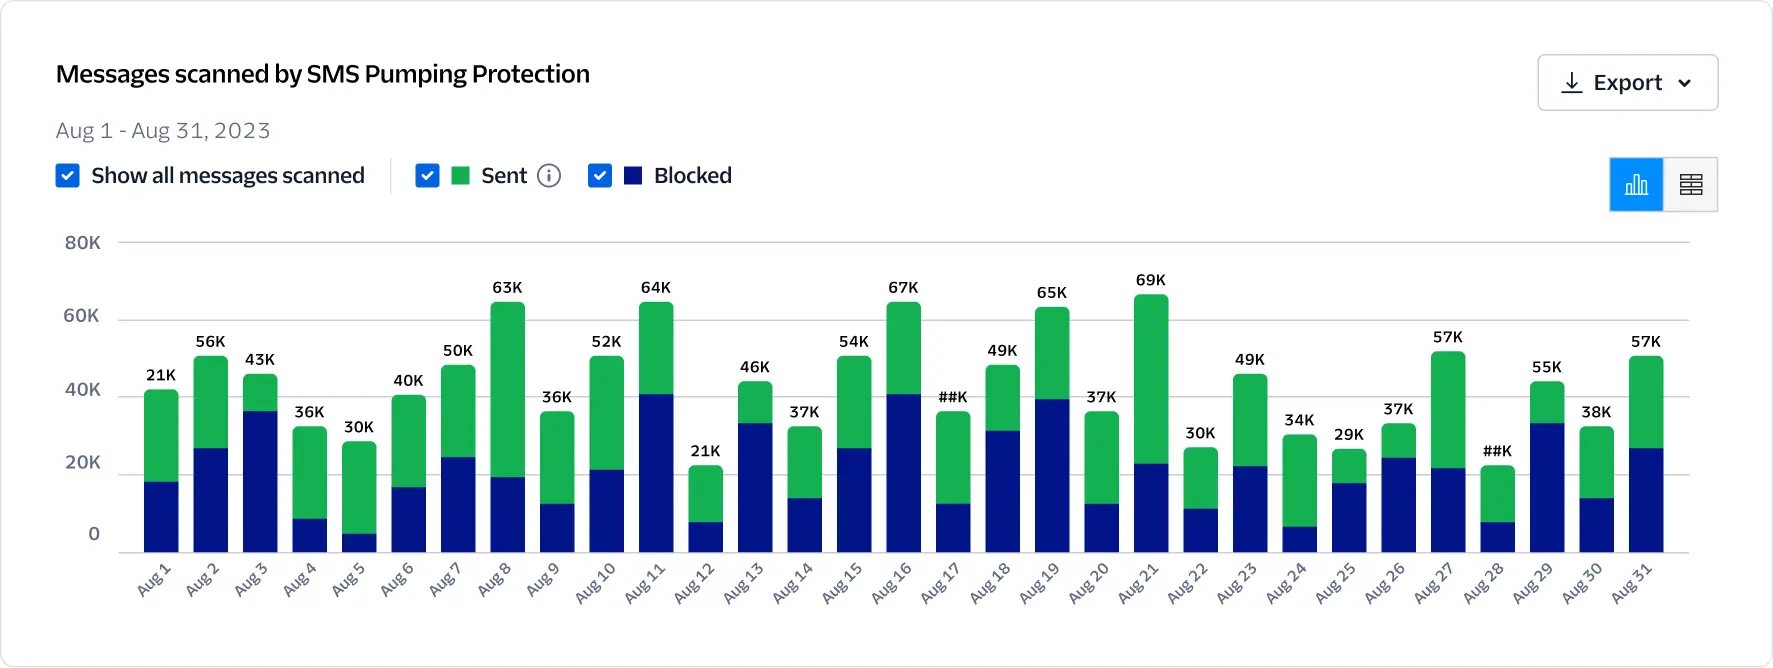
The Messages scanned by SMS Pumping Protection section of the SMS Pumping Insights dashboard visualizes the time trend of the volume of your Messages sent and Messages blocked in a stacked bar chart.
The chart legend contains checkboxes to dynamically change which data to display, use the:
- Show all messages scanned checkbox to see all data.
- Sent checkbox to toggle the display of Messages sent in the chart on and off.
- Blocked checkbox to toggle the display of Messages blocked in the chart on and off.
You can use the Chart View/Table View button group to change the data display mode.
Press the Export button to download the data displayed in the chart for further analysis.
The Messages scanned by SMS Pumping Protection chart displays a stacked bar chart showing Sent and Blocked message volumes over time. Use the chart legend checkboxes (Show all messages scanned, Sent, Blocked) to toggle which data series are visible. Switch between Chart View and Table View using the button group, and press Export to download the data.
The SMS Pumping protection by origin countries section of the SMS Pumping Insights dashboard allows you to visualize the volume distribution of blocked SMS pumping traffic in a world map so that you can analyze the geographic origins of fraud activities.
Using the dropdown menu you can change which metric is represented by the bubbles overlayed on the world map by selecting one of the following two options:
- Total blocked SMS Pumping attempts.
- Estimated total cost savings from SMS Pumping Protection.
The bubbles' sizes are scaled proportionally in accordance with your chosen metric. You can hover over a bubble to see a tooltip with the corresponding country name and value for the metric.
Depending on your chosen metric, you can check the right-hand sidebar to see a list of your:
- Top countries with SMS pumping.
- Top country cost savings.
You can use the Chart View/Table View button group to change the data display mode.
Press the Export button to download the data displayed in the geomap for further analysis.
The SMS Pumping protection by origin countries section displays a world map with proportionally sized bubbles representing blocked attempts or estimated cost savings by country. Use the dropdown to switch between Total blocked SMS Pumping attempts and Estimated total cost savings metrics. Hover over bubbles for country details, and check the right-hand sidebar for Top countries with SMS pumping or Top country cost savings rankings. Switch between Chart View and Table View using the button group, and press Export to download the data.

Review the other data visualization and analytics capabilities offered by Messaging Insights.
To get a better understanding of SMS Pumping Protection:
- Check out our SMS Pumping Protection for Programmable Messaging feature documentation.
- Read our guide to Preventing Fraud in Programmable Messaging.