Debugging Tools
Twilio offers several tools for investigating the interaction between Twilio and your application. If a message cannot go through, is delayed, or otherwise behaves unexpectedly, these tools should be your first stops for debugging.
Error Logs in the Twilio Console contain a list of errors within your application. These logs can help you dive deeper into how your application is performing and where issues might be occurring.
To get to the Error Logs page in the Console, go to Monitor > Logs > Error Logs from the right-hand sidebar.
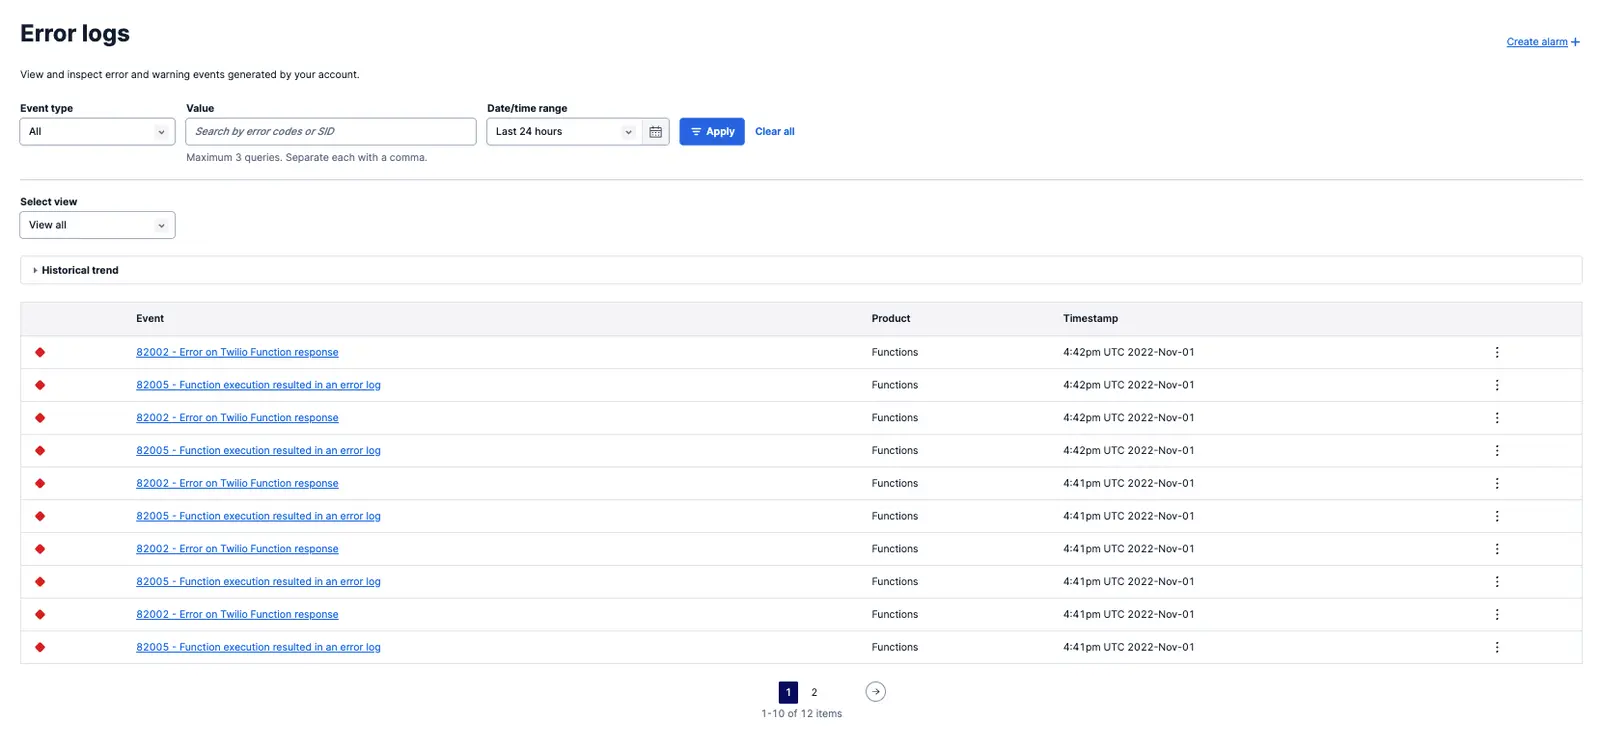
Once there, you can dig into detailed logs of errors. Each log shows the error code, the impacted Twilio product, and the timestamp when the error happened.
You can also view a histogram of events for a given date/time range by clicking the Historical trend dropdown above the list of events.
If you click on an individual event in the Error Logs, you can see properties of the message that encountered an error. These include timestamps, your resource SID, any warnings or errors thrown by Twilio, and the full context of the message request and response.
Alarms allow you to create customized alerts based on spikes in certain types of errors and proactively monitor your application. This feature replaces the previous concept of Alert Triggers. See the Alarms documentation for more information about how to configure these.
You can find all Twilio-generated error codes in the Error and Warning Dictionary.
The table below lists common Programmable Messaging error codes. These error codes show up in the ErrorCode properties of Twilio's status callback requests and in the Message resource's ErrorCode property.
| Error Code | Error Message | Description |
|---|---|---|
| 30001 | Queue overflow | You tried to send too many messages too quickly, and your message queue overflowed. Try sending your message again after waiting for some time. |
| 30002 | Account suspended | Your account was suspended between the time of message send and delivery. Please contact Twilio. |
| 30003 | Unreachable destination handset | The destination handset you are trying to reach is switched off or otherwise unavailable. |
| 30004 | Message blocked | The destination number you are trying to reach is blocked from receiving this message (e.g., due to blocklisting). |
| 30005 | Unknown destination handset | The destination number you are trying to reach is unknown and may no longer exist. |
| 30006 | Landline or unreachable carrier | The destination number is unable to receive this message. Potential reasons could include trying to reach a landline or, in the case of short codes, an unreachable carrier. |
| 30007 | Carrier violation | Your message was flagged as objectionable by the carrier. To protect their subscribers, many carriers have implemented content or spam filtering. Learn more about carrier filtering |
| 30008 | Unknown error | The error does not fit into any of the above categories. |
| 30009 | Missing segment | One or more segments associated with your multi-part inbound message was not received. |
The following ErrorCodes apply only when you are sending a message via WhatsApp or another non-SMS messaging channel.
| Error Code | Error Message | Description |
|---|---|---|
| 63001 | Channel could not authenticate the request | Channel authentication credentials are incorrect. Please check the credentials or re-authenticate with the Channel. |
| 63002 | Channel could not find From address | The From address does not map to any configured Channels. Check that you are using the correct Channel endpoint address from the Channel page. |
| 63003 | Channel could not find To address | The To address is incorrect. |
| 63005 | Channel did not accept given content | |
| 63006 | Could not format given content for the channel | |
| 63007 | Twilio could not find a Channel with the specified From address | The From address does not map to any configured Channels. Check that you are using the correct Channel endpoint address from the Channel page. |
| 63008 | Could not execute the request because the channel module is misconfigured | Please check the Channel configuration in Twilio. |
| 63009 | Channel returned an error when executing the request | Please see Channel specific error message for more information. |
| 63010 | Channels - Twilio Internal error | |
| 63012 | Channel returned an internal error that prevented it from completing the request | |
| 63013 | This message send failed because it violates Channel provider's policy. | Please see Channel specific error message for more information. |
| 63014 | This message failed to be delivered to the user because it was blocked by a user action. | Please see Channel specific error message for more information. |
If you encounter issues with message delivery, such as duplicate message delivery, the best way to begin debugging is by viewing your Programmable Messaging Logs. See the Programmable Messaging Logs documentation for more information about how to use these logs.
If you are unable to figure out what went wrong with your message, you can contact Twilio's support team. Make sure to provide any relevant Message SIDs (a 34-character string starting with SM for SMS or MM for MMS) in your request. You can find the Message SID associated with an error in the detailed error log view.