Email Logs
The Email Logs product provides a centralized view of recent email activity for your account. It allows you to search, filter, and inspect individual messages to understand their delivery path and troubleshoot issues. Email Logs retains data for up to 30 days, giving you extended visibility into message-level events and outcomes.
Email Logs includes filters to help you locate and view specific messages. Each filter supports exact string matching.
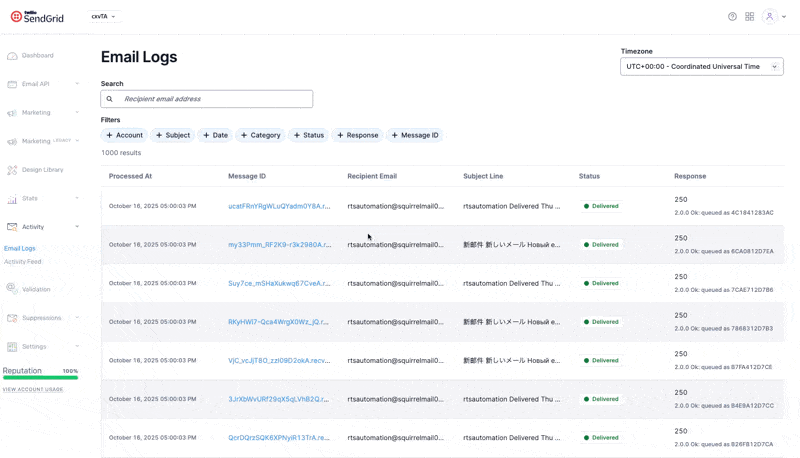
The following filters are available to efficiently locate and analyze log events. Each filter supports exact-string match with specific capabilities including partial matching, autocomplete, and multi-select options:
- Recipient Email Address: Search for a specific recipient email address.
- Account: Filter by username or subuser username.
- Subject: Filter messages by the email's subject line.
- Date: Filter messages within a specific send time range using a date picker.
- Category: Filter by your defined category names.
- Status: Filter by the message's delivery outcome (e.g., received, dropped, processed, delivered, deferred, bounced, or blocked).
- Response: Search by the receiving server's response code or response text.
- Message ID: Search for a specific sg_message_id. This is occasionally presented as message id or msg_id.
Selecting a message from the results list opens the Email Details page, which provides a complete view of that message's lifecycle and delivery timeline.
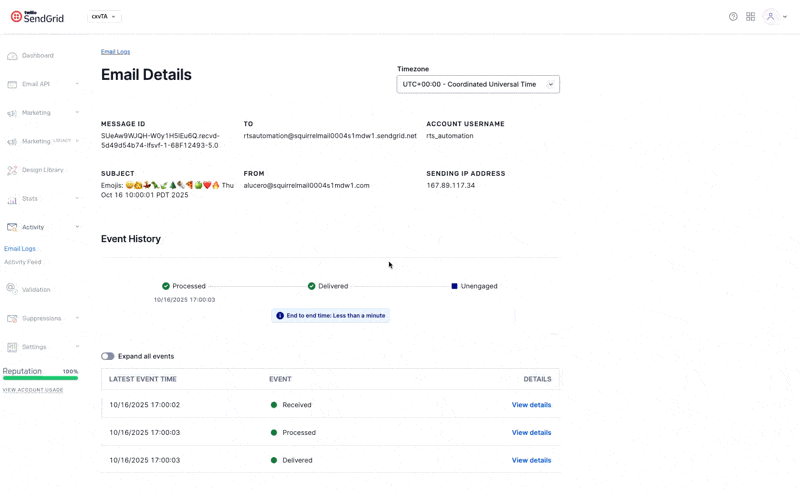
The page is divided into several sections:
At the top of the page, you'll see high-level message attributes, including:
- Message ID: The unique sg_message_id for the selected message.
- To/From: The recipient and sender email addresses
- Subject: The subject line of the email.
- Account Username: The username that sent the message.
- Sending IP Address: The IP address from which the message originated.
A visual timeline displays each stage in the message's lifecycle. This describes how Twilio SendGrid processed the email, whether it was delivered to the recipient domain, and what engagement occurred on the email. A summary banner below the timeline shows the end-to-end time, which represents how long it took the email to move from initial processing to final delivery.
Beneath the timeline, the Event History table lists each recorded event for that message. The events are ordered chronologically by event type. When multiple occurrences of the same event type exist, use the expand all events toggle to show every event in the timeline.
To open a detailed panel showing an event's full JSON payload, click view details next to the event. The structure and fields of this payload align closely with those delivered through the Event Webhook, though minor differences can exist between the two sources.