Email Insights Overview tab
The Overview tab is the home screen for Email Insights. It gives you a summary of your account's email performance for any selected time range: how many emails you sent, how many were delivered, and how your recipients are engaging.
The top of the Overview tab shows four KPI cards:
| Card | What it measures |
|---|---|
| Processed | Total emails accepted by Twilio SendGrid for delivery |
| Delivered | Total emails successfully accepted by the recipient mail server |
| Open Rate | Total opens ÷ delivered |
| Click Rate | Total clicks ÷ delivered |
Each card includes a View Logs link when the underlying messages are within Email Logs retention. This opens Email Logs with the same date range and filters used in Email Insights, scoped to the messages represented by that aggregate. For example, clicking View Logs from an open count opens Email Logs filtered to messages with open events in that aggregate.
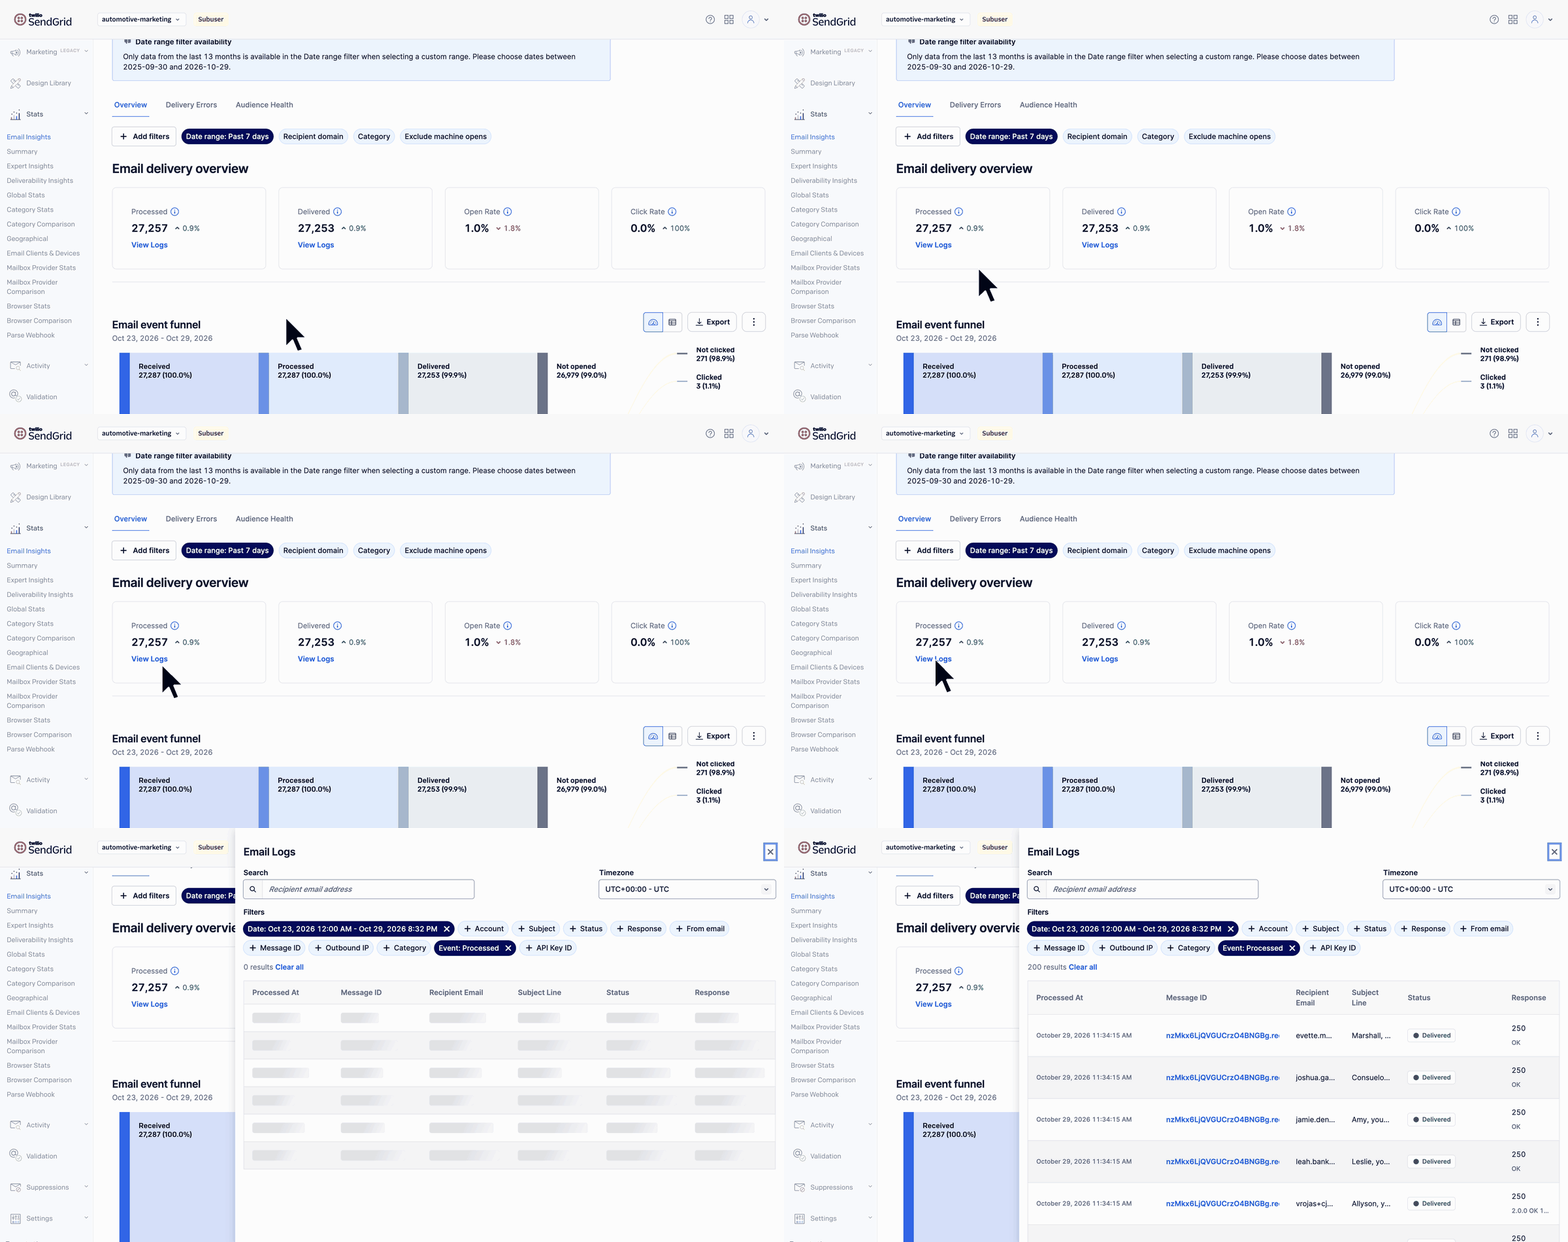
To learn more about message-level search, see Email Logs.
The email event funnel visualizes how message volume moves through key delivery and engagement outcomes. It starts with the total messages received and shows how that volume breaks into dropped, processed, delivered, bounced, blocked, opened, clicked, not opened, and not clicked outcomes.
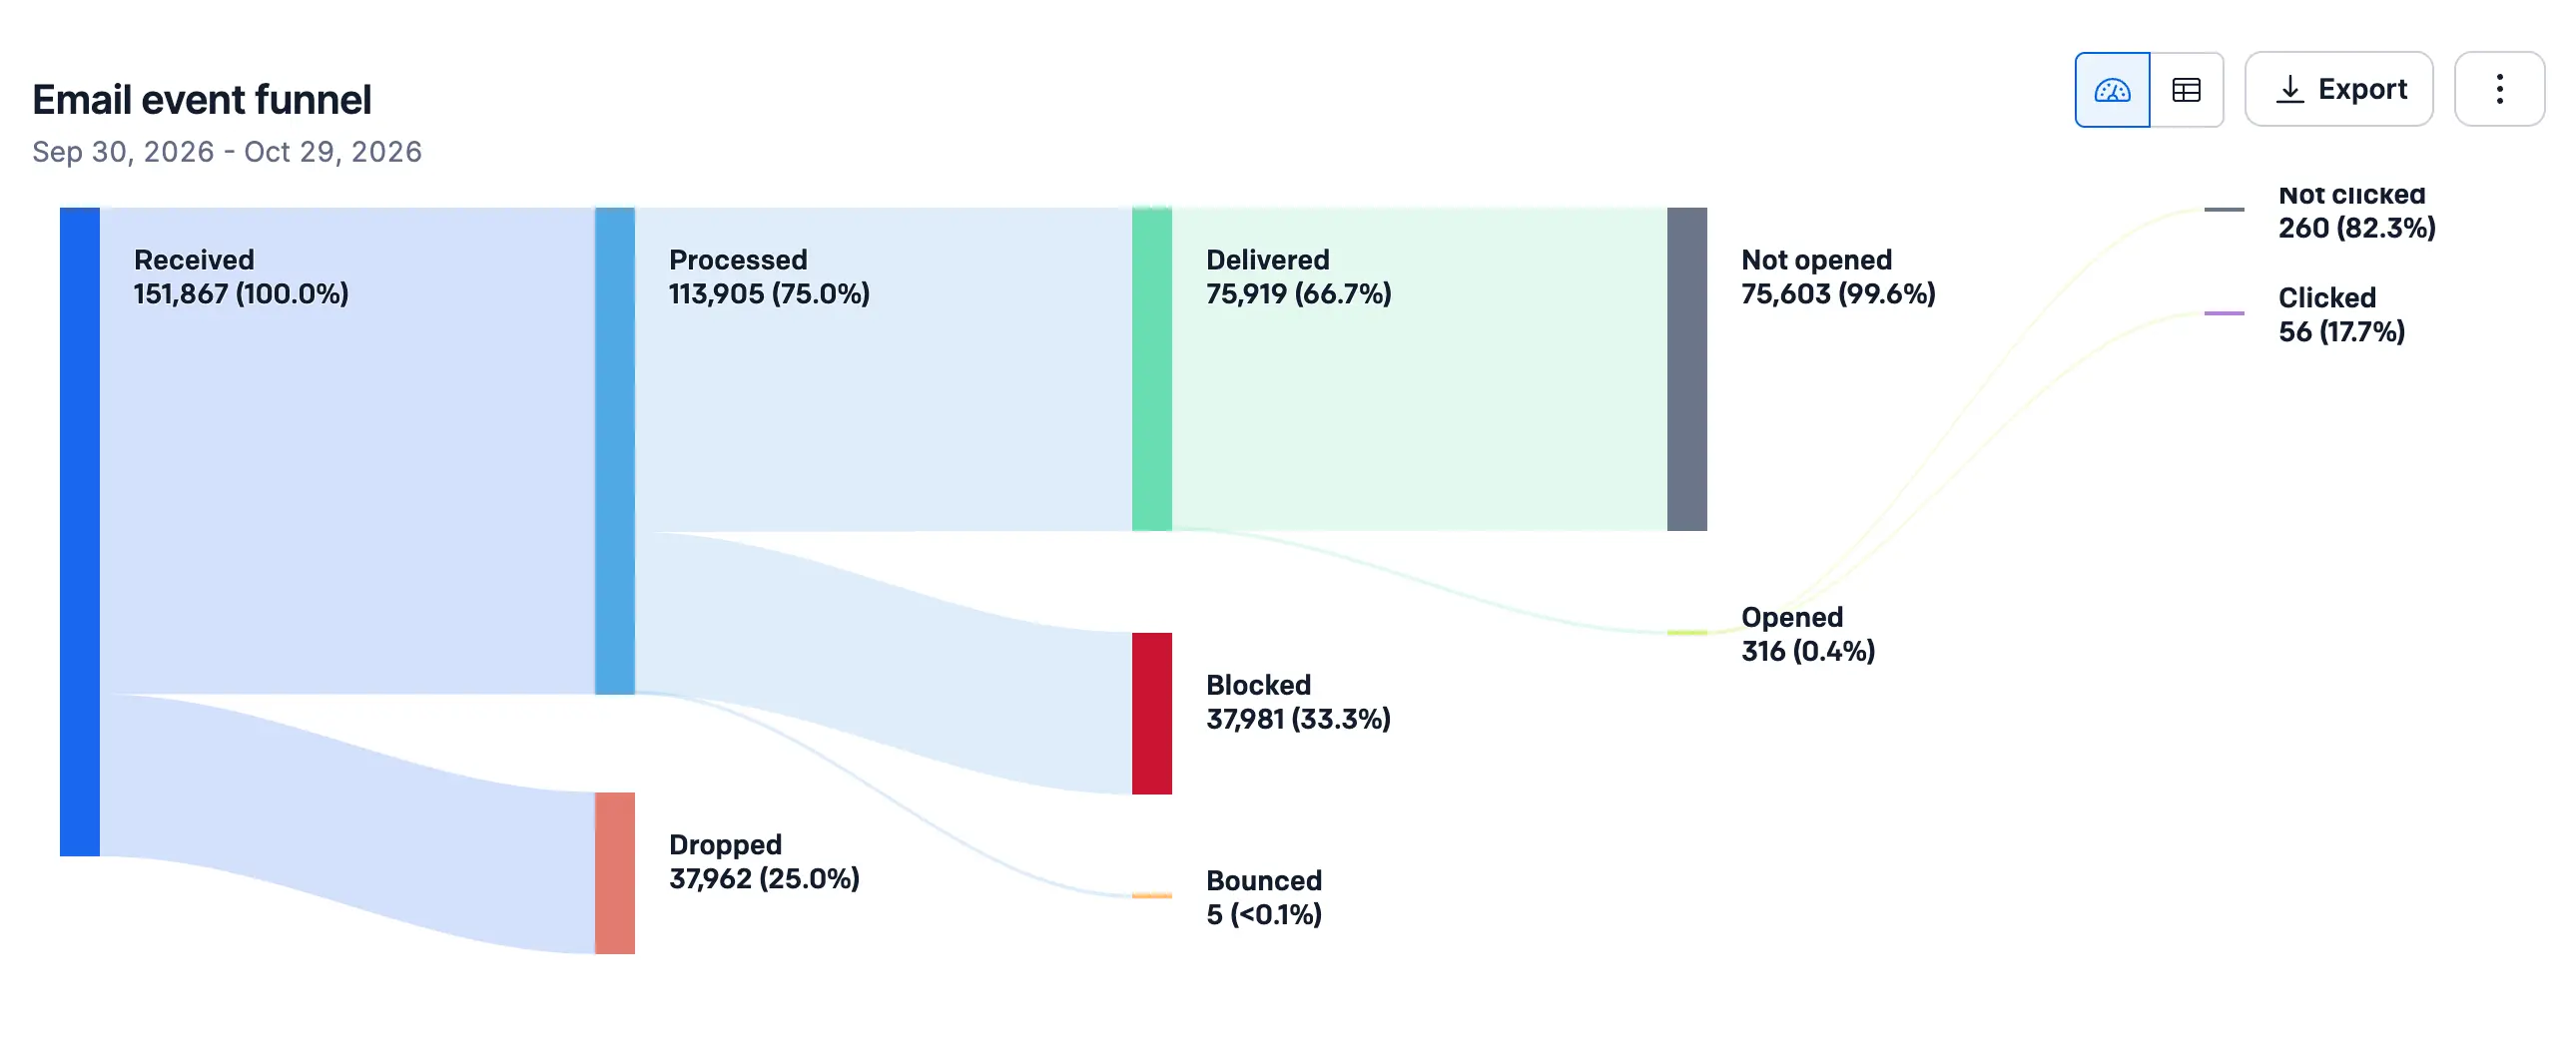
The funnel is useful for quickly identifying where volume is dropping off. If the gap between Processed and Delivered is large, check the Delivery Errors tab for bounce and block details.
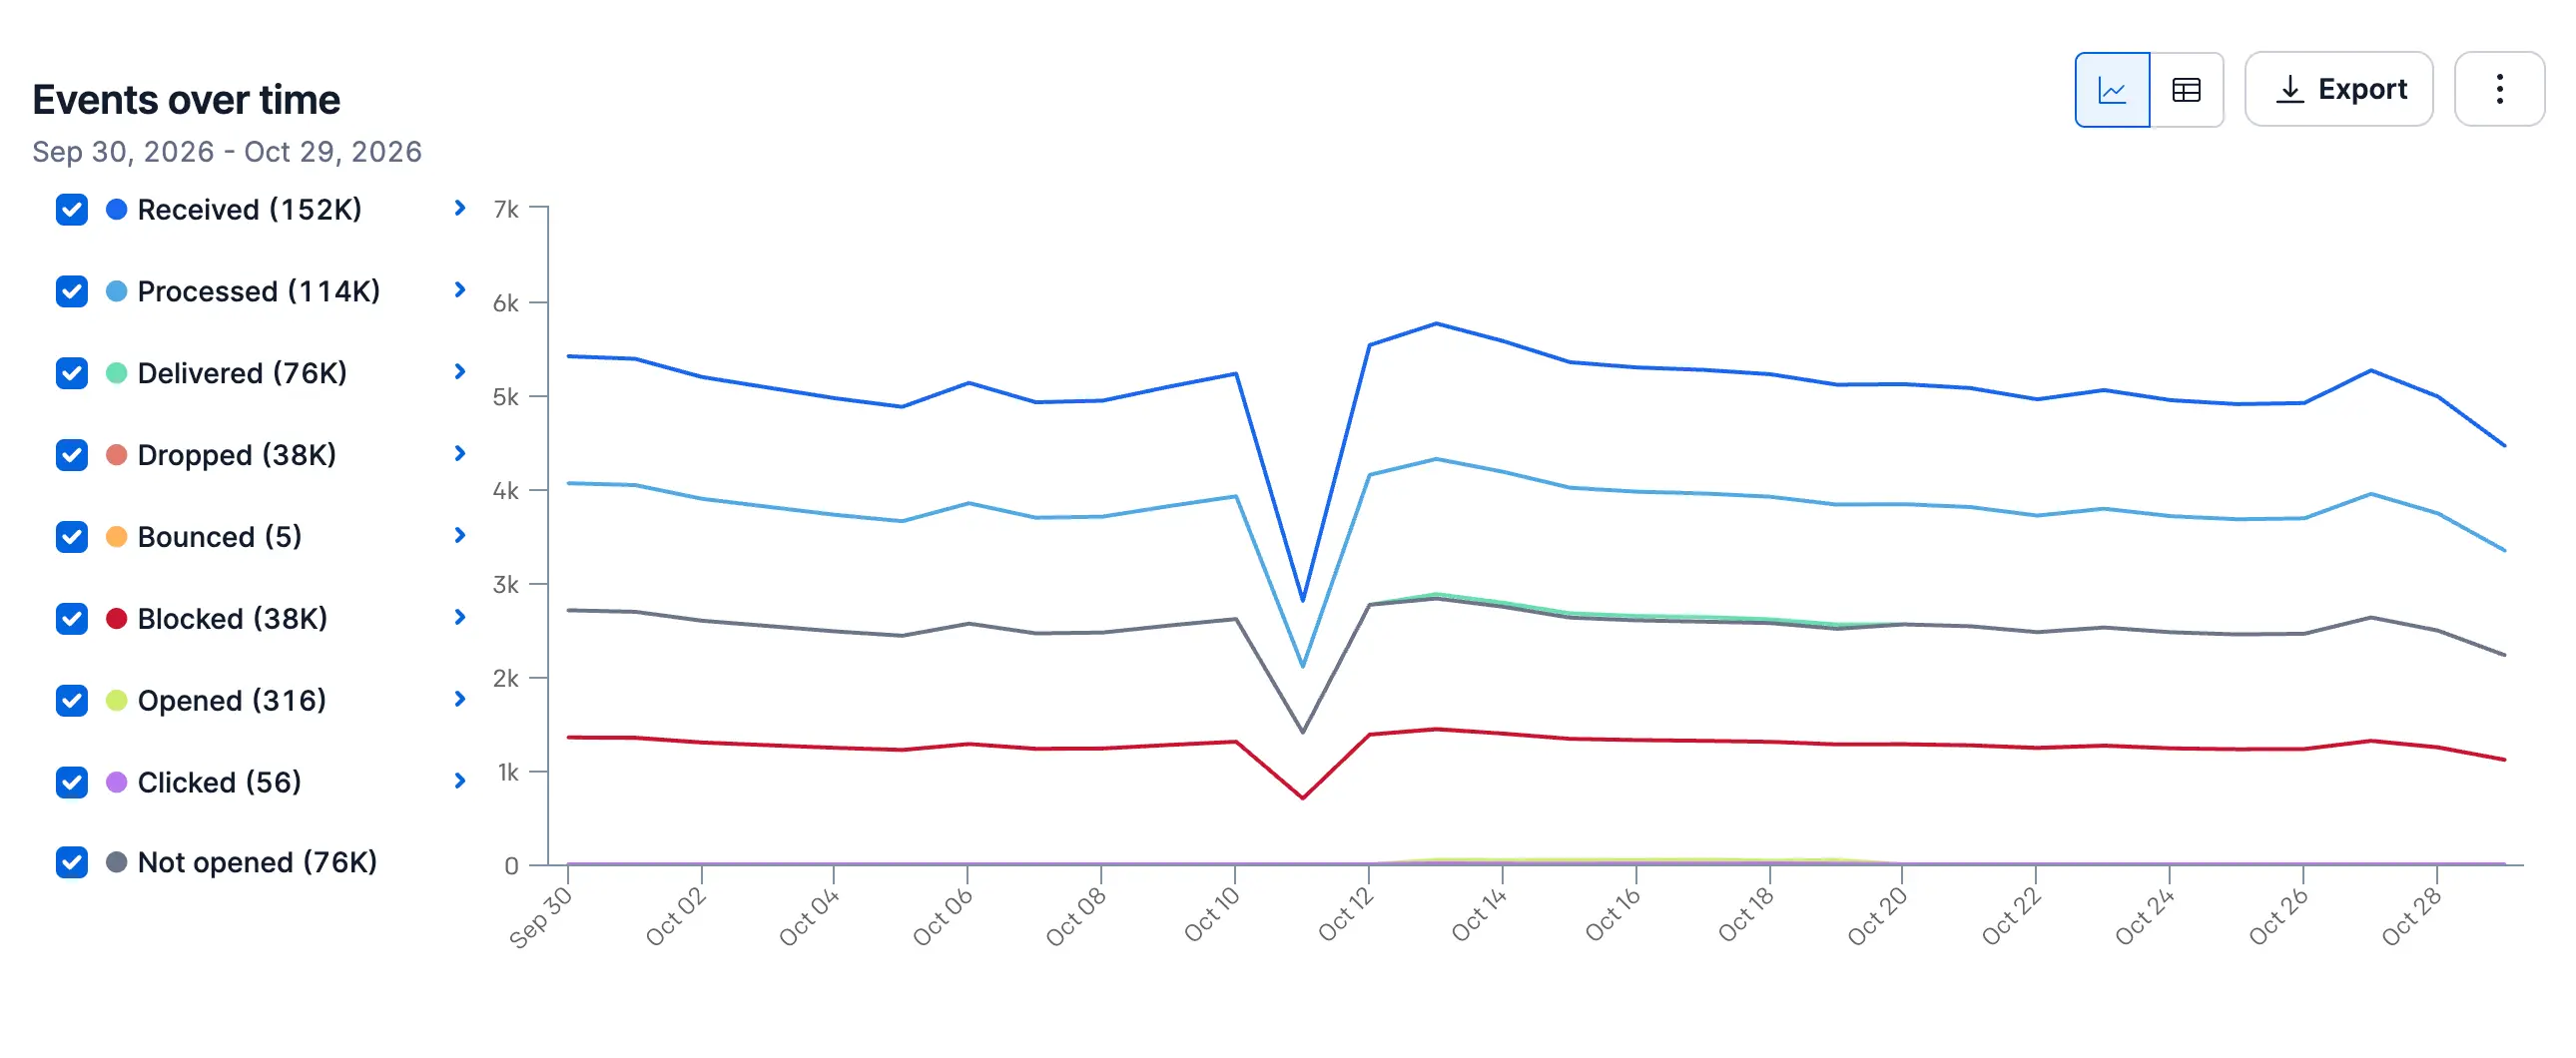
A line chart showing all event types over the selected date range. You can toggle individual event types on and off to focus on specific trends.
Events are grouped by the date the message was sent, not the date the event occurred. An open that happens several days after a send is counted on the send date. This keeps engagement rates aligned to the send that produced them.
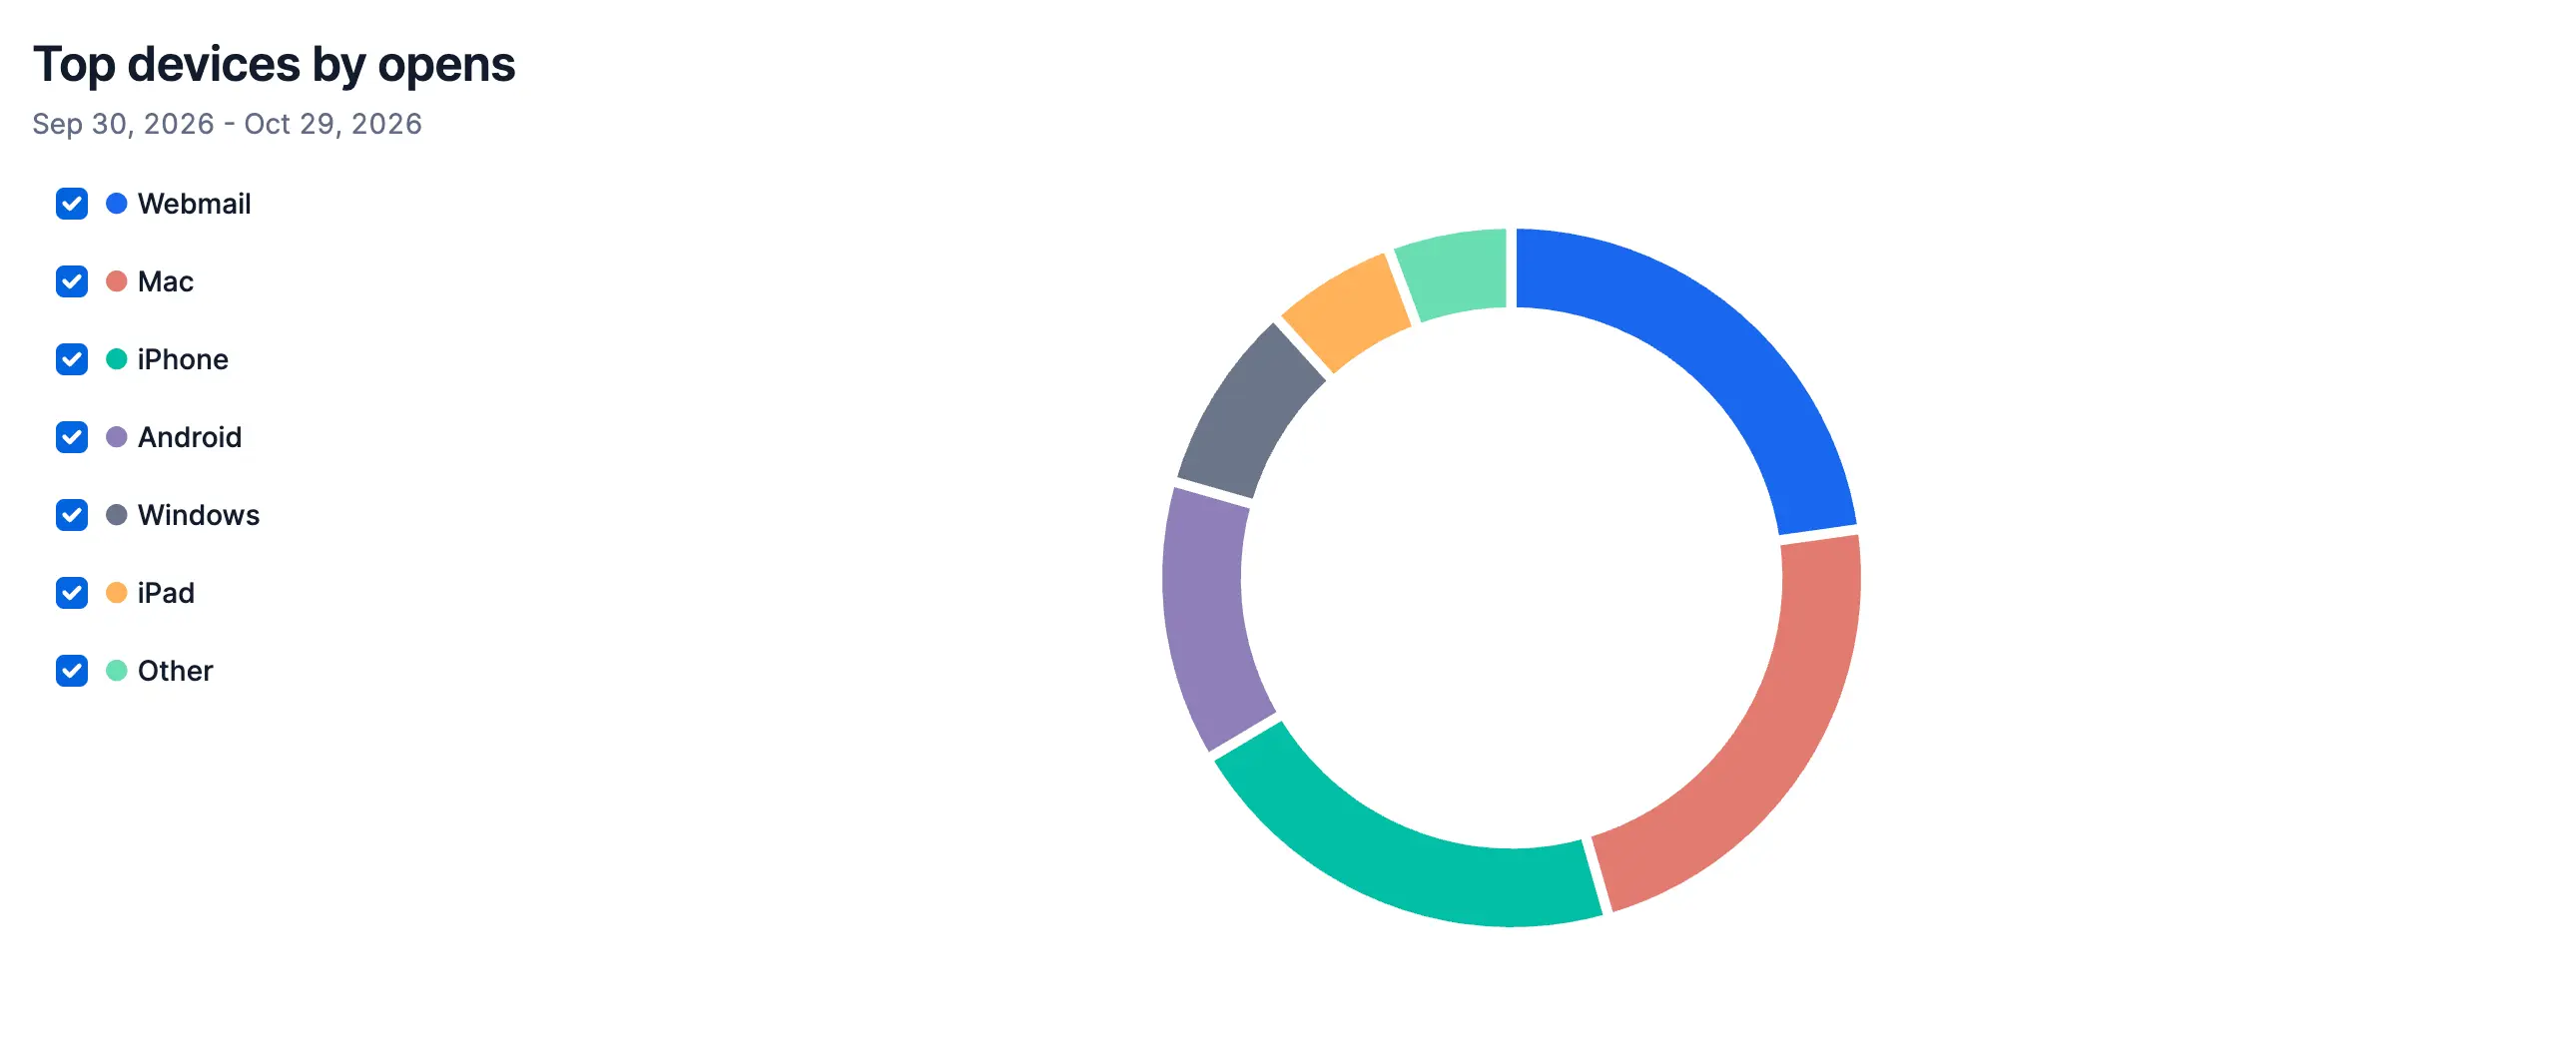
Top devices by opens shows which devices or operating systems recipients are using when they open email.
Visible by default:
- Date range
- Recipient domain
- Category
- Exclude machine opens
Additional filters, available from Add filters:
- Template
- Single send
For a full explanation of how filters work and which filters are available on each tab, see Filters and dimensions.