Build a Google Analytics Slack Bot with Python
Time to read:
March 21, 2018
Written by
This post is part of Twilio’s archive and may contain outdated information. We’re always building something new, so be sure to check out our latest posts for the most up-to-date insights.

Google Analytics is an incredibly powerful tool. All of the members of your team can see everything from which sources your web traffic comes from to what demographics frequent your site. There’s just one problem:
Nobody is willing to go to the Google Analytics site and look!
If these features aren’t used they may as well not exist. So, to give teammates easier access you can make a custom Slackbot to display Google Analytics.
What you’ll need to build the Analytics bot
- Python 3
- A custom Slackbot
- Make sure that your starterbot.py file looks just like this one. In this tutorial most of the changes we make will be to its
handle_command()function.
- A Google Analytics account connected to your site and permission on it to manage users. This is free until you exceed 10 million hits a month.
- The numpy, statsmodels, matplotlib, slackclient, apiclient, and google api dependencies:
Display pageviews for the week
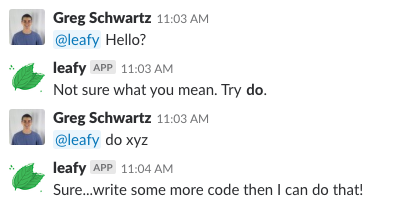
We are going to start with the bot from this prerequisite tutorial, so make sure that you followed this tutorial correctly before moving on. The bot should be able to respond to commands.
To connect the bot to Google Analytics we need to import some libraries at the top of starterbot.py. The rest of the code changes in this tutorial will take place in this file.
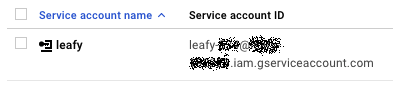
Next, define the necessary credentials to our Google Analytics account. Our bot only needs to read the information, so let’s set the scope to readOnly. We need to create a service account, which can be done by following the first section of Google’s Reporting API instructions. Make sure to save the Key File, we’ll be using it later.
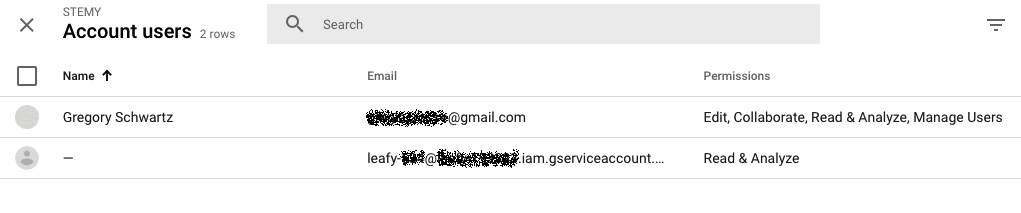
When you finish , notice the “email” given to your bot’s service accout.
This is important because because we have to give this account read access to the Google Analytics data under Google Analytics → Admin → User Management
Next get the View_ID through Google’s Account Explorer.
Now using the Key File and View_ID
We can use the variables defined above to initialize an analytics object.
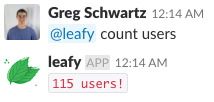
We can then use this analytics object in a new function, count(), to return the number of pageviews on your site over the last seven days.
This function contains an API call in accordance to Google Analytics Reporting API, which is set to “response.” From this batch report the ‘total’ value is returned.
To see what the original batch report looks like you can add
between the lines where response is set and answer is returned.
You can also see the original batch report through Google’s API Explorer. I already set up the request to match the one used in
count(), so all you have to do is add your VIEW_ID, authorize access to the Google Account associated with Google Analytics, and click “execute.” This explorer can also be a great way to look into Google Analytics features beyond this tutorial.
Finally, we call count() as a command by putting a new conditional in the handle_command() function.
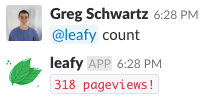
Now your bot can handle “@BOTNAME count”
You can test this by running starterbot.py the same way that you ran it in the prerequisite tutorial:
When it is running, message it in Slack “@BOTNAME count”
Display any metric for the week
This shows us the proof of concept that our bot is connected to Google Analytics, but we’ve barely scratched the surface of what we can do. So let’s change the command to display any metric for the week.
First change count() to handle different commands
Next we’ll change our condition in handle_command() to correctly call our new report. This is done by recognizing the metric in the command somewhere in the count condition before you call count().
Change the response line that calls the report
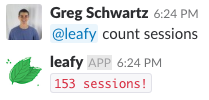
Now your bot can handle “@BOTNAME count [metric]”
We just went from access to one metric to access to over one hundred, greatly expanding the capabilities of the bot. You can find a full list of metrics offered by Google Analytics in the documentation. It can be overwhelming at first, so I found this reference on commonly used metrics a helpful starting point.
Display any metric for any time
The next step is to allow the command to display any metric for any time. After all, without the ability to look at data for previous weeks the command is significantly limited.
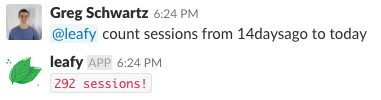
To do this we have to do is change count() to handle different dates.
Now your bot can handle “@BOTNAME count [metric]” with the optional specification of date (“from ___ to ____”)
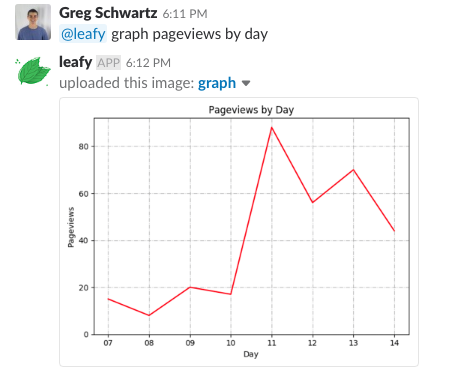
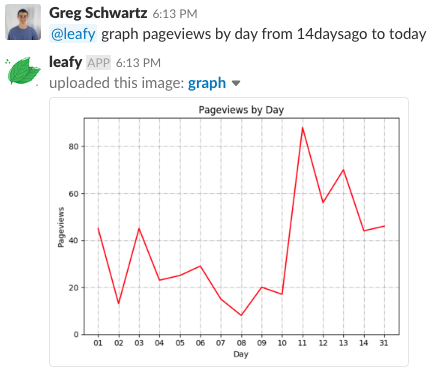
Display a graph
At this point the bot can handle single metric displays with reasonable flexibility. But returning a single number – regardless of how cool – isn’t going to captivate your coworkers for long. Let’s make a graph!
First we need to import another library, a math plot library. This is done at the top of the program along with the other libraries we imported.
Importing this library gave me trouble when I tried to run the bot on a virtual server. This was because by default matplotlib is configured to work with a graphical user interface. This solution to this is to use the Agg backend, which can be done by configuring matplotlib to use Agg before importing the rest of the files.
To graph with matplotlib we need lists for the X and Y coordinates, so lets create a new count function to do just that.
The first part will be similar to our old count function
Unlike in count(), we want to take the row of data rather than the total
This is important if you want your x-axis values arranged properly. This pulls the first dimension from the Google Analytics query to see what type of dimension is being used, if the dimension isn’t a digit then the rows get sorted from highest metric value to lowest metric value. This way graphs of pageviews per page will show the most viewed pages, while pageviews by date retains its order.
Lastly, add the values from answer to yArray
Now lets add a ‘graph’ condition in handle_command() to handle the new command.
In this condition we will call to get the data from
count_xy(), build a graph from it using the matplotlib library, and format the graph.
The first step is to parse through the command, similar to what we did in the count condition. But rather than just assigning the second word to “metric,” we have to assign multiple words at unknown lengths.
So in the ‘graph’ condition, first check if the command contains anything beyond @BOTNAME. We’ll add an alternate response that requests more information if it doesn’t.
Then we assign the metric, the same way that we did in count()
To accommodate for multiple command formats we can find the dimension through a keyword rather than its word number. This way it doesn’t matter if the command is “@BOTNAME graph pageview by day” or “@BOTNAME graph pageview and do it by day,” the dimension will be correctly identified.
To do this make a list of the words in the command by splitting on spaces, find the index of the keyword (in this case “by”), and setting the word that comes after “by” as the dimension.
Call count_xy() to get the data.
And check if the values for the dimensions are not digits.
If the dimension isn’t displayed in digits, such as pageTitle or source, matplotlib won’t name the ticks the way that we want, so we can do it manually by setting the x-axis ticks to be named after the values in our x array. We will put this in the not digit condition, because matplotlib can handle the ticks for digit arrays automatically.
First we create an array for the xticks, and fill it with the first six x values:
Then we set the x-labels to wrap instead overlap each other and set our other arrays to be the same size as xticks; if there is a different number of ticks than values we will get an error when we try to graph.
Next we do some stylistic changes. The matplotlib documentation is a good place to start to learn how to customize your graphs. This is how I did it.
We send the graph by saving it as a .png file and using Slack’s API command to upload files.
I also added two else statements to make the command easier to use.
Now your bot can handle “@BOTNAME graph [metric] by [dimension]” with the optional specification of date (“from ___ to ____”)
You can find a full list of dimensions offered by Google Analytics on the same page that we found metrics. It also includes links to an explanation of what each keyword means. I found this page very helpful for understanding the difference between metrics and dimensions.
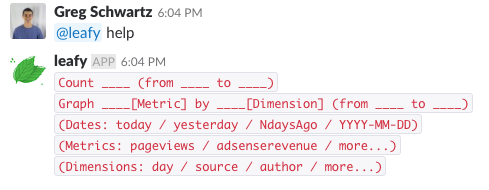
Display list of possible commands
So at this point your bot can handle a variety of commands. Let’s create another conditional for handle_command() in addition to ‘count’ and ‘graph’ to help users remember them.
So now “@BOTNAME help” will return the list of optional commands
We’re done! Check out the GitHub repo to see how the entire program should look when it’s all put together.
Next steps: usability and more commands for the Google Analytics Python Slack bot
The great thing about a custom bot is that there is tons of potential for more commands. To increase user-friendliness I recommend integrating a basic spell check on metrics or dimensions. This can be performed by listing potential options in a text file and running get_close_matches() from the difflib library:
I copied my text from metricList.txt and dimensionList.txt. They aren’t comprehensive, but do cover the terms that my team uses and then some.
Commands for statistical analysis are another good next step. The analysis can be done using statsmodels and count_xy(), making your bot even better at showing its users the key information that they need.
Other commands can explore options beyond Google Analytics integration. I recently added reminders to my bot by using the os, time, and datetime libraries; storing the reminder, its channel, and its time to send in a .txt file; and then comparing it to the current time periodically.
Have fun!
Greg Schwartz is the Director of Technology at STEMY, a student-led nonprofit dedicated to spreading stem education. He also manages the RedEye website and does school work in his free time. You can contact him at greg@stemy.org

Related Resources
Twilio Docs
From APIs to SDKs to sample apps
API reference documentation, SDKs, helper libraries, quickstarts, and tutorials for your language and platform.
Resource Center
The latest ebooks, industry reports, and webinars
Learn from customer engagement experts to improve your own communication.
Ahoy
Twilio's developer community hub
Best practices, code samples, and inspiration to build communications and digital engagement experiences.