Data Observability

Never wonder what happens to data in your CDP again

Execute campaigns confidently with transparency and accountability into the performance of the customer data pipeline.

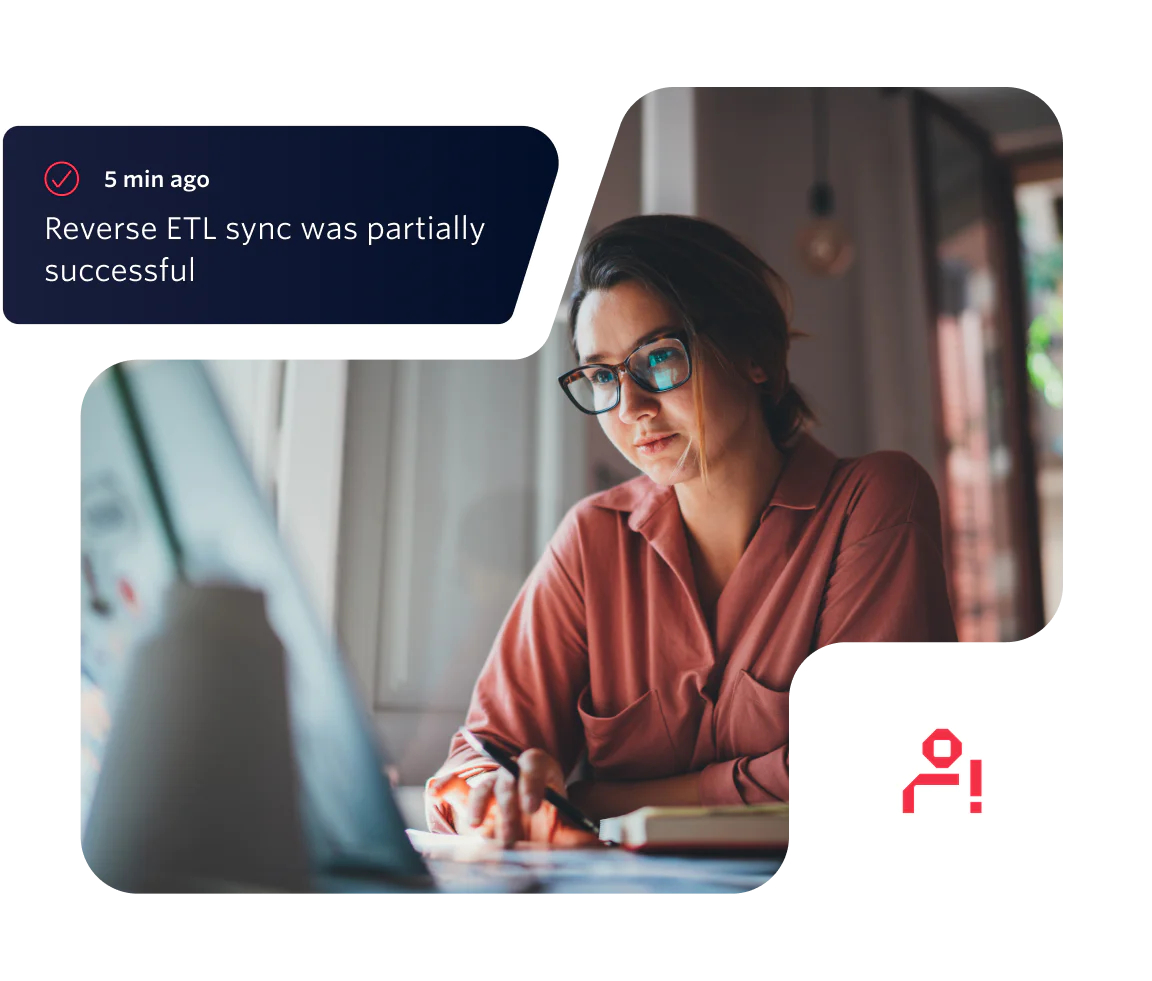
Woman wearing glasses and pink shirt working on a laptop with an ETL sync notification.

What you can do with data observability

Monitor, analyze, and troubleshoot events at every stage of data delivery.

  • Bar graph with arrow showing an increase
    Complete visibility into the performance of your CDP

    Ensure that the data that enters Segment successfully reaches the intended destination with a comprehensive, transparent, and debuggable event delivery pipeline.

  • Spreadsheet document
    Prevent missing data from tanking campaign performance

    Proactively monitor the pipeline to quash abnormalities before they escalate into bigger problems, like delayed campaign launches or wasted ad spend.

  • Browser with blocks
    Understand the hows and whys of event outcomes

    Get to the bottom of data delivery issues quickly with complete logs for events. 


  • Database
    Empower business teams with access to self-service data

    Give the entire organization visibility into what’s happening to customer data at every point in the data journey—not just engineers and data teams.

  • A document with a checkmark
    Embed trust in your data

    Building a reliable pipeline that functions as intended is essential for trusting the data you use to fuel critical AI and personalization use cases.

How it works

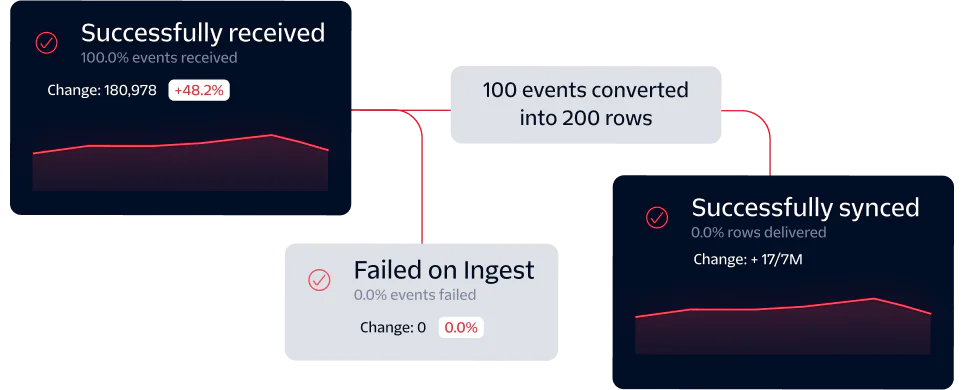
Diagram showing event processing flow with stats for successfully received, failed on ingest, and successfully synced.

Step 1

Inspect what happens to events at every stage of delivery

Track each stage of event delivery from the time Segment ingests an event, to Source and Destination Filters, and finally whether event delivery was ultimately successful or not. Ensure that data is reliably delivered to downstream tools so that every team can trust the data they activate.
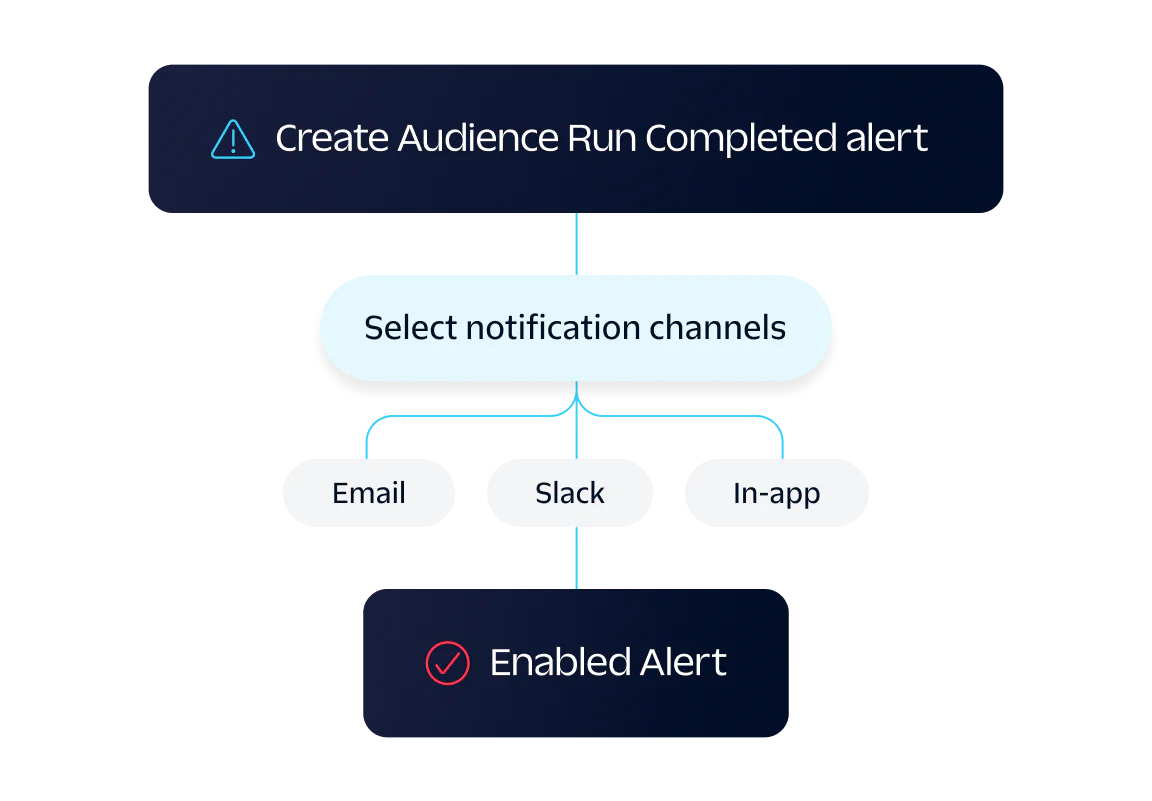

Diagram showing event processing flow with stats for successfully received, failed on ingest, and successfully synced.

Step 2

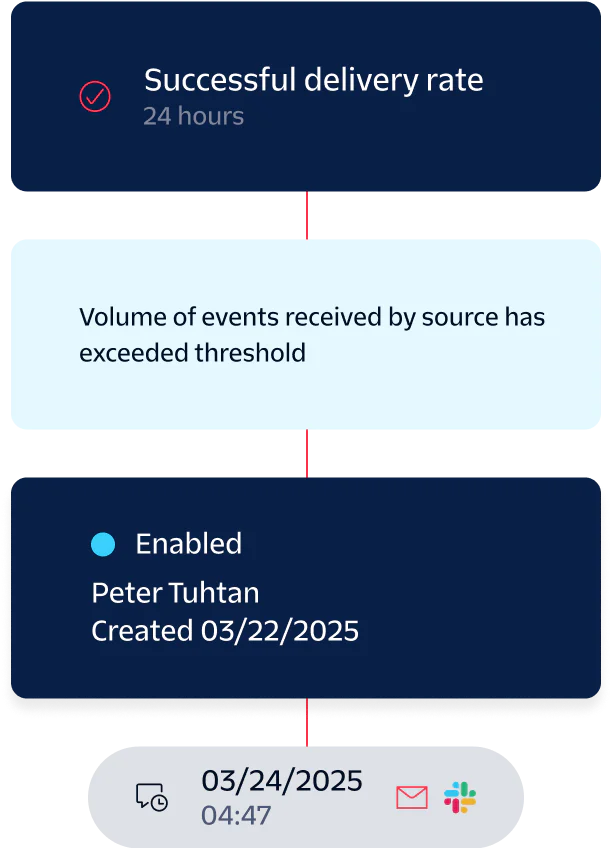
Monitor the performance of the pipeline with dynamic alerts

Configure customizable alerts that’ll notify the appropriate parties on your preferred notification channels before anomalies have the chance to undermine the performance of the data pipeline. Plus - evaluate every alert across your entire workspace all in one central, convenient dashboard. 
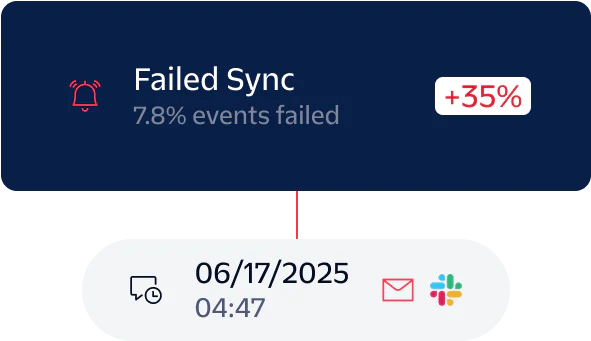

Diagram showing event processing flow with stats for successfully received, failed on ingest, and successfully synced.

Step 3

Troubleshoot quickly with comprehensive event logs

Analyze event outcomes on a granular level with comprehensive logs that pinpoint exactly what happened to your events and why. No more spending hours trying to figure out why events were dropped or discarded.

Get started with Data Observability

Data Observability supports features across the entire Customer Data Platform, including all Destination types, Reverse ETL, and Twilio Engage. To learn more about the robust Observability offerings available for each feature, check out our documentation. 
A notification flow showing successful delivery rate, volume threshold exceeded, and an enabled event on 03/24/2025.