Automatic Instrumentation of Containerized .NET Applications With OpenTelemetry
Time to read: 12 minutes
February 21, 2023
Written by
Reviewed by

If you're running containerized .NET applications without telemetry instrumentation, adding it later can be difficult and time-consuming. However, OpenTelemetry provides an automated way to add instrumentation without the need for code changes or manual configuration. In this post, I will guide you through the steps to automatically instrument your existing containerized .NET applications with OpenTelemetry.
OpenTelemetry overview
OpenTelemetry is a modern and flexible open-source observability framework for cloud-native and microservice applications. It provides a set of APIs, libraries, and tools for collecting, processing, and exporting metrics, traces, and logs from an application in a consistent and standardized manner. The goal of OpenTelemetry is to simplify the process of instrumenting applications, reduce vendor lock-in, and provide a unified way of collecting observability data that can be used by multiple monitoring and logging systems.
One of the key benefits of OpenTelemetry is that it enables developers to easily collect metrics, traces, and logs from their applications and send them to multiple backend systems. This allows developers to monitor their applications in real time and gain insights into their performance and behavior. Additionally, OpenTelemetry provides libraries and tools for instrumenting applications and collecting observability data, so developers can concentrate on writing their applications rather than worrying about collecting and processing observability data.
OpenTelemetry is designed to be highly scalable and efficient, making it suitable for use in large-scale, high-performance applications. It supports a wide range of programming languages, including Go, Java, C#, Python, and JavaScript, and is compatible with popular monitoring and logging systems, such as Jaeger, Prometheus, Grafana, and Elasticsearch.
During execution, applications emit information that could be used to capture specific events or conditions, such as resource usage, errors, or performance degradation. In OpenTelemetry, such information is known as signals. Currently, OpenTelemetry defines the following signals:
- Traces: Traces are structured records that represent the end-to-end processing of a request as it traverses the participating microservices. A trace consists of several spans, each representing the execution in one microservice along the request path.
- Metrics: A metric is a numerical signal sampled periodically. Each metric contains a name, a value, and additional metadata.
- Logs: A log is a textual record that captures an event. An event represents anything of interest in the application code. Logs are timestamped and may contain structured text and metadata.
Automatic instrumentation in OpenTelemetry
Auto-instrumentation is a feature in OpenTelemetry that allows developers to easily monitor the performance and behavior of their applications without having to manually instrument the code with the OpenTelemetry SDKs. It reduces the effort and time required to add monitoring to an application without having application source code, making it easier for developers to focus on delivering high-quality software.
Auto-instrumentation in OpenTelemetry works by automatically instrumenting popular libraries and frameworks, such as ASP.NET Core, Node.js, and Java. The instrumentation libraries collect data about the performance and behavior of the application, including request duration, database queries, cache hits and misses, and more. This data is then exported to observability backends, such as Prometheus, Loki, and Jaeger where it can be analyzed and visualized to help identify performance bottlenecks and other issues.
In addition to reducing the effort required to add monitoring to an application, auto-instrumentation can also provide more accurate and detailed data than manual instrumentation. This is because the instrumentation libraries are specifically designed to collect data from the libraries and frameworks they are instrumenting, and they have a deep understanding of the underlying code and data structures. This enables the instrumentation to collect detailed data about the performance and behavior of the application.
Auto-instrumentation is not a replacement for manual instrumentation. For example, if you want to add custom data to signals, such as the user's ID, you must use manual instrumentation. By combining the two approaches, we can ensure that all applications in an environment are observable.
Automatic instrumentation in .NET
The OpenTelemetry auto-instrumentation feature is made of two components:
- Instrumentation libraries: Applications use several popular frameworks and libraries to improve efficiency of the development process. For example, some of the popular frameworks and libraries used in .NET applications are ASP.NET Core, GraphQL, and Microsoft.Data.SqlClient, while Akka, Hibernate, and JDBC are some of the common frameworks used in Java applications. The OpenTelemetry community has instrumented many such libraries using the OpenTelemetry API. The complete list of frameworks and libraries supported by instrumentation libraries in .NET is available in the .NET instrumentation project.
- Agent or Runner: It is a tool to automatically configure OpenTelemetry and load the instrumentation libraries that can be used to generate telemetry.
In this article you will focus only on instrumenting .NET applications, however, apart from .NET, the auto-instrumentation feature is available for many programming languages such as Java, Python, and more. You can refer to the relevant guides for auto-instrumentation instructions if your distributed application is polyglot in nature. The .NET implementation of auto-instrumentation for OpenTelemetry leverages CLR (Common Language Runtime) Profiler APIs to inject the OpenTelemetry .NET SDK and selected instrumentations to the application code. In a nutshell, here is how auto-instrumentation works. The OpenTelemetry CLR Profiler receives notifications from CLR on various application execution events, such as assembly loading and unloading. For libraries, such as GraphQL, that don’t have well-defined hooks or callbacks to allow the collection of telemetry, the profiler uses bytecode instrumentation (also known as monkey patching technique) to add a bit of telemetry generation logic to the beginning and end of the library methods. The profiler responds to the ModuleLoaded CLR event by requesting the JIT compiler to recompile the new IL. For libraries and frameworks that support API hooks or callbacks, such as ASP.NET Core, and HttpClient, the profiler reacts to CLR’s JIT compiler event to initialize the source instrumentation. Ultimately, through either of the approaches, auto-instrumentation makes the supported libraries and frameworks emit telemetry signals.
If you would like to learn more about auto-instrumentation architecture and various examples of instrumentation scenarios, I encourage you to visit the OpenTelemetry .NET auto-instrumentation GitHub repository.
I want to highlight one more important component of OpenTelemetry before we proceed to our demo: the collector.
OpenTelemetry Collector
OpenTelemetry collector is an essential component of the OpenTelemetry ecosystem. It is responsible for receiving, processing, and aggregating telemetry data from various sources and sending it to the backend for storage and analysis. It supports multiple data inputs, such as gRPC, HTTP, and Thrift, and can be deployed as a standalone service or integrated into existing infrastructure. The collector is designed to be scalable, highly available, and extensible, enabling organizations to easily add custom instrumentation and data processing capabilities to meet their unique monitoring needs. Additionally, it has built-in support for various data types, including traces, metrics, and logs, and can be used in combination with other OpenTelemetry components, such as the SDK, to deliver comprehensive observability across an entire system.
The diagram below shows how a collector can be deployed as a gateway for receiving telemetry from all microservices in an environment and transmitting the data to different backends. The gateway model is the most common deployment model for the collector. However, the collector can also be deployed as a sidecar, which shares the process space with the application, or as an agent, which runs on a virtual machine to capture system-level telemetry.
You can read more about the collector, and its features in the collector guide on the OpenTelemetry website.
Two other components you will use in this demonstration are Prometheus and Jaeger. Prometheus is a popular open-source project for monitoring and aggregating metrics from services. It uses a time-series database for recording metrics and enables us to query the database using the metric’s name. It supports scraping/pulling metrics from an HTTP endpoint on the source. Jaeger is a popular open-source software that is used for tracing transactions between distributed services. I encourage you to learn more about the projects by visiting their websites.
You're ready to begin the demo, so let's start by preparing our systems.
Prerequisites
You will use the following tools to build the sample application:
- Visual Studio, VS Code, or Jetbrains Rider as the IDE.
- .NET 7 (or newer)
- Docker Engine (you can install the engine using Docker Desktop (Windows, macOS, and Linux), Colima (macOS and Linux), or manually on any OS.
- A basic understanding of Prometheus and Jaeger.
Sample: Monotonic Counter app
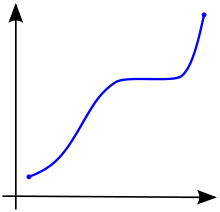
A monotonic function in mathematics produces output that either never decreases or never increases. A few common examples of monotonic counters are the counters that count the total number of website visitors or the total uptime of a server.
A monotonic function whose output value never decreases is illustrated in the following graph:
With a Redis cache and two REST APIs, you will create a monotonically non-decreasing counter as follows:
Here is an overview of the endpoints that the APIs will implement and their purpose:
| Application | Endpoint | Purpose |
|---|---|---|
| Monotonic counter | POST: /increment/{counter}/{delta} | Creates a new counter named `{counter}` and increments its value by `{delta}`. If the counter exists, its value is increased by `{delta}`. |
| Monotonic counter | GET: /{counter} | Returns the counter and its current value |
| Counter store | POST: increment/{counter}/{delta} | Invoked by the monotonic counter application to create a new counter named `{counter}` and increments its value by `{delta}`. If the counter exists, its value is increased by `{delta}`. It throws an error if `{delta}` is a negative value. |
| Counter store | GET: /{counter} | Returns the counter and its current value |
The Redis cache is used by the counter store API to store the state of the counter.
In this tutorial, I will walk you through the process of building this application. For your convenience, the reference implementation of this application is also available on GitHub.
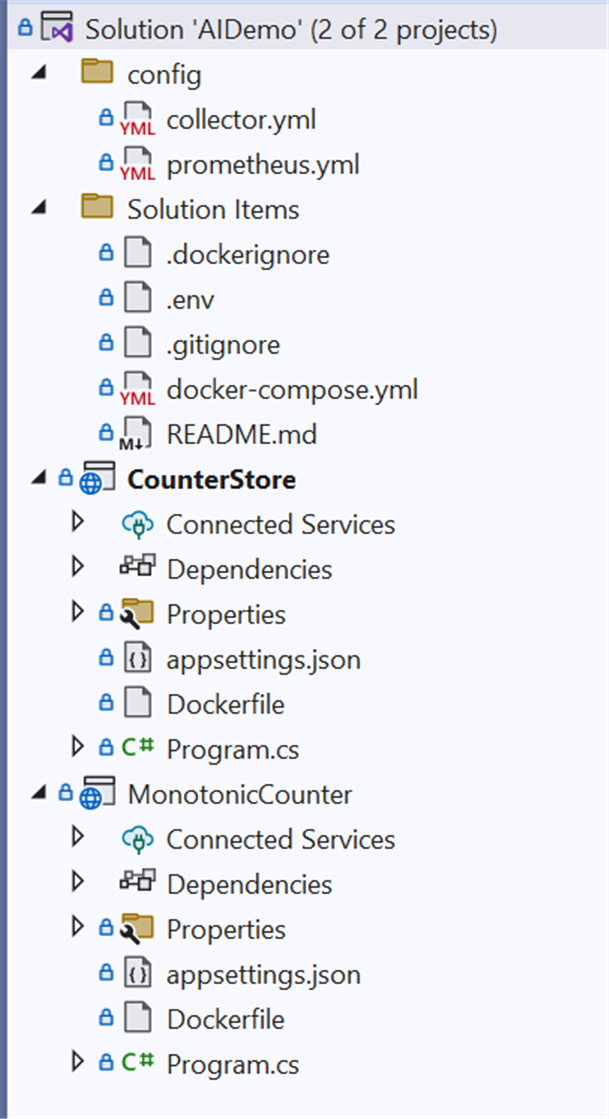
Please ensure that the following directory structure is maintained as you develop the projects:
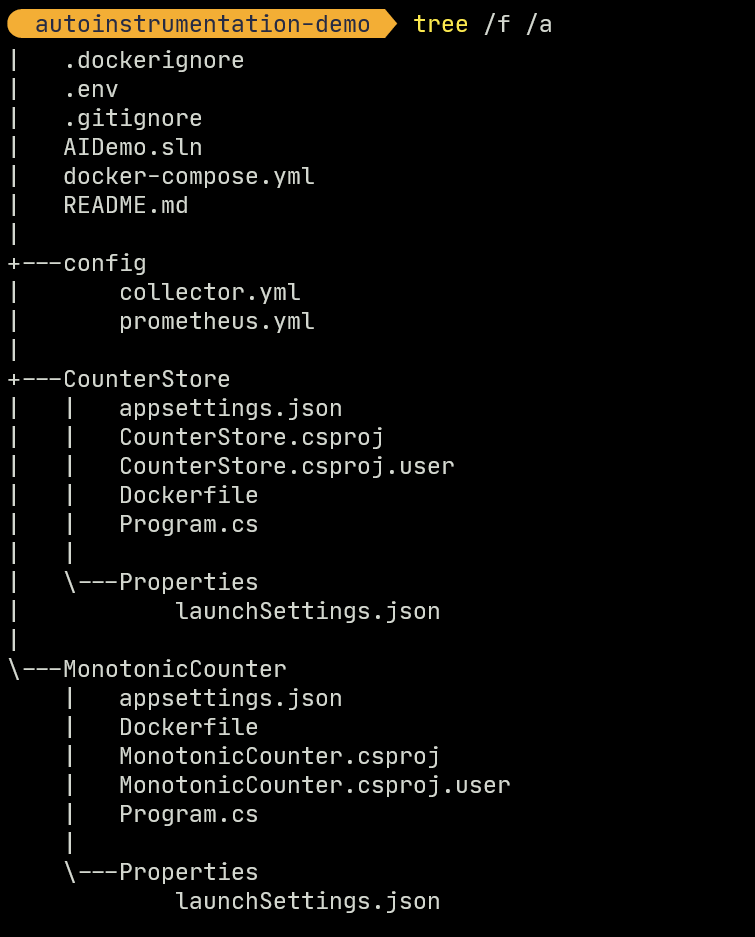
Visual Studio Solution Explorer view of the solution and supporting artifacts is shown below. Please ensure you follow the same hierarchy while developing the artifacts.
Use your preferred IDE and the Microsoft guide to create a new solution file named AIDemo and within it a Minimal API project named MonotonicCounter with ASP.NET Core. You will implement the two endpoints of this API and also add a counter that counts the number of requests received by each endpoint. In .NET, meters are available in the System.Diagnostics namespace and are available by default in applications targeting .NET 6+. You can read more about meters on the Microsoft documentation website.
Make sure the following NuGet packages are installed:
Now replace the contents of the MonotonicCounter/Program.cs file with the following code segment:
You now have the two endpoints that your API can use to interact with the Counter store API. Your next step will be to create the API for the Counter store.
Create another minimal API project in the AIDemo solution, name this one CounterStore, and this time install the following NuGet package to it to enable the application to operate the Redis cache:
Replace the boilerplate code in the CounterStore/Program.cs file with the following to implement the required endpoints and behavior:
In the next step, you will write Dockerfiles to containerize the apps. This tutorial on the Microsoft documentation website shows how to containerize a basic .NET application. In this case, you will update the Dockerfile instructions to install the OpenTelemetry auto-instrumentation binaries to the application. You can use environment variables to manage the logs, traces, and metrics emitted by your application. The OpenTelemetry .NET instrumentation guide lists the environment variables and the instrumentation behaviors they control.
A helper shell script is provided by OpenTelemetry to make it easier to install dependencies and patch the application. The shell script uses environment variables as parameters. A detailed explanation of the script and the supported parameters are available in the same instrumentation guide on GitHub.
Add a Dockerfile to the MonotonicCounter project and update its content as follows:
MonotonicCounter/Dockerfile:
When the instructions in the Dockerfile are executed, the OpenTelemetry helper script will patch your application and install the dependencies. You now need to tell .NET runtime to use the OpenTelemetry auto-instrumentation as the hosting startup implementation to apply OpenTelemetry enhancements to the app at startup.
Custom hosting startup behavior in .NET is controlled by environment variables, which you can add to the application at runtime through Docker Compose. You will create the Docker Compose specification later, but for now, create the following file named .env in the root directory with the following environment variable specifications:
Like before, create a Dockerfile with the following content in the CounterStore application:
CounterStore/Dockerfile:
Now that both of your applications have been containerized, you are ready to write the Docker compose specification for the environment, which includes Prometheus and Jaeger for ingesting metrics and distributed traces from the applications, as well as the OpenTelemetry collector to ingest metrics, traces, and logs from the application.
In the solution directory, create a file named docker-compose.yml and add the following specification code to it:
A few points to note in the specification are as follows:
- You added the common environment variables to the applications using the
env_fileparameter. - You added the required environment variables to the applications that control the behavior of auto-instrumentation such as the endpoint of the collector where OTLP data should be sent.
- You added
Examples.MonotonicCounter as a metric source so that it can be recorded by the OpenTelemetry instrumentation. - Both the Prometheus and OpenTelemetry Collector need static configuration files. Prometheus needs a config file to identify the endpoint it should scrape regularly. OpenTelemetry Collector needs a config file that outlines the pipeline for processing trace, metric, and log signals. I'll cover the steps to define both files in the next section.
Configure Prometheus
In the root directory, create a folder named config and add a file named prometheus.yml to it. Then, edit the file to add the following specifications to it:
The specification will instruct Prometheus to scrape the OpenTelemetry collector every 5 seconds to ingest the metrics generated by the application.
Configure the OpenTelemetry collector
In the config folder, create another file named collector.yml. Then, add the following specification to the file:
The specification details how the telemetry signals are received and exported. The OpenTelemetry collector is a powerful tool that can also process the signals. The OpenTelemetry collector guide can help you understand the use cases of this versatile tool.
Demo
To launch the environment, make sure Docker is running and execute the following command:
Wait for Docker compose to launch all the containers. Once the containers are ready, you can navigate to the Swagger endpoint of the monotonic counter application at http://localhost:8080/swagger/.
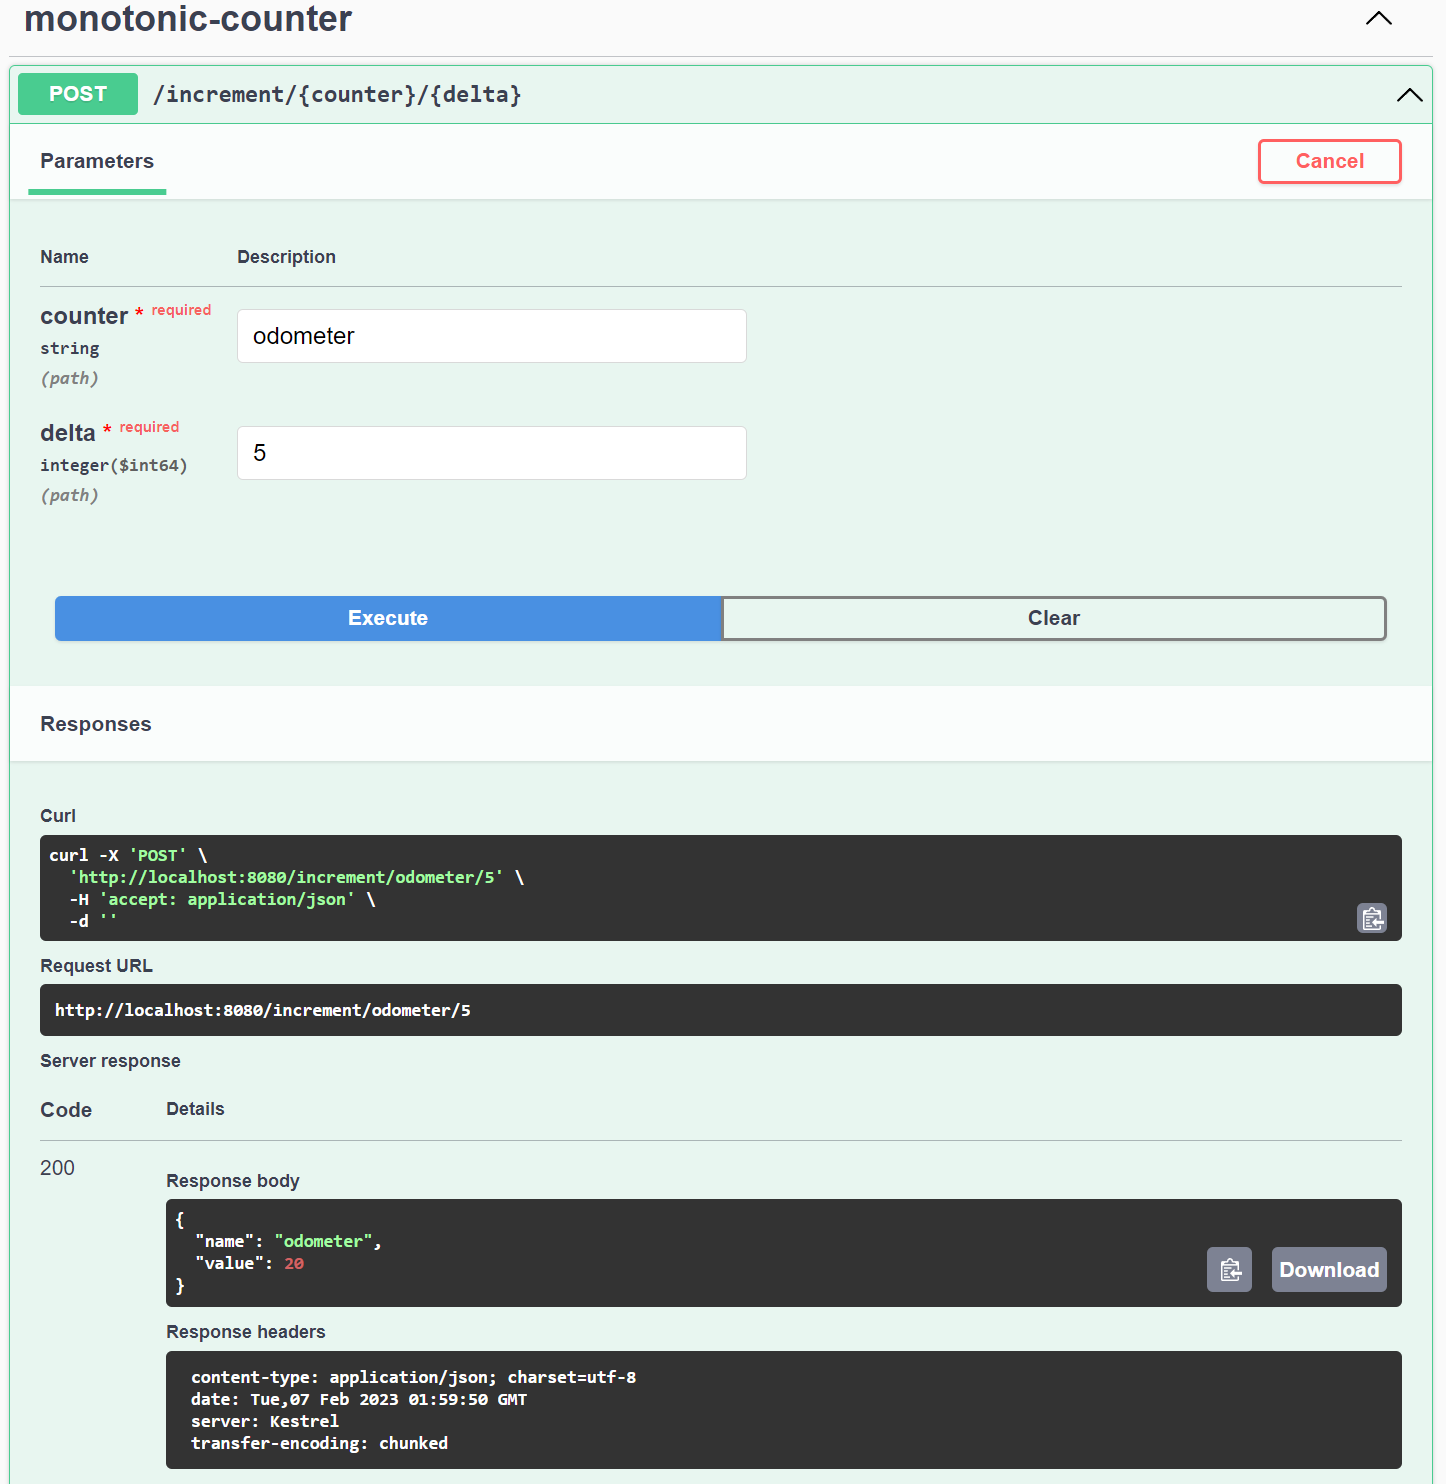
You can try incrementing the counter values a few times using the Swagger interface as follows:
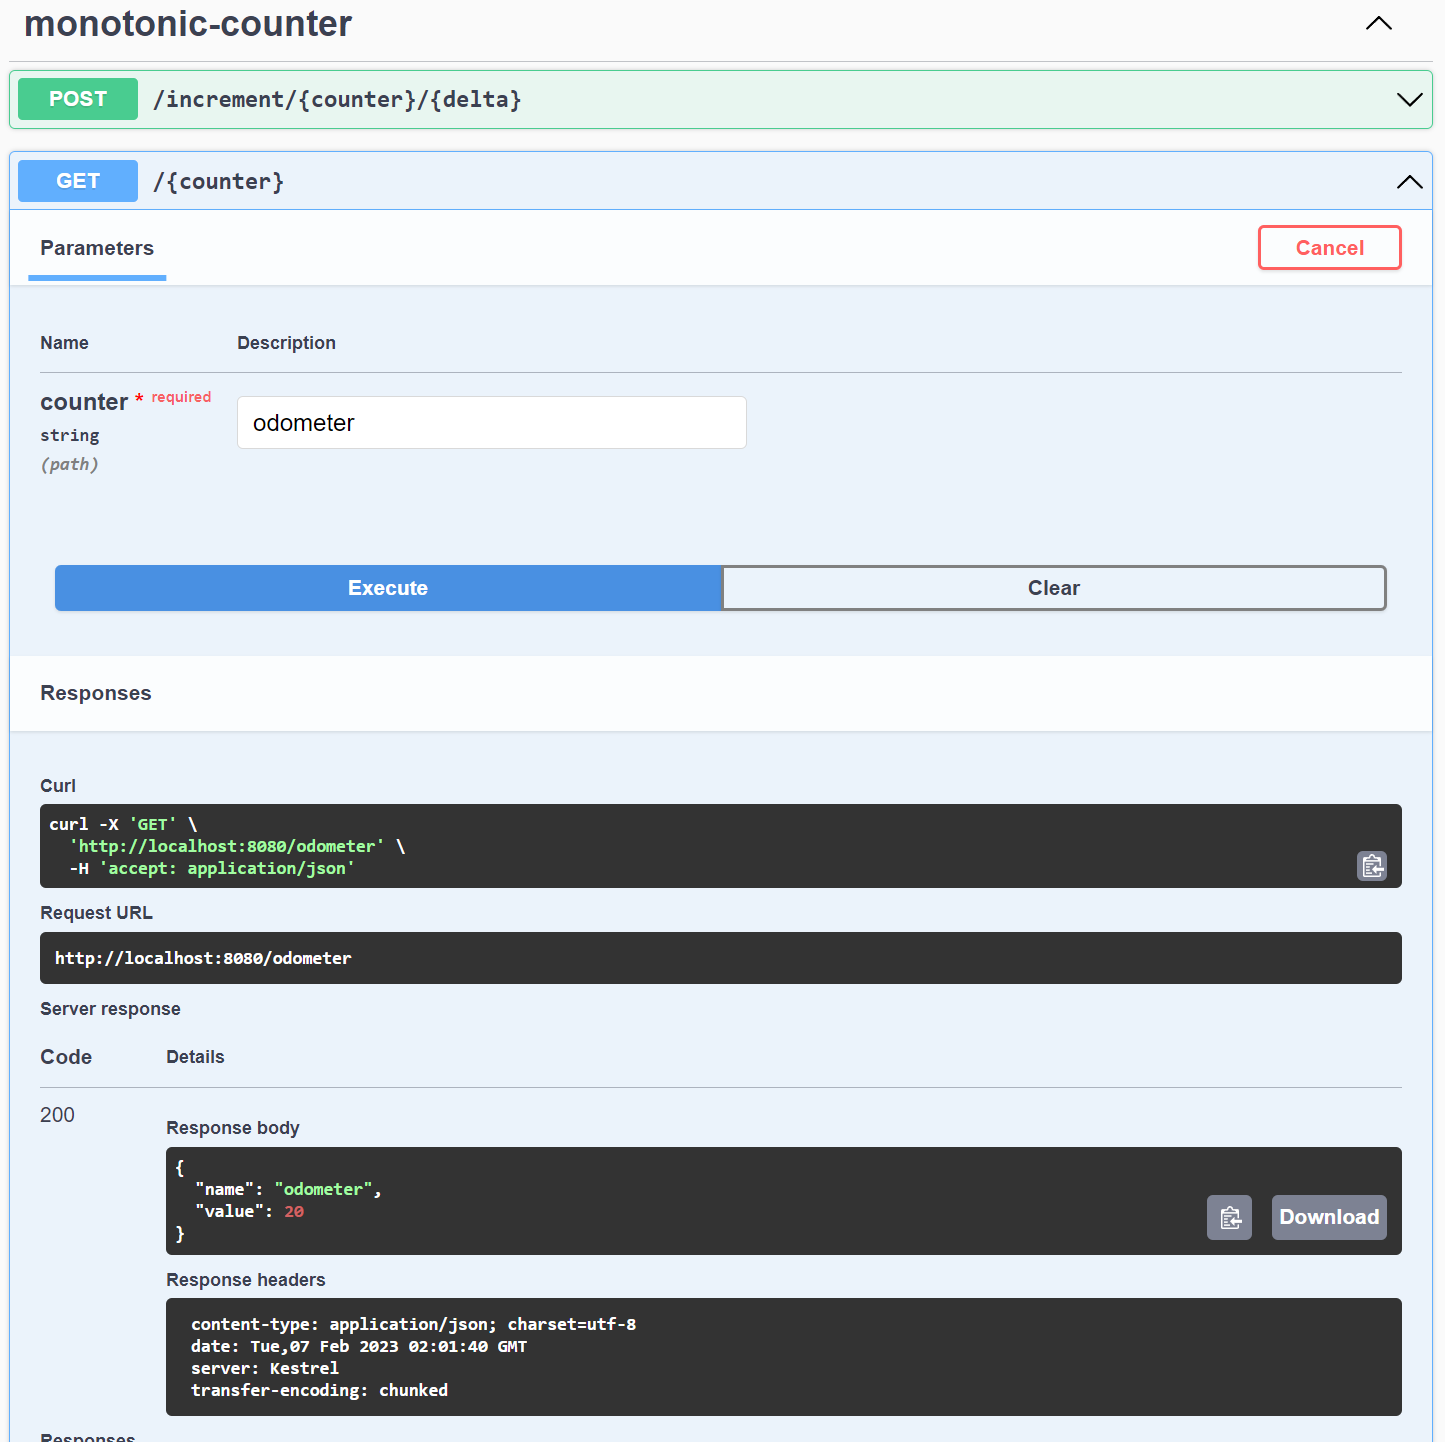
Use the GET: /counter operation to fetch the current state of any counter that you have created as follows:
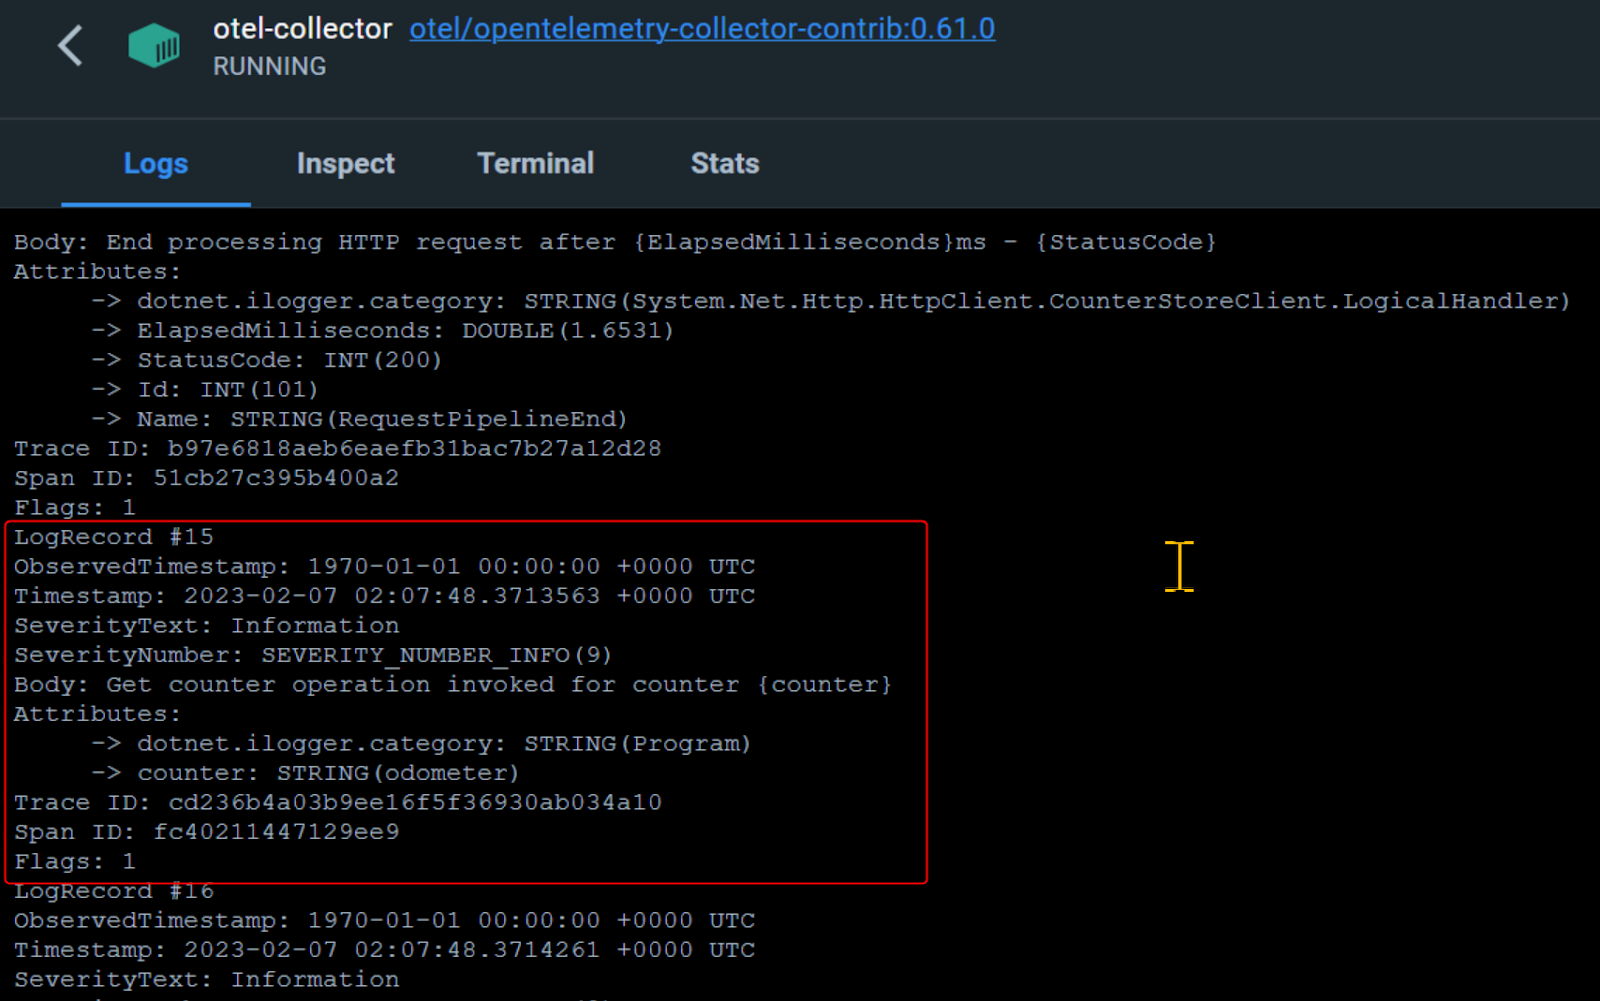
Your application has likely generated enough telemetry that you can now begin investigating, starting with Logs. The OpenTelemetry collector pipeline for logs exports the logs to the collector console. You can inspect the logs produced by the OpenTelemetry collector container by executing the following command in another terminal:
Alternatively, you can click on the otel-collector container in the Docker Desktop console and navigate to the Logs tab to view the logs as follows:
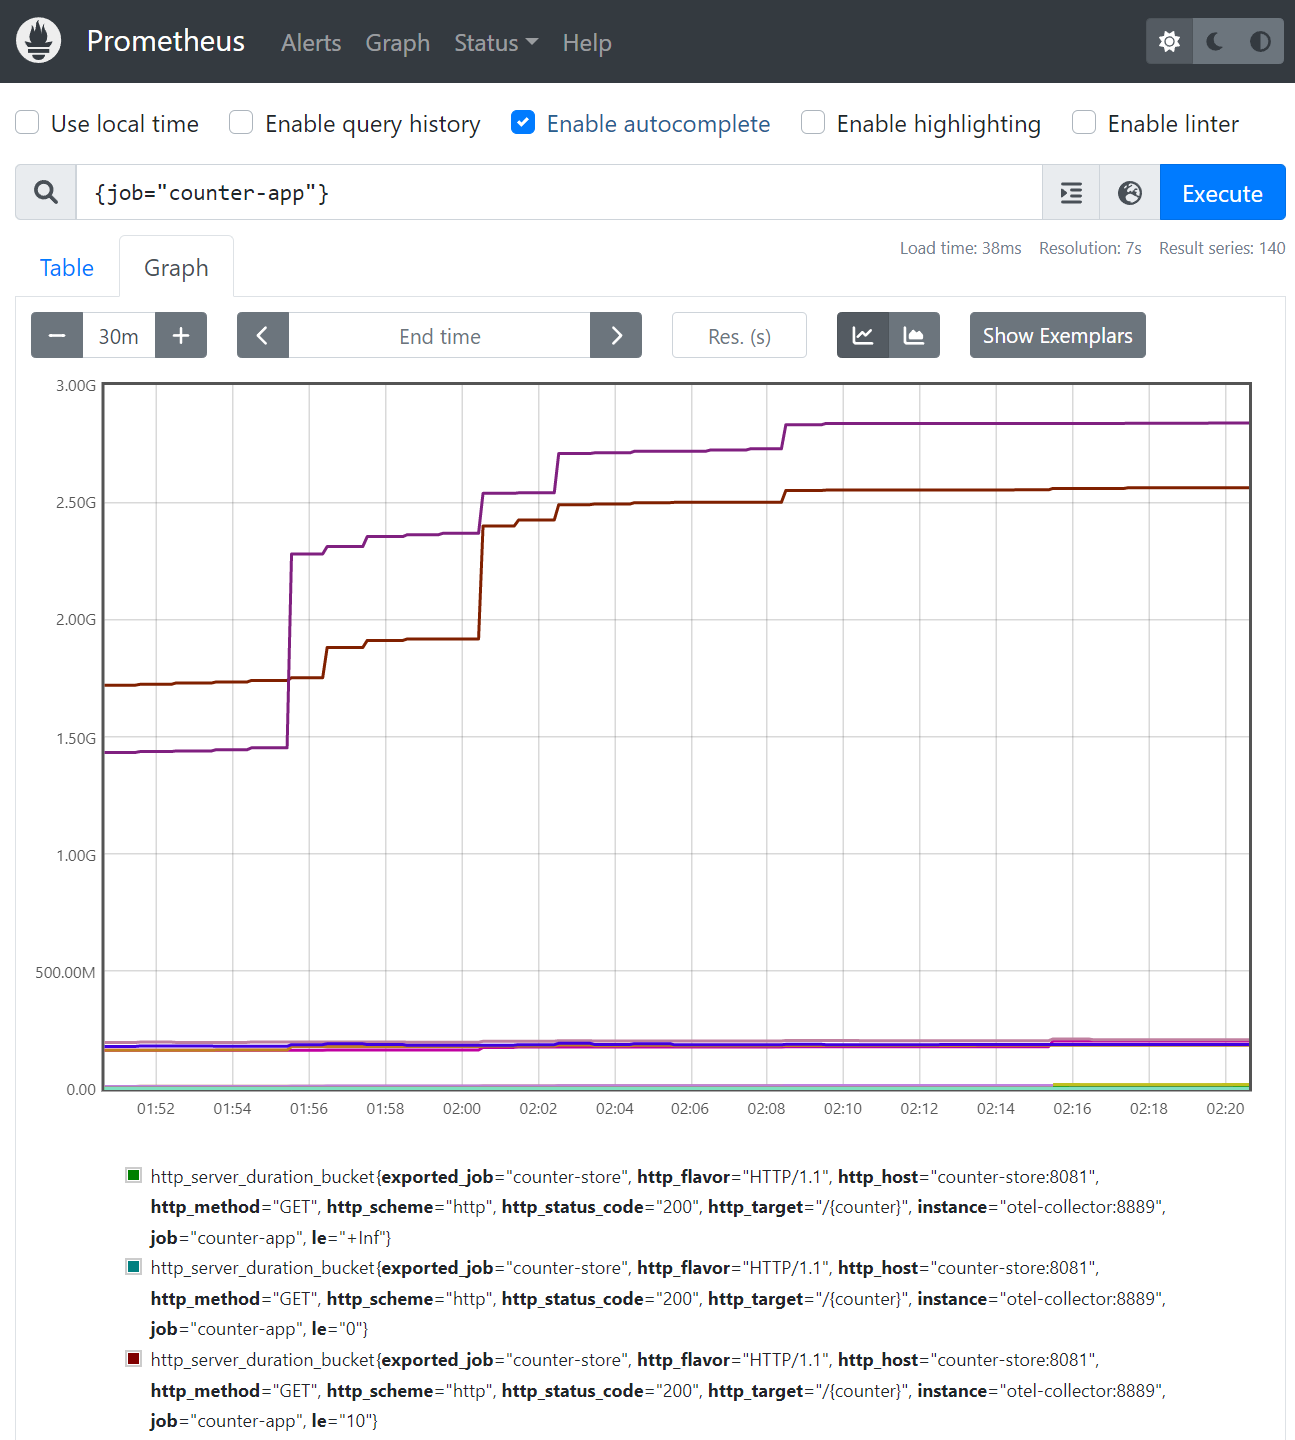
Let’s now investigate the Prometheus UI at http://localhost:9090/, where you can view all the metrics generated by your application using the following Prometheus query:
Below, you can see the graph result of the query on Prometheus:
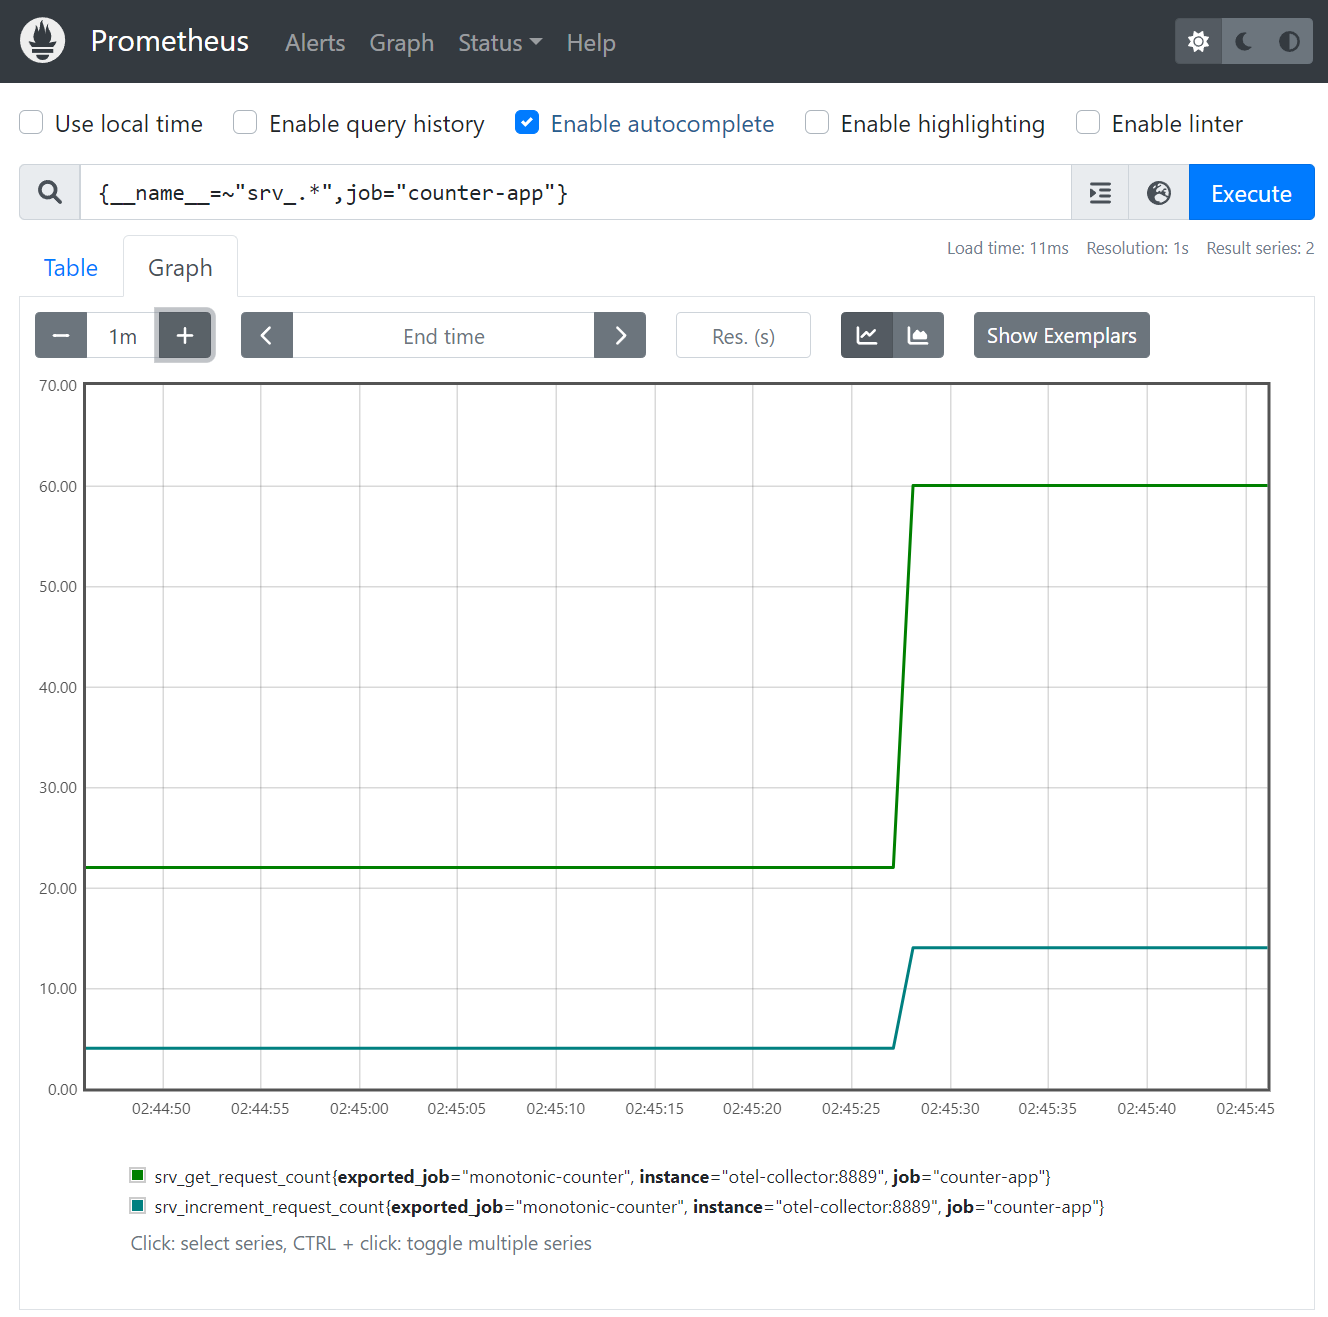
Using the following query, you can refine your search to only show metrics beginning with the srv_ prefix. This will display only the custom metrics you added to our application earlier.
The output of the query on Prometheus is as follows:
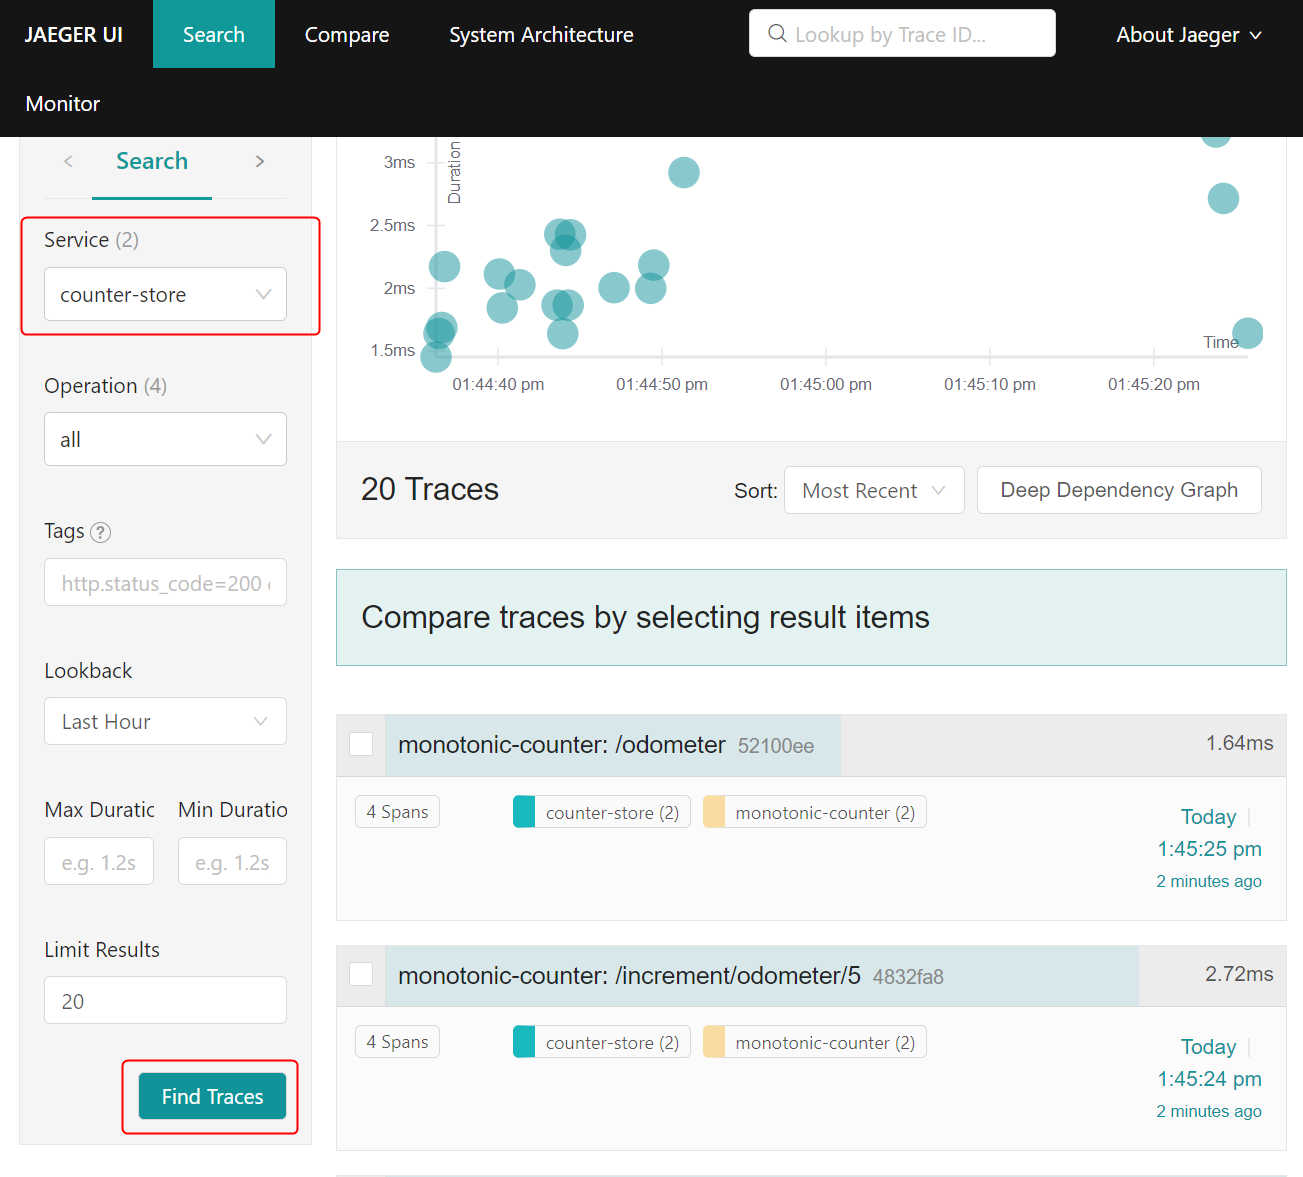
Finally, let’s investigate the traces generated by the application on Jaeger console that is available at http://localhost:16686/. To see the traces that Jaeger recorded, select one of the services in Jaeger: counter-store or monotonic-counter, then click Find traces.
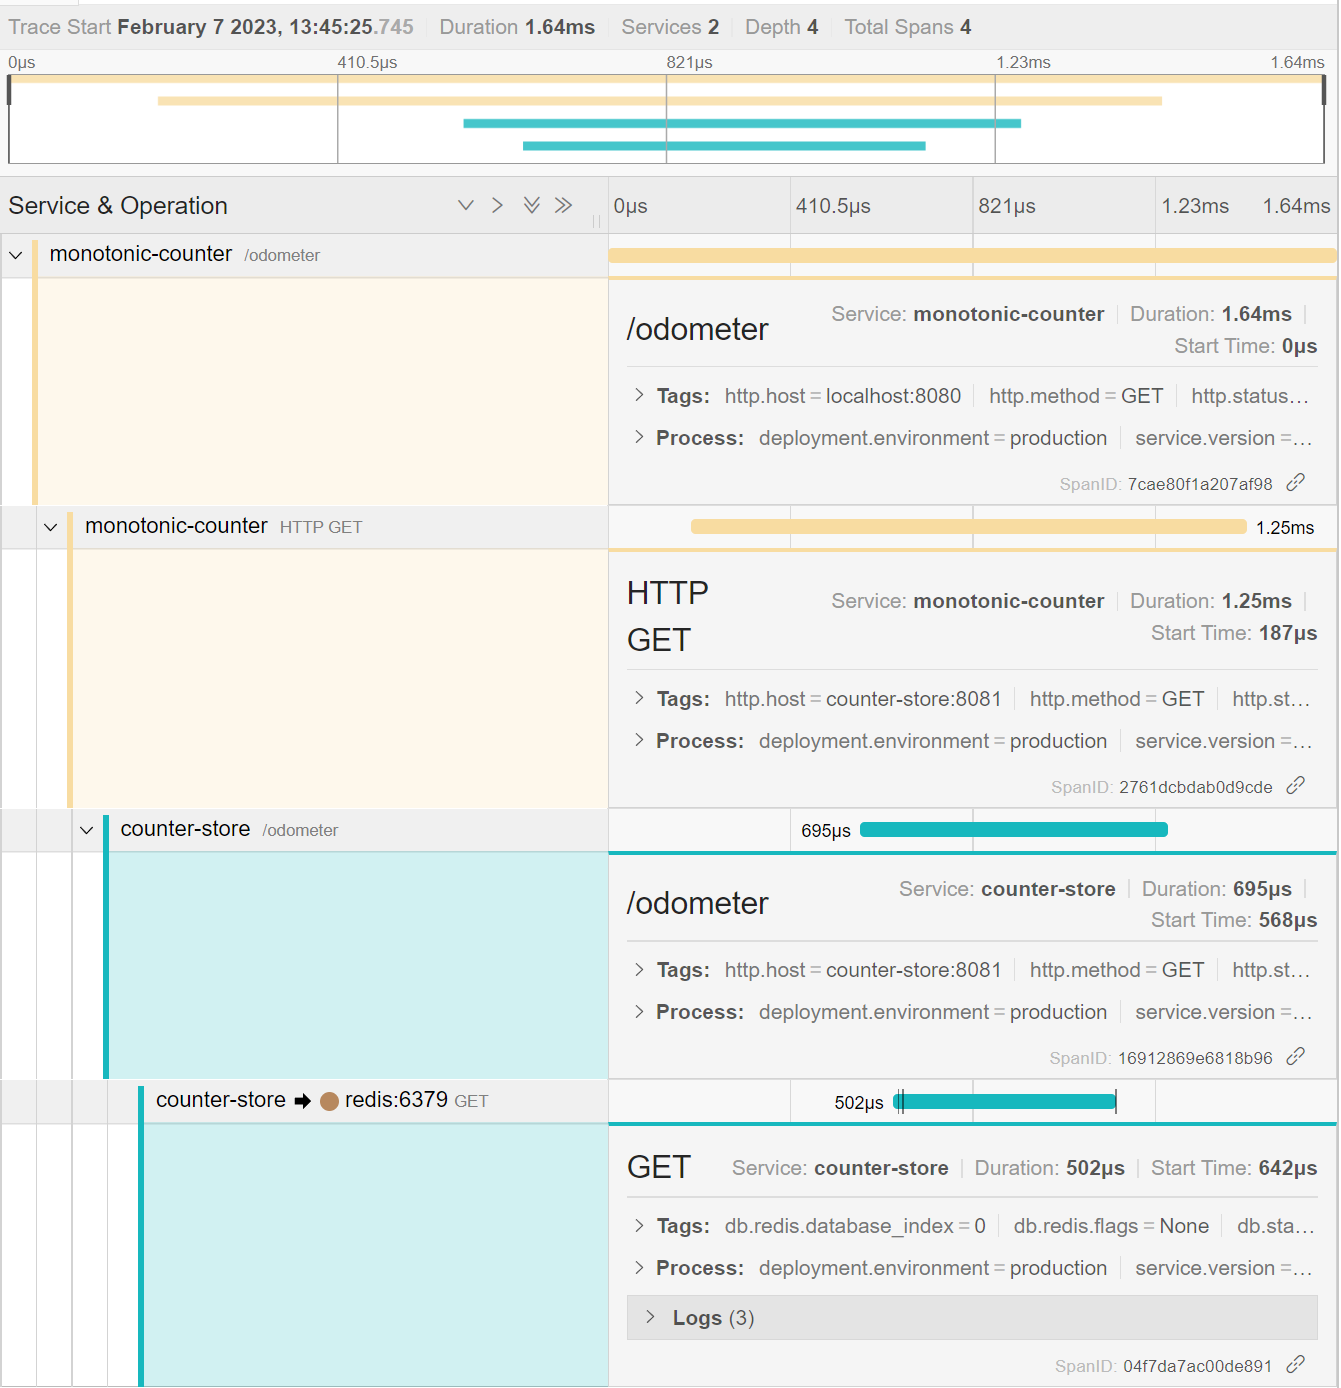
You can click on any trace to view the spans recorded in it. Below is an example of an expanded trace showing spans from both applications, including Redis operations:
OpenTelemetry traces are a powerful tool for identifying the root cause of exceptions in a distributed system. The instrumentation captures rich metadata about application errors, and the information is displayed prominently in Jaeger. You'll now cause an exception in the application, then look for its cause in Jaeger.
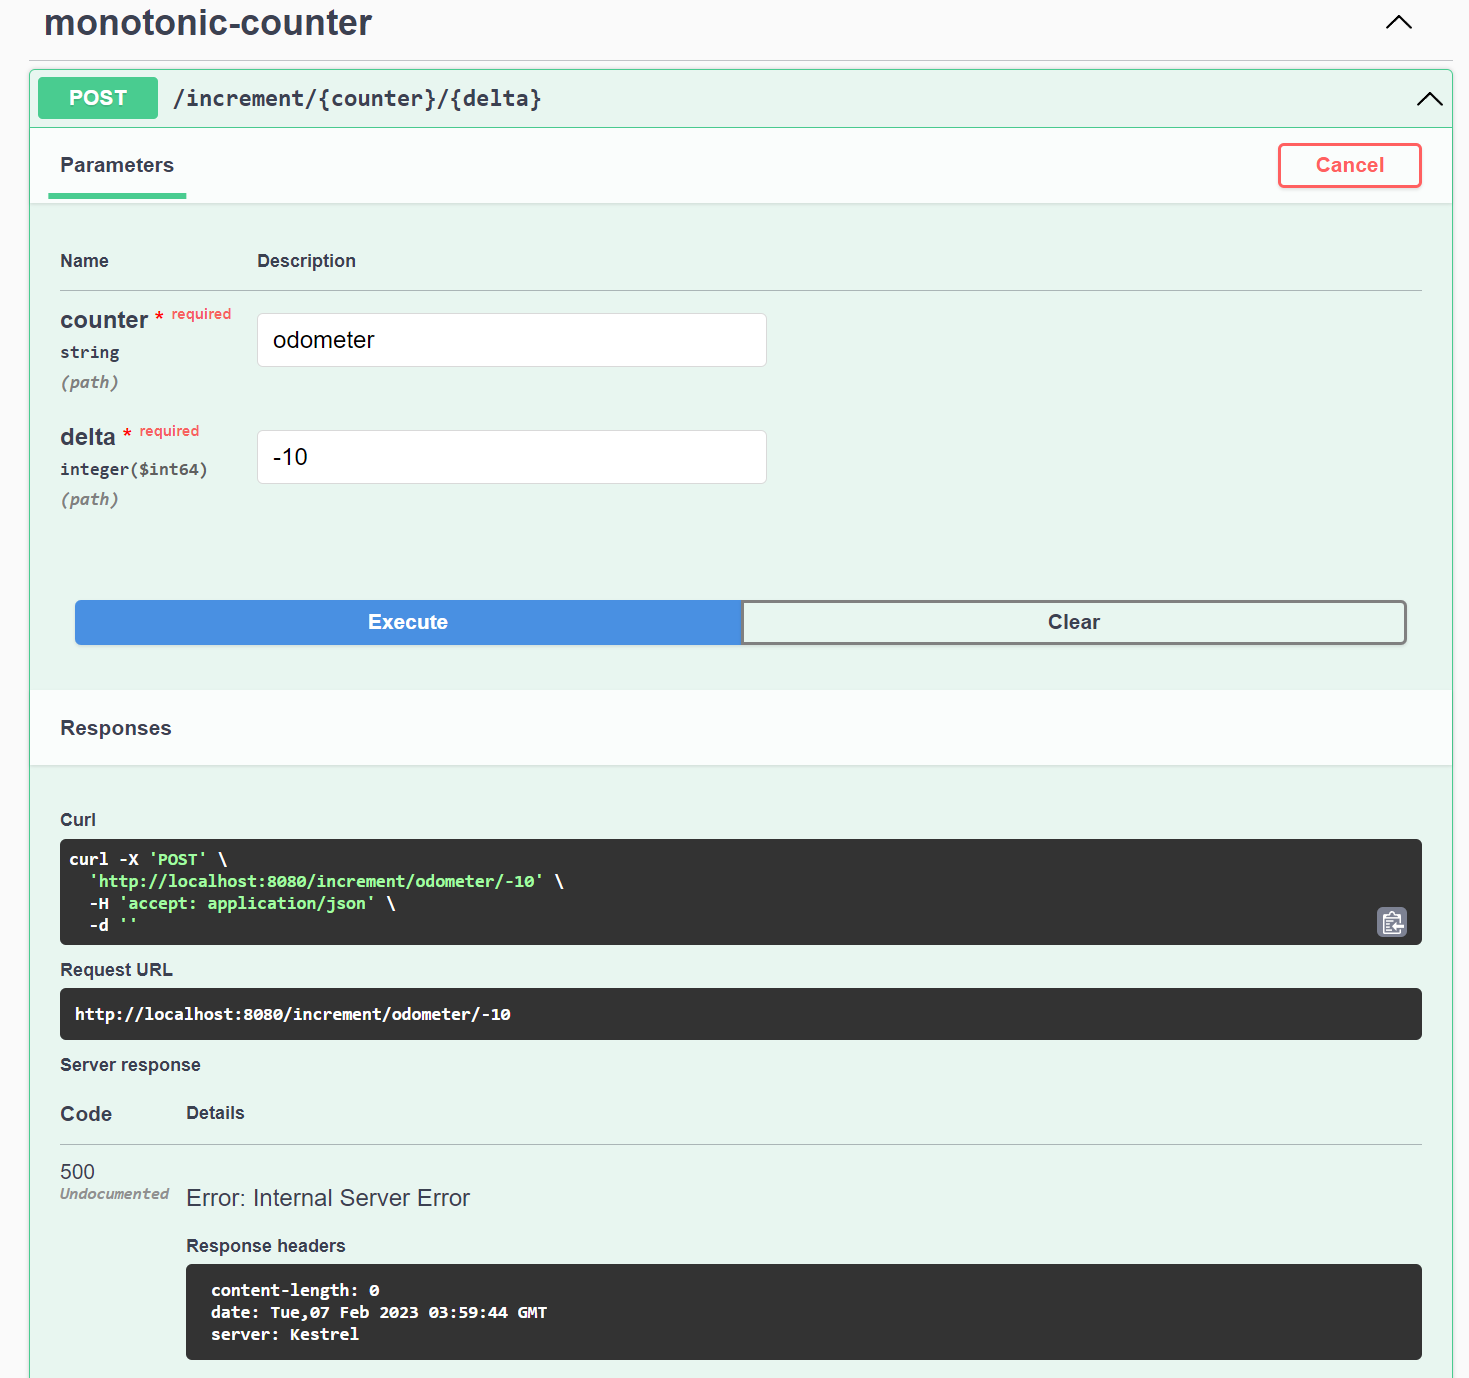
Send a request to the increment endpoint using the Swagger UI to increment the counter by a negative value, which should return the following error response:
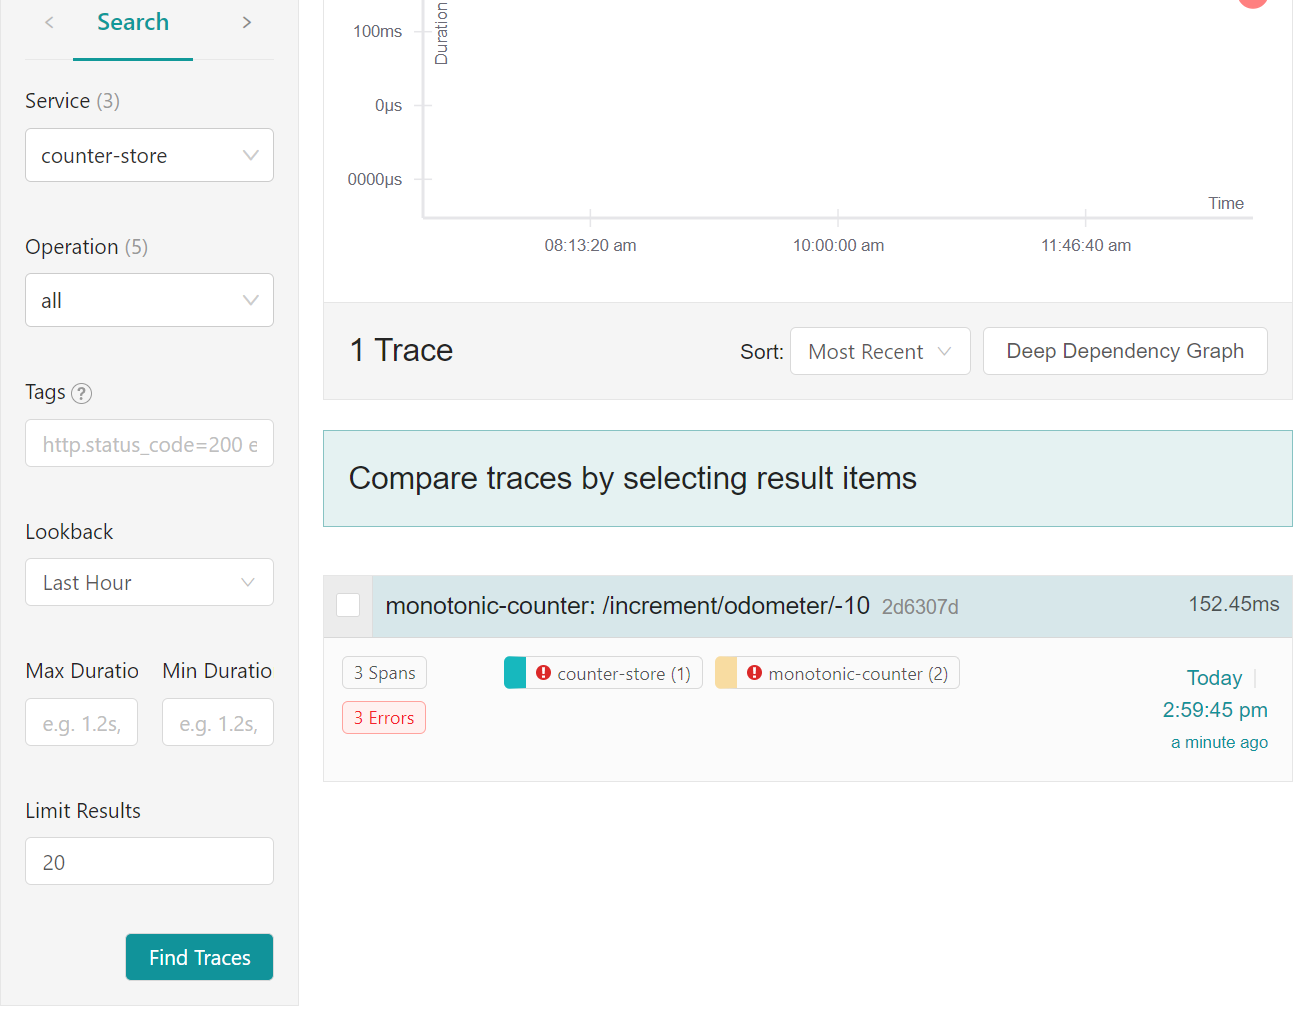
When you reenlist the traces from the services in the Jaeger UI, the traces containing errors will be highlighted as follows:
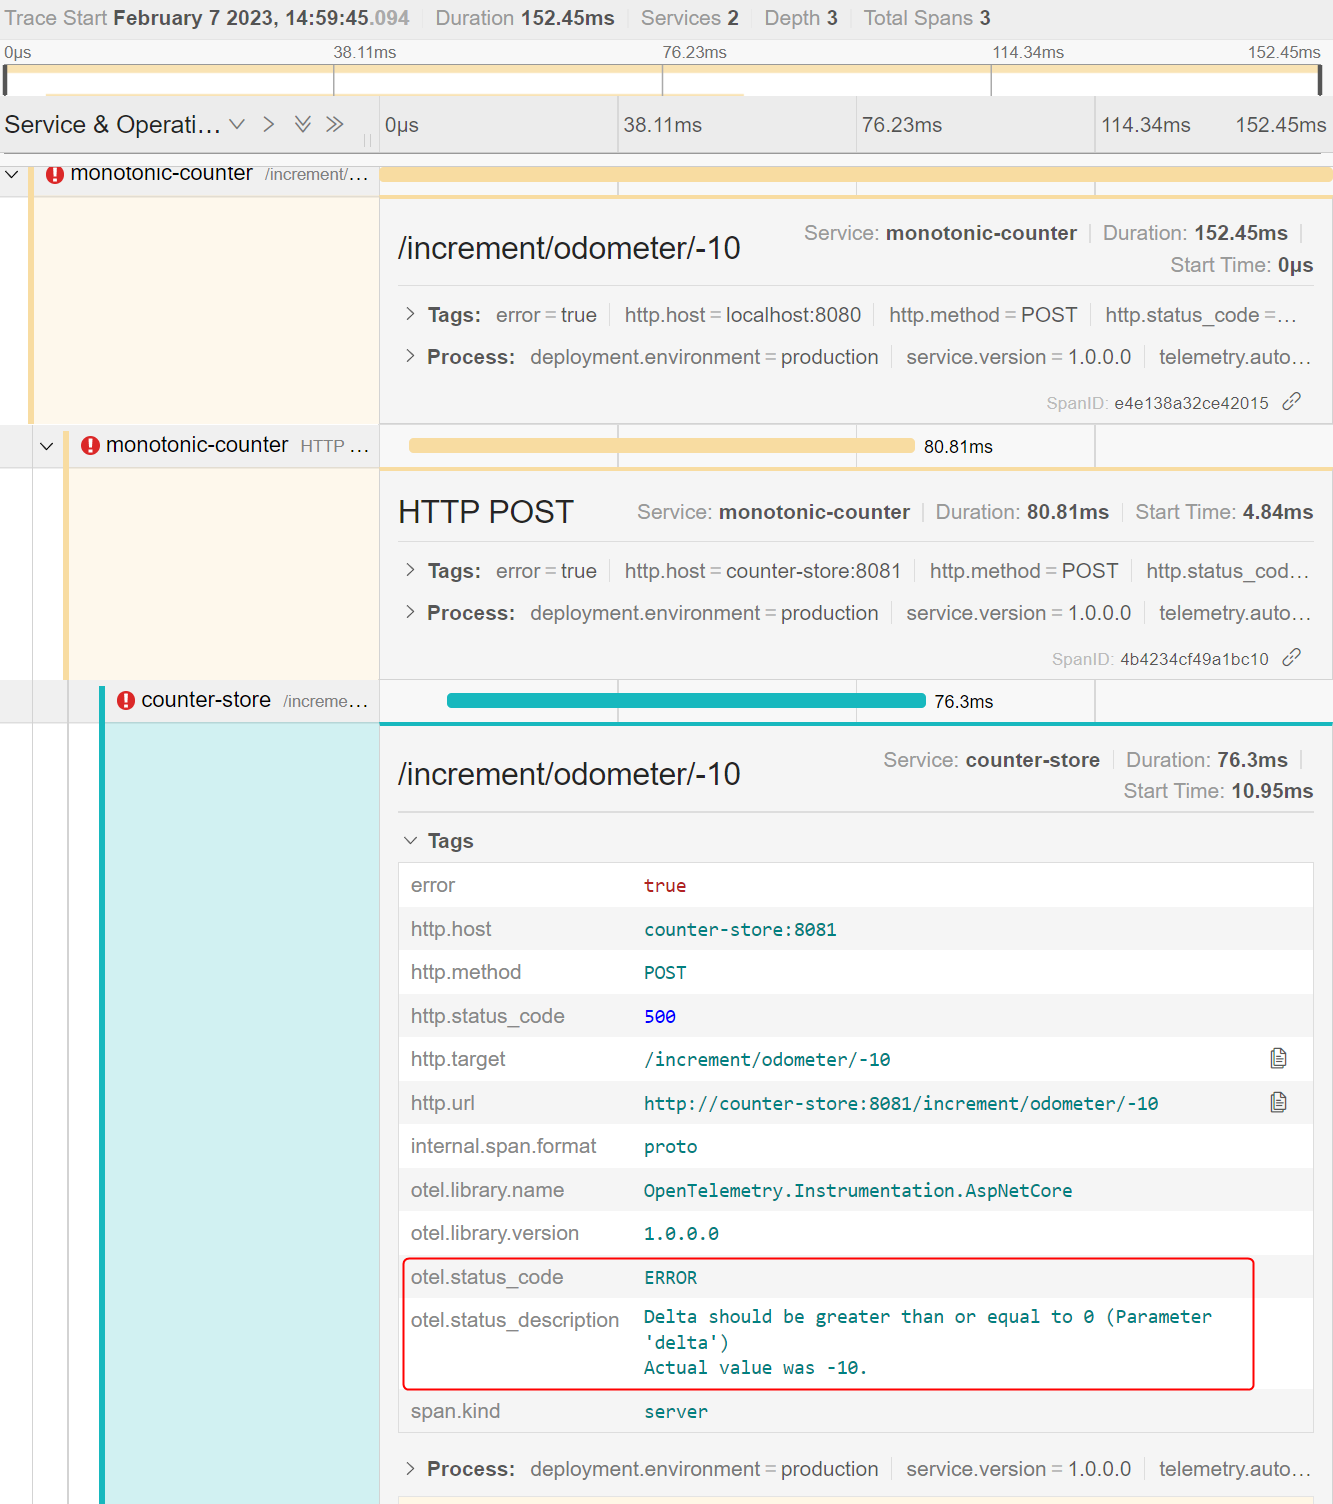
Once you expand the trace containing the error, you can navigate to the service where the error originated and view the exception message as follows:
Your demo is now complete. This guide and the demo clearly show that auto-instrumentation can offer unparalleled visibility into existing applications without requiring changes to the application code.
Conclusion
In this article, I discussed how containerized .NET applications can be auto-instrumented to instantly extract value from OpenTelemetry. First, you learned how to instrument a microservices application to enable OpenTelemetry to collect traces, logs, and metrics. Then, you built pipelines for different signals in the OpenTelemetry collector to send telemetry to relevant backends. The pipelines we created directed the metrics to Prometheus, traces to Jaeger, and logs to the OpenTelemetry collector for storage and analysis.
With auto-instrumentation, developers can gain real-time insights into their applications' performance and behavior without editing the application code to collect telemetry. In your observability journey, consider auto-instrumentation as a helpful tool while aiming for manual instrumentation for greater control over telemetry.
Rahul Rai is a technology enthusiast and a Software Engineer at heart. He is a Microsoft Azure MVP with over 15 years of hands-on experience in cloud and web technologies. With so much leadership experience behind him and currently holding a Group Product Manager Role at LogicMonitor, he has successfully established and led engineering teams and designed enterprise applications to help solve businesses’ organizational challenges.
Outside of his day job, Rahul ensures he’s still contributing to the cloud ecosystem by authoring books, offering free workshops, and frequently posting on his blog: https://thecloudblog.net to share his insights and help break down complex topics for other current and aspiring professionals.
Related Resources
Twilio Docs
From APIs to SDKs to sample apps
API reference documentation, SDKs, helper libraries, quickstarts, and tutorials for your language and platform.
Resource Center
The latest ebooks, industry reports, and webinars
Learn from customer engagement experts to improve your own communication.
Ahoy
Twilio's developer community hub
Best practices, code samples, and inspiration to build communications and digital engagement experiences.