Evaluate the Performance of your Website for Free with Loader.io
Time to read:
August 30, 2021
Written by
Reviewed by
This post is part of Twilio’s archive and may contain outdated information. We’re always building something new, so be sure to check out our latest posts for the most up-to-date insights.

Do you have an approximate idea of what the average response time of your website is? Or how many requests per second it can handle? If you plan to grow your website you must have an idea of what its current limits are, so that you can adapt to increasing demand and scale accordingly.
In this short tutorial I’m going to show you how to evaluate the performance of your website using loader.io, a free cloud-based load testing service.
Requirements
The main requirement to follow this tutorial is access to a deployed web application that you’re interested in evaluating for performance.
The Loader service evaluates performance of HTTP requests, so the types of applications that can be evaluated are those that provide data services to a front end application (often called web APIs) or standard web applications built with server-side frameworks such as Ruby on Rails, Express, or Django.
Keep in mind that performance testing is going to direct large amounts of web traffic to your website, so you may want to use a staging deployment of your site instead of a production version where there are actual users connected. Also, note that the Loader service requires all target hosts to be verified before it allows you to create tests for them. The verification is done to prove that you have administrative access to the site you want to test.
The second important requirement that you need is a loader.io account. The free plan is perfectly adequate to test the performance of one web application, so go ahead and sign up for a free account now!
Verify your target host
The first action that you need to take is to provide proof to Loader that you have full control of the website you intend to test. This is obviously a security measure to prevent bad actors from directing lots of testing traffic to a site they do not own, such as one of a competing business.
After you log in to your Loader account, click on the Target hosts option in the navigation bar to begin the verification process.
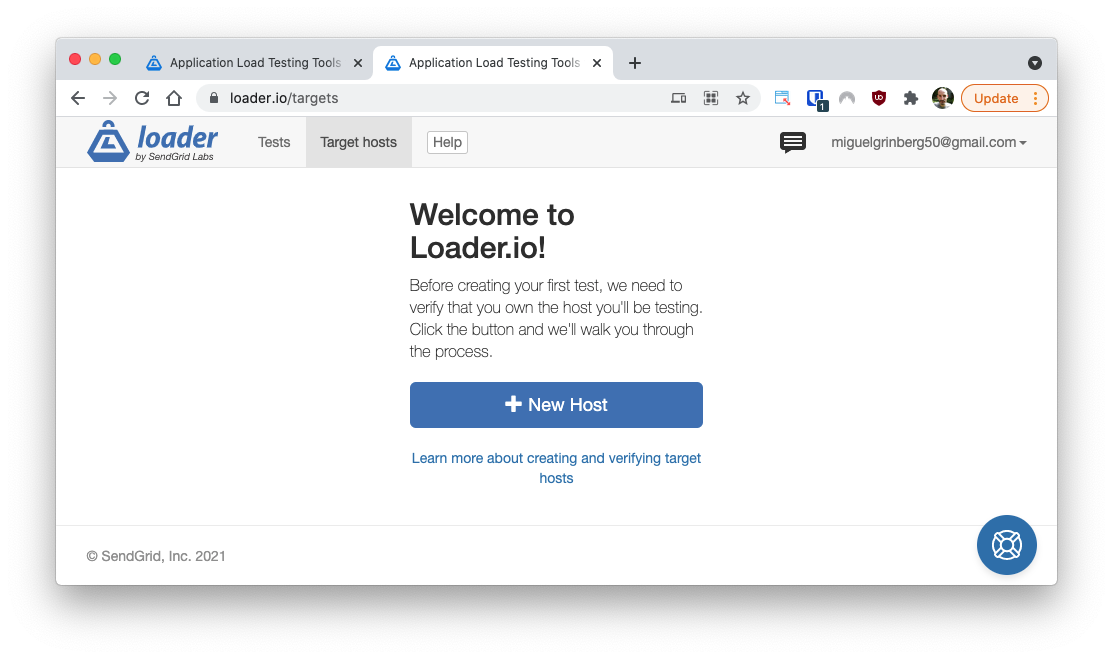
Click the “New Host” button and enter the domain name for your website.
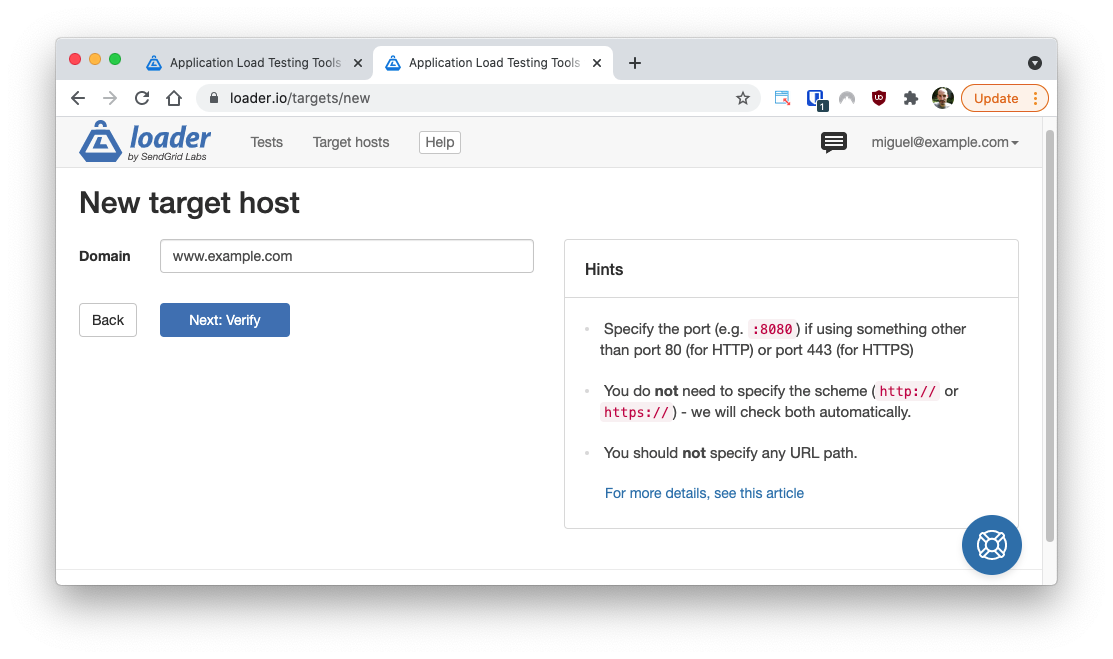
Click the “Next: Verify” button to continue, and you’ll be presented with the following screen:
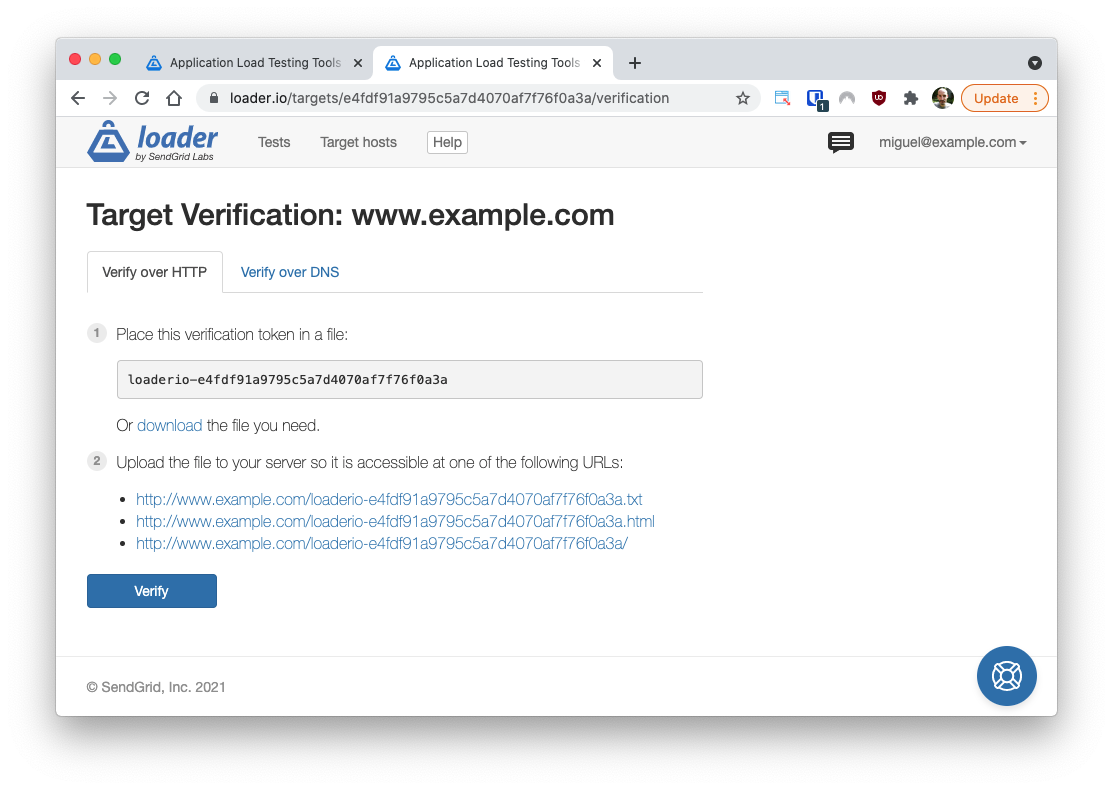
Here you are given the option to verify this domain through a static file or through DNS, but keep in mind that only file verification is available for free accounts. Both approaches are described below.
Verification through a static file
Verification through a static file is often the easiest way to complete this step. The requirement is to add a static file to your website that Loader can download to verify the host. Click the “download” link to download the static file, and then copy it to your host, so that it is served as a static asset through your web server. It is important that this file is served by your web application as one of the three example URLs shown above the “Verify” button, as those are the only locations that will be checked.
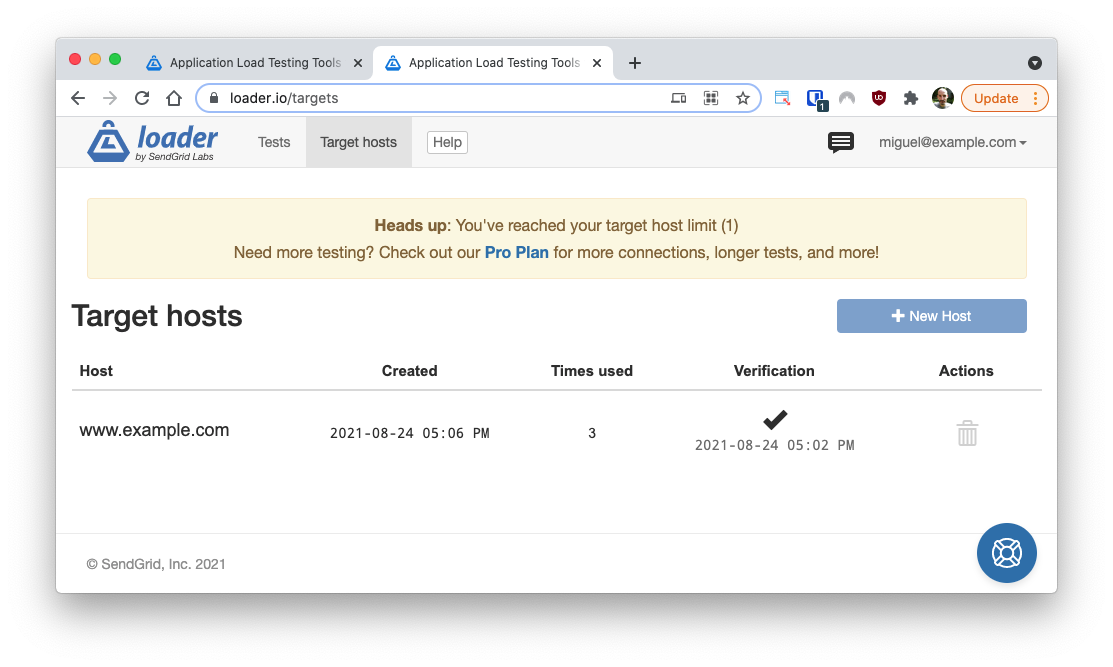
Once you have the static file in place, click the “Verify” button to run the verification. Once the host is verified, it will show as such on the “Target hosts” page:
Verification through a DNS record
Verification through a DNS record is only available on paid plans. If you qualify for this option and would like to use it, click on the “Verify over DNS” tab and you will be given instructions to create a specific DNS record for your domain in your DNS administration panel.
Create a test
Once you have added a verified target host, you are ready to create your first test, so head over to the Tests section, and click the “New Test” button to begin.
In the “Test Settings” section, you can define the high-level parameters of your test:
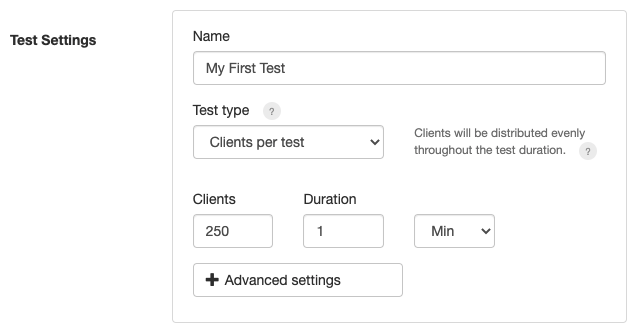
For your first test, I suggest that you just enter a meaningful name for your test and leave the remaining fields set to their default values. Under this configuration, the test is going to send 250 clients to your site, spread over a test duration of one minute.
The “Advanced settings” button will add other options that in some cases might be needed, such as credentials needed for authentication purposes.
The “Client requests” section allows you to define the HTTP requests (up to two in a free account) that you want the service to use when sending traffic to your site.
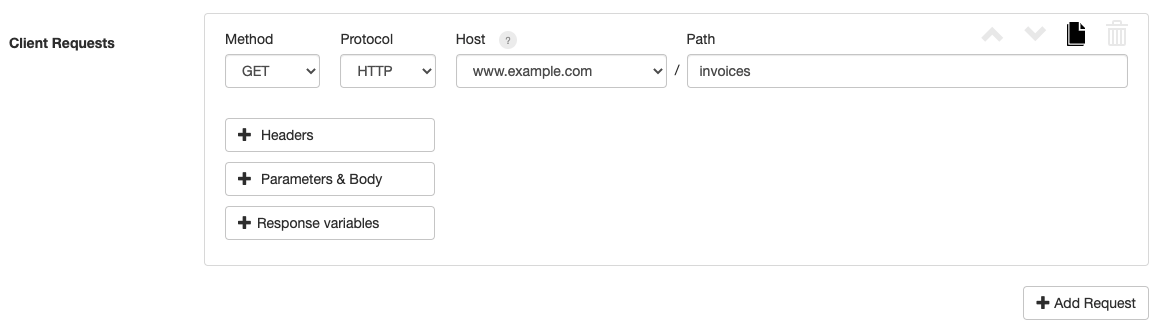
Here you are able to define the HTTP method, protocol (http:// or https://), and the URL path. You can also define custom headers and what to send in the request body if applicable.
I’m going to ignore the “Response variables” option as it is used in advanced configurations in which values returned from one request can be captured and used in a follow-up request.
If you want to save the test to run it later, click the “Save for later” button. Or if you feel adventurous and your site is ready to receive some traffic, click the “Run test” button, which will save the test and start it right away!
Run a performance test
When you are ready to run a first traffic test, open the test page and click the “Run test” button. You will be able to watch the test executing in real time.
After the test completes, you may want to change the test parameters, such as for example, increase the load. Click on the “Edit Test” icon to go back to the test configuration page, where you can make changes and launch another test run.
How to interpret the test results
The key in getting the most out of Loader is in interpreting the results. What this really means is different for different people, so all I can do is tell you what metrics I’m personally interested in when I evaluate the performance of a site.
The two numbers that I find useful are the average response time, and the maximum requests per second processed.
Average response time
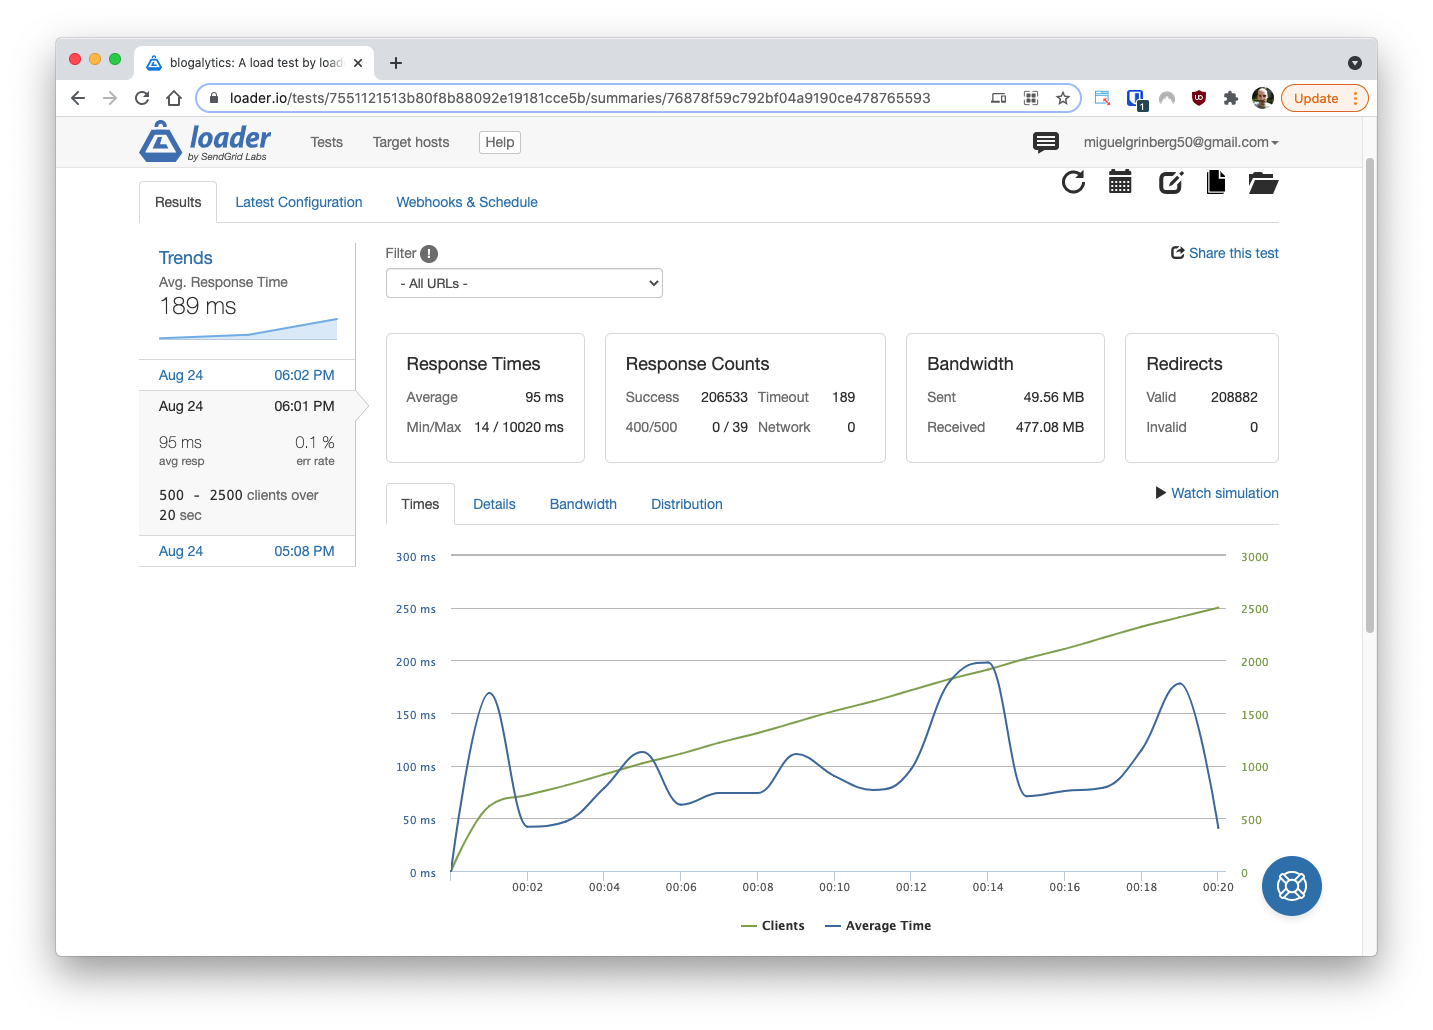
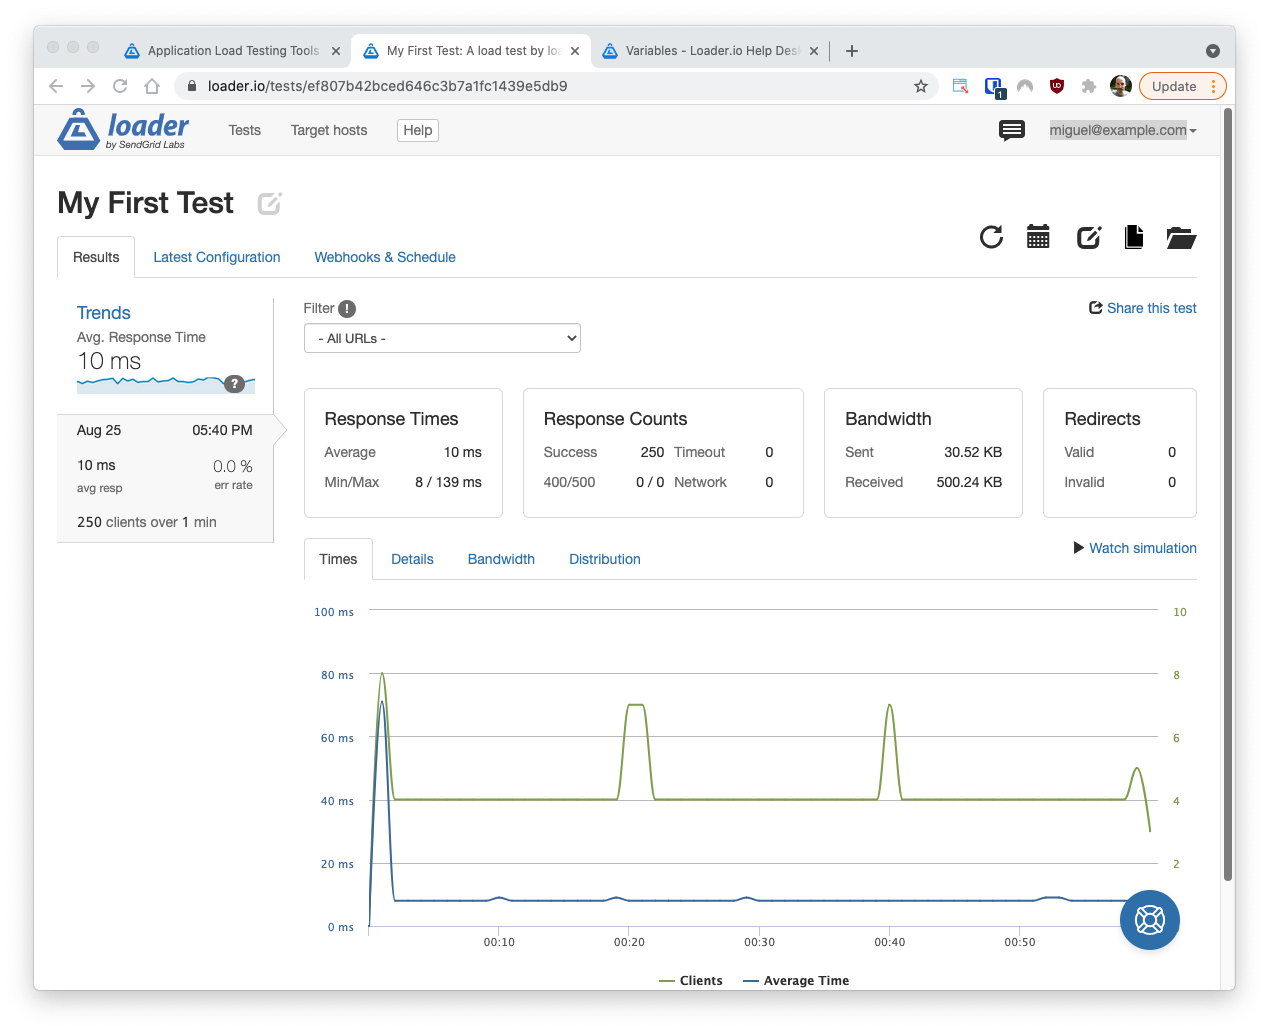
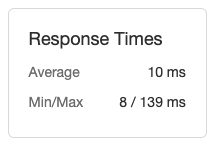
The average response time is very easy to obtain. After a test run completes, Loader shows you what the average response time is in the “Response Times” box:
By changing the number of clients used during each test you can evaluate how your website’s response time changes with different loads. This can help you make decisions on when it is time to scale up.
The chart that displays under the “Times” tab shows you the response time throughout the duration of your test:
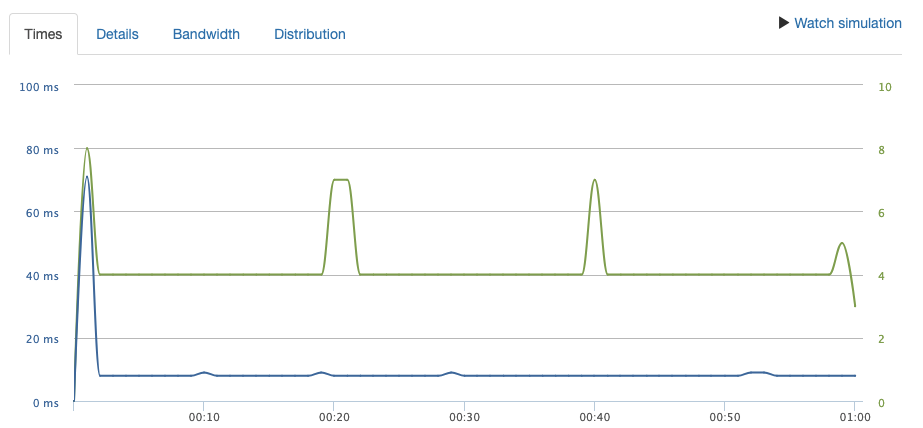
Here the green curve is the number of active clients, and the blue curve is the response time. You can see in the above chart that after an initial bump the response time has been more or less constant around 10ms, which means that this particular test was not challenging enough for my host to handle. The next step in this case would be to increase the number of clients and try again.
If you recall, the test configuration includes a “Test type” parameter, which is set to “Clients per test” by default. Another way to configure the amount of load used during a test is to use the “Clients per second” test type, which might be easier to think about if you run tests that aren’t always one minute long.
Maximum requests per second
The average response time for requests is a good metric to keep an eye on, because you don’t want your site to be too slow or unresponsive. But as you likely noticed, this isn’t an absolute metric, as it varies according to the load you apply to the server.
The other metric that I often look at is how many concurrent requests the server can handle before it becomes unusable. Here the definition of “unusable” can be anything you like. For example, you can say that the site is unusable if it starts returning error responses due to extreme load, or maybe you’ll consider it unusable when the average response time is higher than one second. The criteria is entirely up to you and your expectations for your website.
Obtaining requests per second results for a given test is a bit harder with Loader. Click on the “Details” tab to see another chart:
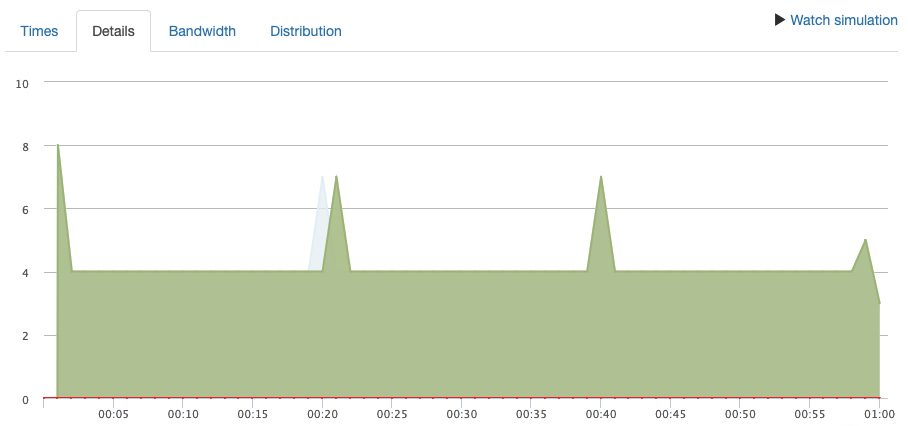
This chart shows requests according to their result. The green area is for successful requests, and there are other colors for different types of error results. The Y-axis in this chart is requests per second. In the above chart you can see that most of the time, the test processed four requests per second.
So based on the results of the two metrics for this test, we know that with 240 clients in a test that lasts for a minute, response times are in the 10ms range on average and requests are handled at about 4 requests per second, which is expected when the server can totally handle the load. Great!
But what we really want to know is the maximum number of requests per second that the server can handle before it starts to show signs of being overloaded. For this, I find the third test type useful. Go back to edit the test and change the test type to “Maintain client load”.
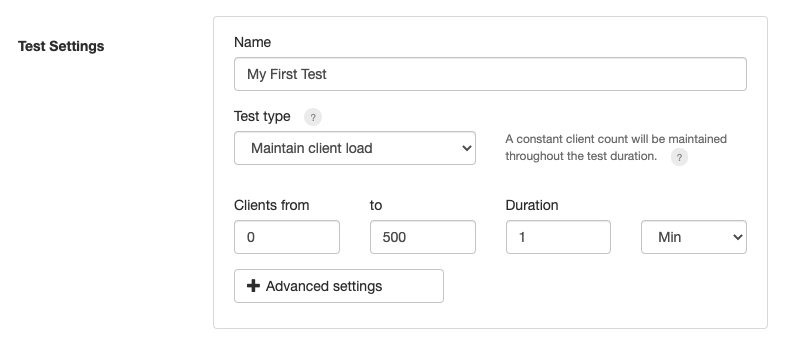
For this test type, you provide the initial and final number of clients. The difference between this test type and the other two is that once a client is added to the test, it remains active and continues to send requests, so the load increases over time. This is great to see how the server adapts to increasing loads. In the above example I’m starting from 0 and going up to 500 concurrent clients.
The response time chart is much more interesting now:
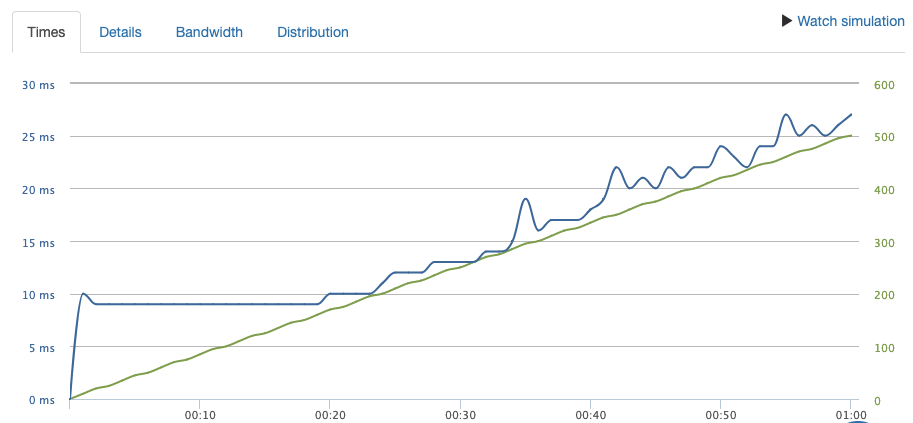
Here you can see that when the number of active clients gets to around 200 the response times start to climb and become a bit unstable. This is extremely useful information that you can use to know what your server limits are.
The requests per second chart is also very revealing:
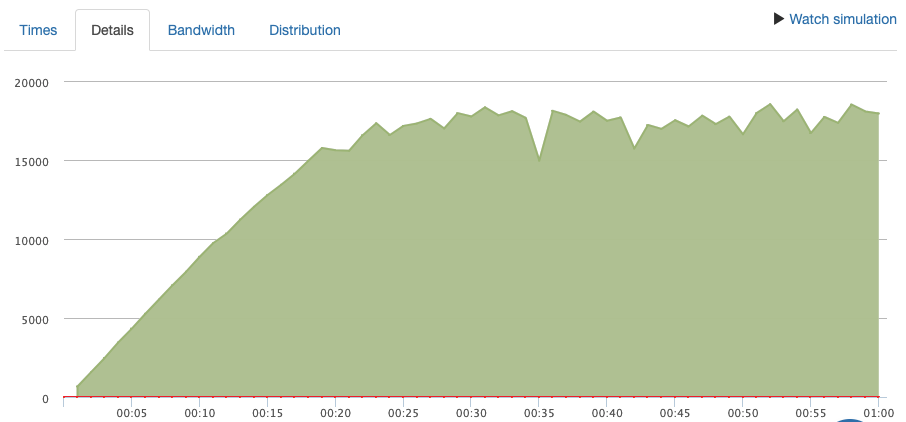
Here we can see that at around 20 seconds is when the server leveled up and couldn’t process requests any faster than about 16K-17K requests per second, which is a really good number. This is clearly the limit for the testing URL that I have chosen.
Conclusion
I hope this was a friendly introduction to load testing. If you find this type of analysis useful, I encourage you to give loader.io a try!
Miguel Grinberg is a Principal Software Engineer for Technical Content at Twilio. Reach out to him at mgrinberg [at] twilio [dot] com if you have a cool project you’d like to share on this blog!
Related Resources
Twilio Docs
From APIs to SDKs to sample apps
API reference documentation, SDKs, helper libraries, quickstarts, and tutorials for your language and platform.
Resource Center
The latest ebooks, industry reports, and webinars
Learn from customer engagement experts to improve your own communication.
Ahoy
Twilio's developer community hub
Best practices, code samples, and inspiration to build communications and digital engagement experiences.