Propagate OpenTelemetry Context via Azure Service Bus for Asynchronous .NET Services
Time to read: 5 minutes
May 02, 2023
Written by
Reviewed by

As the size of distributed systems in organizations grows, it becomes essential to monitor and trace the interactions between various services within the system. OpenTelemetry, an open-source observability framework, has become increasingly popular for this purpose. It is a set of APIs, libraries, and agents designed to collect distributed traces and metrics from applications, allowing developers to gain insights into their applications' performance and behavior. OpenTelemetry is a collaborative effort between the OpenTracing and OpenCensus projects and is now a part of the Cloud Native Computing Foundation (CNCF).
In this article, you will learn how to pass OpenTelemetry context between asynchronous .NET services. To understand the concept in detail, you will use a REST API and a console application that communicates using Azure Service Bus and export traces to a Jaeger service. As you implement the application, you will learn how to serialize and deserialize context across service boundaries using the OpenTelemetry propagator.
What is Context Propagation?
In OpenTelemetry, context refers to the mechanism used to carry metadata across process boundaries and different layers of an application. It is an essential part of distributed tracing and logging, as it allows for the correlation of telemetry data across various services in a distributed system.
The context in OpenTelemetry is typically represented by a key-value pair, where the key is used to identify the specific metadata, and the value carries the actual data. The most common use case for context is to store and propagate trace identifiers (e.g., trace ID and span ID) that are used to correlate traces across services and processes.
OpenTelemetry Propagators aid in the transportation of context across process boundaries by serializing and deserializing the context object across the sender and the receiver of the context. Let’s try to understand context propagation with an example.
The diagram below shows two services communicating over HTTP. To generate distributed traces, Service 1 must send the context to Service 2 via the HTTP request headers. As part of the propagation process, Service 1 serializes the context object and adds it to the request HTTP headers, a process called injection. On the other end, Service 2's propagator deserializes the context from the HTTP request headers and sets it as the current context, a process called extraction.
Typically, tracing HTTP request headers comply with W3C standards. The W3C standard for tracing HTTP request headers is referred to as Trace-Context. Zipkin B3 headers are another popular format used by some tracing systems.
The .NET OpenTelemetry instrumentation library for HttpClient and HttpWebRequest automatically manages context propagation. Therefore, you won't have to manually set up propagation for synchronous services if you use the library. In contrast, asynchronous services don't communicate over HTTP, so context propagation must be configured manually for such applications.
Sample: Sender and Receiver Asynchronous Services
Here is a high-level design diagram for the sample application you will develop.
The application consists of a REST API named "Sender" that exposes a single HTTP POST endpoint /send to receive a message from the user. Upon receiving the request, the Sender application queues the received message to an Azure Service Bus queue.
The "Receiver" is a simple console application that attaches a listener to the queue and continuously listens to the messages. Upon receiving a message from the queue, the application prints it to the console and marks the message as Completed so that it is deleted from the queue.
Each application exports traces to a Jaeger instance running inside a Docker container. At any time, you can view the distributed traces from the applications in the Jaeger UI console.
You will learn how to build this application in this tutorial. This application's reference implementation is also available on GitHub for your convenience.
Prerequisites
You will use the following tools to build the sample application:
- Visual Studio, VS Code, or JetBrains Rider as the IDE.
- .NET 7 (or newer)
- Docker Engine (you can install the engine using Docker Desktop (Windows, macOS, and Linux), Colima (macOS and Linux), or manually on any OS.
- A basic understanding of Jaeger.
- An Azure Subscription, an Azure Service Bus namespace and queue.
Please ensure that you maintain the following solution structure while building the application.
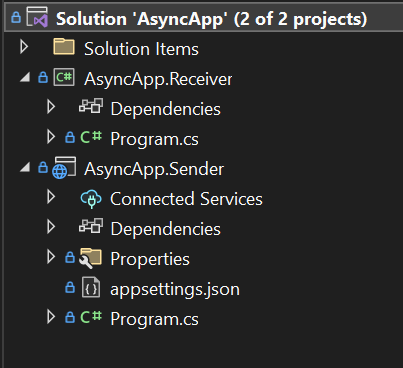
Develop the Sender Service
Create a new solution file named AsyncApp and within it a Minimal API project named AsyncApp.Sender with ASP.NET Core.
Add the following NuGet packages to the project:
Now replace the contents of the AsyncApp.Sender/Program.cs file with the following code segment:
This code configures the components of the tracing pipeline you will use in the service: the resource, the tracer provider, the span processor, and the span exporter. As you intend to export the service traces to a local Jaeger instance, you used the JaegerExporter as the span exporter. If any of the instructions used to configure and implement OpenTelemetry are unfamiliar to you, refer to the .NET OpenTelemetry Tracing Shim documentation that describes the OpenTelemetry API shim available in .NET, which makes it possible to build applications with terminology consistent with OpenTelemetry specifications.
The next code segment configures the Service Bus client to send messages to the queue.
Finally, you defined a POST endpoint that accepts text input. First, the endpoint method creates the root span and then sets a property of the Baggage. The Baggage contains the metadata that is transmitted to the destination during context propagation. Therefore, the destination service - "Receiver", will have access to the Baggage data as well when it receives the context.
You will now learn how context propagation works. You may remember from the previous section that the process of serializing the context is called Injection. It is the Sender service's responsibility to inject context into service bus messages. The Receiver application will then extract this context from the message.
In the previous code snippet, the Propagator serializes the context and the Baggage into key-value pairs, which the custom action in the Inject method sets as the Service Bus message properties.
Develop The Receiver Application
Create a console application project to the AsyncApp solution and name the project AsyncApp.Receiver:
Add the following NuGet packages to the project:
Now replace the contents of the AsyncApp.Receiver/Program.cs file with the following code segment:
The first step in this code is to configure the OpenTelemetry pipeline and a basic Service Bus queue message consumer. For more information on setting up OpenTelemetry and Azure Service Bus, please refer to the OpenTelemetry guide and Azure Service Bus quickstart guide.
The getter delegate ProcessMessageAsync of the Azure Service Bus message processor reads the message properties and enables the Propagator to deserialize it to a context object. Additionally, you set the parent context for the subsequent spans so they are associated with the same trace as the spans of the Sender application.
Exporting Traces to Jaeger
Since both the applications are configured to export traces to Jaeger, launch a container running Jaeger with the following command:
Then, in a separate shell, run the Sender application on port 8080:
And, in another separate shell, run the Receiver application:
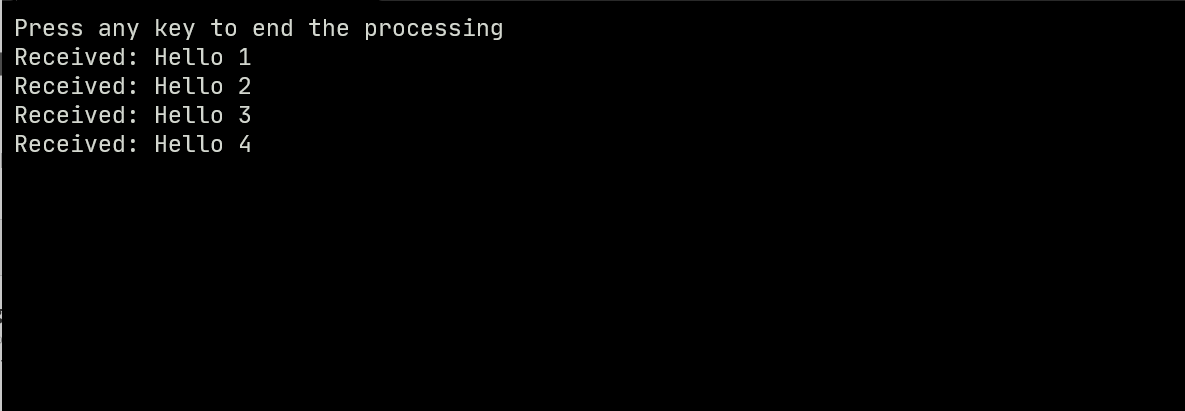
While the Sender and Receiver applications are running together, send a few messages to the Sender application using the following cURL command or PowerShell Cmdlet:
An example of the output generated by the Receiver application is shown in the following screenshot:
You can view the traces by opening the Jaeger UI in your browser at http://localhost:16686.
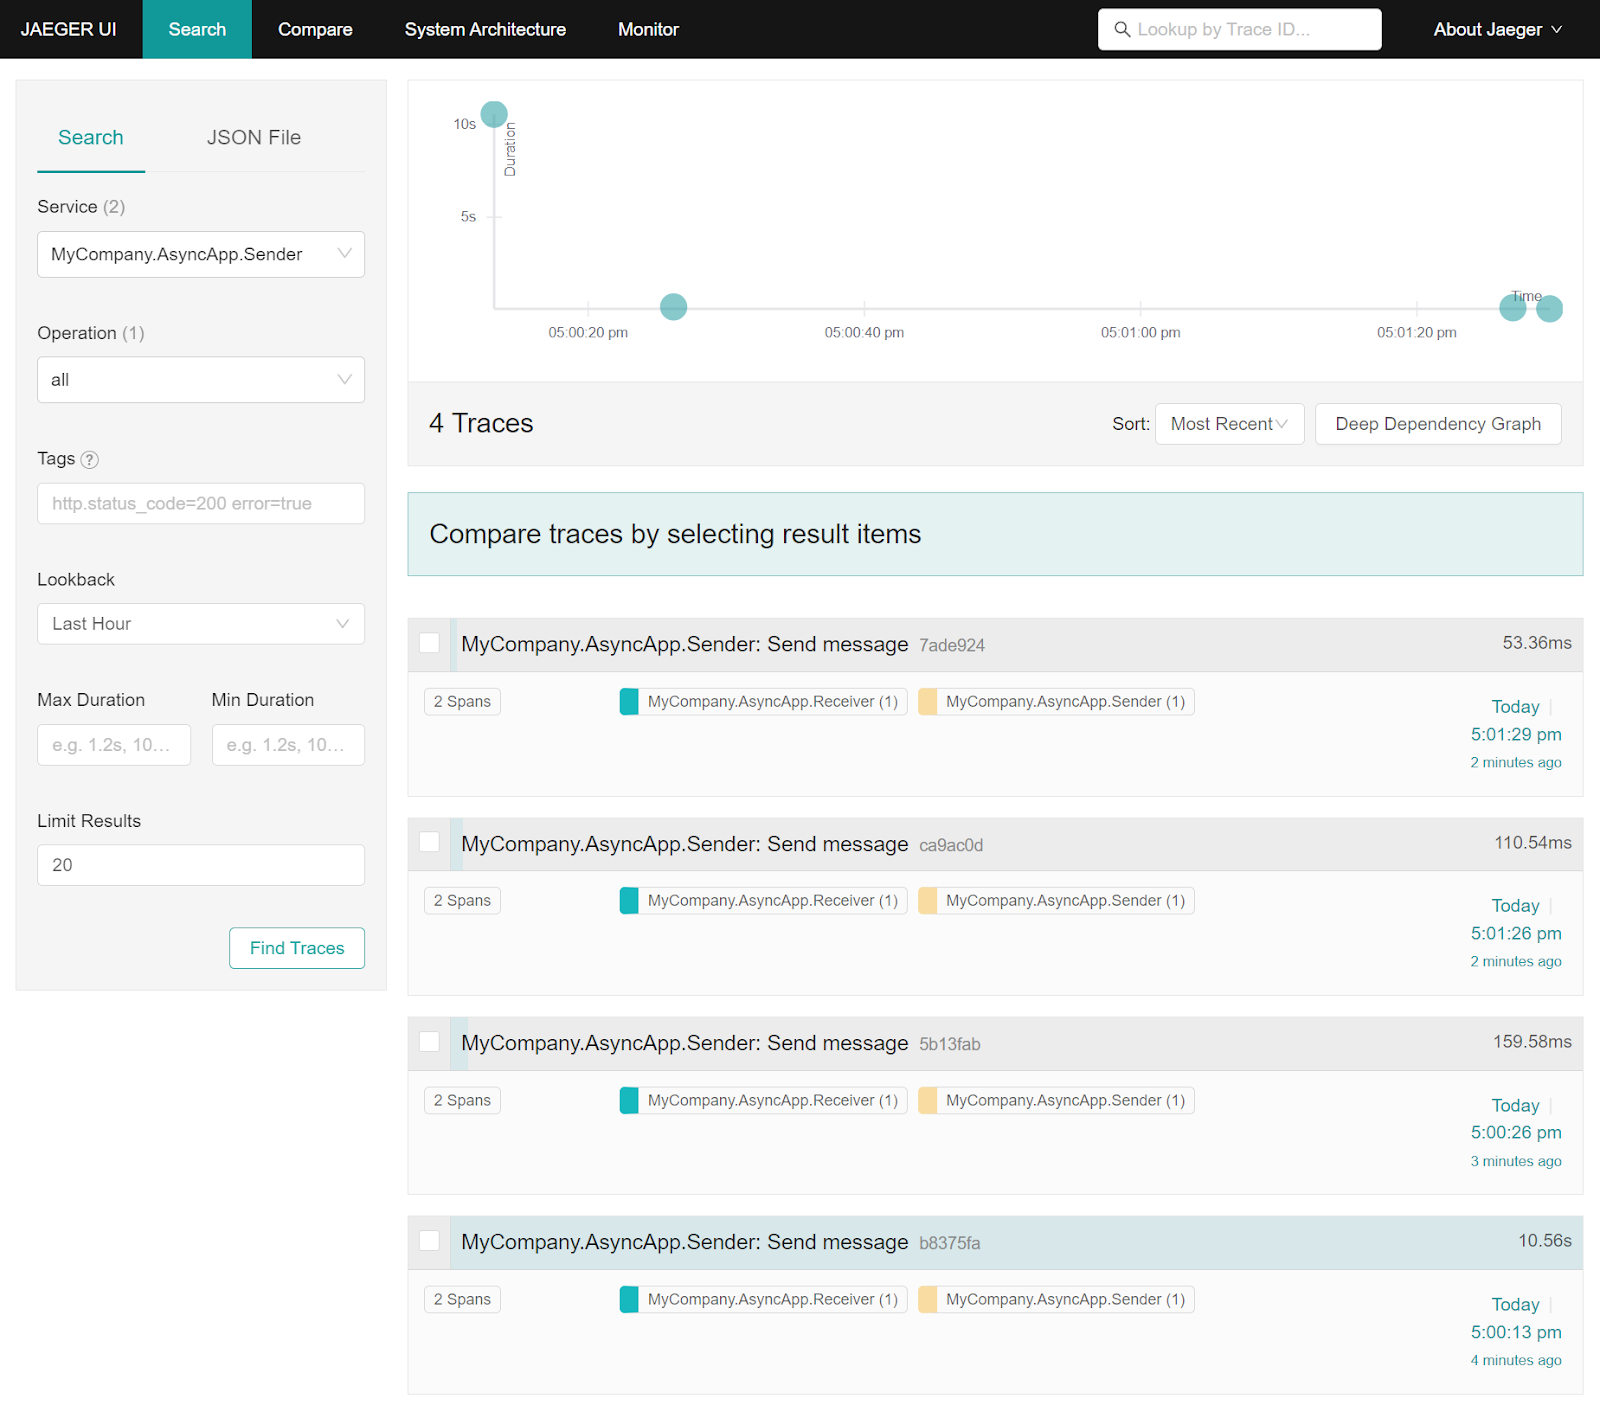
As you can see in the screenshot, both spans are linked to the same trace, proving that context was successfully propagated across service boundaries through the Azure Service Bus queue.
Below is an example of the spans present in a trace, which can be viewed by clicking on one of the traces.
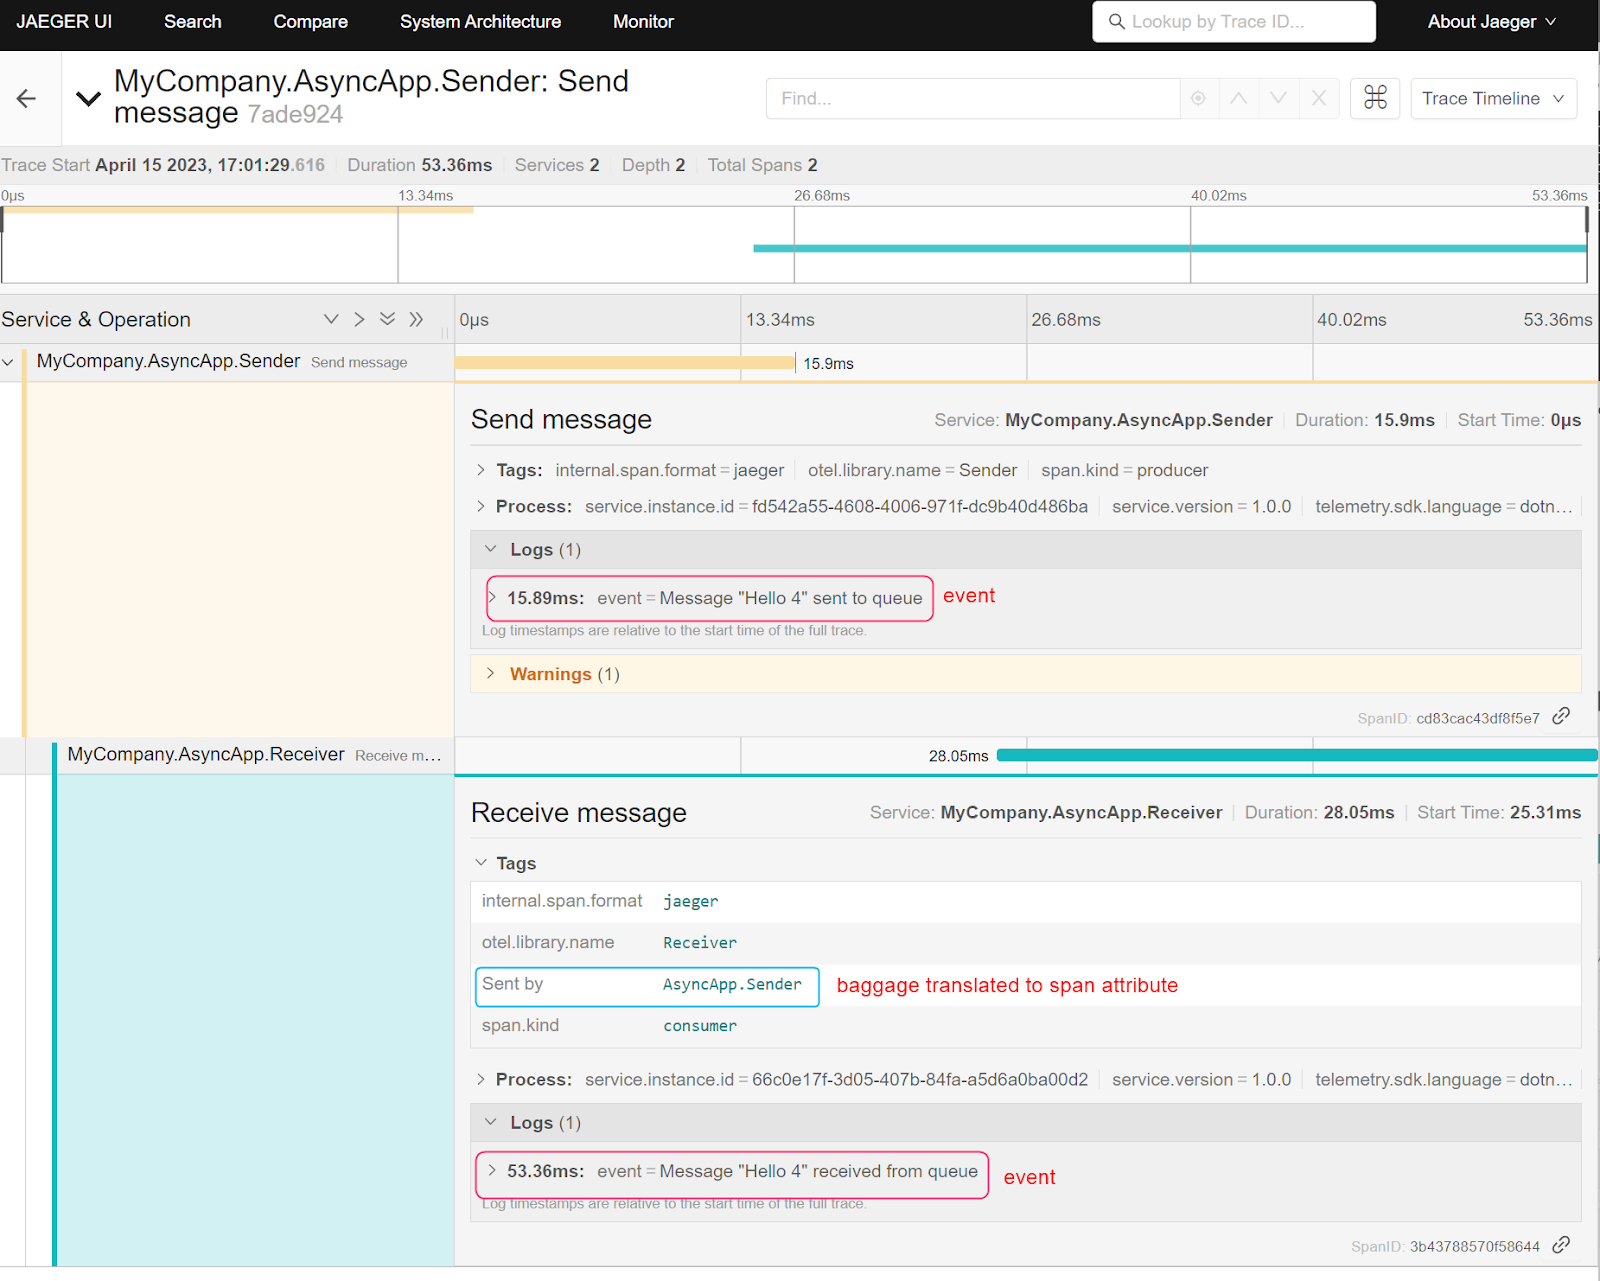
Among other information, you will find that the spans include the events generated by the applications when they produced and consumed the message. In addition, you will find the Baggage data propagated with the context from the Sender application recorded as attributes of the span.
Conclusion
In this article, you learned how to propagate OpenTelemetry context within asynchronous services using Azure Service Bus queues. You learned about context propagation and demonstrated how to instrument applications with OpenTelemetry, configure propagators, inject and extract context information, and export traces to Jaeger.
By following these steps, you can effectively pass the OpenTelemetry context between your services. This will enable you to gain a deeper understanding of your distributed systems' performance and behavior. You can use this knowledge to diagnose problems, optimize performance, and improve the application's reliability.
Related Resources
Twilio Docs
From APIs to SDKs to sample apps
API reference documentation, SDKs, helper libraries, quickstarts, and tutorials for your language and platform.
Resource Center
The latest ebooks, industry reports, and webinars
Learn from customer engagement experts to improve your own communication.
Ahoy
Twilio's developer community hub
Best practices, code samples, and inspiration to build communications and digital engagement experiences.