What’s in your Pocket? Visualizing your Reading List with Python
Time to read: 7 minutes
September 01, 2017
Written by

I’m going to give you a little bit of a spoiler alert: I’ve read the equivalent of about 14 books this past year. Now I’m not a cover-to-cover novel reading person — I consume most of my content in the form of articles and tutorials. So while I’m feverishly reading all the time I never have a sense of how much I’m actually reading. After all it’s not like I’m exactly keeping track of how many articles I’m reading.
But I could! What I didn’t mention is that my reading flow is almost completely through Pocket. For those of you who don’t know, Pocket is a convenient way to save content (whether that be in the form of articles, video, etc) for later use. This is especially important to me because it gives me an easy way of viewing content while I don’t have internet service. In other words, when I’m on the NYC subway.
Since I always save what I read to Pocket, I can use their API to pull my archive data. With this data, we’ll run through a simple analysis and wordcloud visualization.
Environment Setup
This guide was written in Python 3.6. If you haven’t already, download Python and Pip. Next, you’ll need to install the dependencies we’ll use which are nltk a natural language processing toolkit for Python, the Pocket API helper library and wordcloud, a simple wordcloud visualization creator:
Since we’ll be working with Python interactively using the Jupyter notebook is the best way to get the most out of this tutorial. Once you have your notebook up and running by running the command jupyter notebook in your terminal, you’re good to go!
A Quick Note on Jupyter
For those of you who are unfamiliar with Jupyter notebooks I’ve provided a brief review of which functions will be particularly useful to move along with this tutorial.
In the image below you’ll see three buttons labeled 1-3 that will be important for you to get a grasp of — the save button (1), add cell button (2), and run cell button (3).
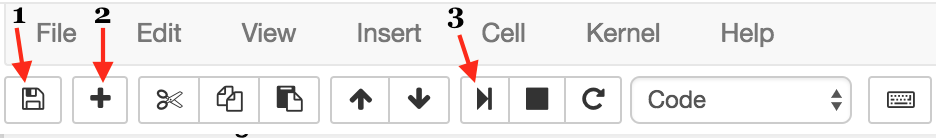
The first button is the button you’ll use to save your work as you go along (1). I won’t give you directions as to when you should do this, but generally I try to save about every 10 cells.
Next, we have the “add cell” button (2). Cells are blocks of code that you can run together. These are the building blocks of Jupyter notebook because it provides the option of running code incrementally without having to to run all your code at once. Throughout this tutorial you’ll see lines of code blocked off — each one should correspond to a cell.
Lastly, there’s the “run cell” button (3). Jupyter notebook doesn’t automatically run your code for you; you have to tell it when by clicking this button. As for add button, once you’ve written each block of code in this tutorial onto your cell, you should then run it to see the output (if any). If any output is expected, note that it will also be shown in this tutorial so you know what to expect. Make sure to run your code after each cell because many blocks of code in this tutorial rely on previous cells.
Pocket API
We’ll be using the Pocket API, which requires you first have an account. If you don’t already have one you’ve been missing! Sign up on their homepage here. This tutorial does become more exciting as you add more and more content. If you’re a new user that’s okay! It’s up to you whether you want to add anything.
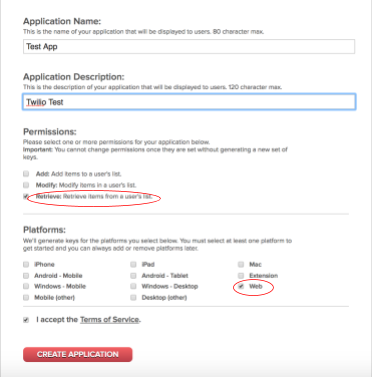
Using this link we’ll make an application and generate API keys. You can name it whatever you want, but the platform we’ll be using is Web. For the purposes of this tutorial, we’ll also only need retrieval permission, but if you want to add more functionality for future reference, feel free!
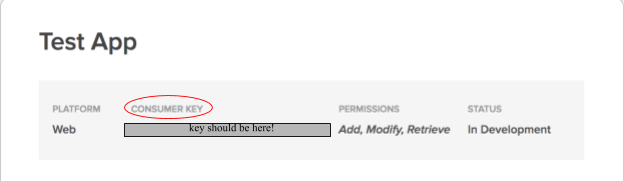
Clicking Create Application should redirect you to a My Applications page. Click on the application you just created, which will redirect you to a new page that contains your Consumer Key right at the top, as shown below.
Next we need a request key to ultimately retrieve our access token. In your Jupyter notebook start by using the requests module to handle this through a POST request.
The tricky part here is making sure the json is set correctly. Below you’ll see that you need the Consumer Key we retrieved earlier.
This post request outputs the request key which we’ll print with pocket_api.text.
Run the notebook and you should see output text of the format:
code=your-code-here
We’ll use this request code to retrieve the access_key we’ll soon encounter. But first copy and paste a URL of this format into your browser. This authorizes pocket to generate an access_key for you. Make sure to replace [Your-Request-Code] with the code we just generated above.
https://getpocket.com/auth/authorize?request_token=[Your-Request-Code]&redirect_uri=https://google.com
Great! Just a couple of more steps and we’re ready to go. Just as before make sure to replace your keys in the json below.
To get the access code, we have one final step – posting it with pocket_auth.text:
Again, when you run the notebook, this should have output text of the format below. Make sure to key this token handy — you’ll need it to get started with this tutorial.
access_token=[Your-Token-Here]&username=pocket-username
Getting Started
Assuming you’ve successfully generated your pocket API keys you can call the pocket client to begin. Your keys are associated with your account so these are what will provide you with the data needed for this exercise.
If you look at the pocket documentation, you’ll see that the get() method has a few parameters you can utilize. For the purposes of what we’re trying to do we’ll set the parameters since and state. since allows us to select a date from which to pull data and since we’re trying to figure out how much we’ve read this year so far we’ll set state to archive.
If we print this get request, we’ll see that it returned a tuple:
The second element of the tuple is just information about the GET request so it’s not necessarily needed for this exercise. The first element however is a dictionary that contains information on the get request and more importantly, the metadata for each read article. Within this dictionary we actually only need the dictionary stored as a value to the “list” key. For simplicity we’ll set this dictionary to a variable:
Before we continue on, let’s take a look at what this json format is for my account. Note: If you just opened up a new account, you won’t have any data. I recommend adding a few articles for the purpose of this tutorial.
Shown above is just one of the articles in the data. I’ll highlight a few parts: The main key is the ID for each element (1781427846 above).
Within the dictionary that serves as the value to this key are a couple of keys that will be important for this exercise. First we have word_count which will help us keep track of total word count. Next we have the given_title, which is the cleaned version of each article title.
Before we move on, let’s review what we’re going to accomplish:
- estimate about how many books you read so far this year
- make a word cloud based on the titles of read content
Given this, we’ll begin by starting a count for all the words read and a string that will consist of every single title in our pocket archives.
Now we’re ready to continue with our analyses. As we iterate through the dictionary by IDs we’ll check to see if the word_count and given_title key words exist. If they do we’ll add the word count to the words parameter and concatenate the string to the words2 string.
According to Huffington Post the average book contains about 64,000 words. To estimate the number of books we’ve read this year so far we’ll take the total word count and divide it by 64,000.
As I said before, according to my Pocket data I’ve read about 13.7 books this year!
What are you reading?
Python has a library wordcloud that provides functions to generate an image of our most frequent words in a given text. Using the string of every single title we’ve put together we can use wordcloud to create a wordcloud visualization.
Notice we also imported STOPWORDS from the wordcloud module. These are to keep from visualizing words like “the”, “and”, “or” from appearing in the wordcloud. Words like these will clearly occur frequently but provide no insight as to what topics we’re reading about. So the built-in set of stop words will be removed from the final wordcloud visualization:
Often times the titles of articles contains the name of the publication. Since I read The New Yorker, Medium, and New York Times, I decided to just remove them.
This might be hard to believe but now we can initialize the wordcloud object! This object is what represents the image we’ll use matplotlib to output.
As a last step for creating the wordcloud object we fit the model to the string of all titles:
And finally we invoke matplotlib to display our image. For this example we won’t do any special customization but in case you’re interested in how to go about doing this check the documentation.
And as though it wasn’t glaringly obvious before I read lots of articles and posts about Python, Data Science, and Machine Learning. Go figure.
Wrapping it up
In this tutorial we used the Pocket API and a wordcloud to analyze what our everyday content consumption looks like. For me that meant highlighting that I spend a good portion of my time learning or improving upon topics that fall under the realm of data science. While this is my particular wordcloud visualization anyone can complete the same task so long as you have a Pocket account!
If you liked what we did here, follow me (@lesleyclovesyou) on Twitter for more content, data science ramblings, and most importantly, retweets of super cute puppies.
Happy reading!

Related Resources
Twilio Docs
From APIs to SDKs to sample apps
API reference documentation, SDKs, helper libraries, quickstarts, and tutorials for your language and platform.
Resource Center
The latest ebooks, industry reports, and webinars
Learn from customer engagement experts to improve your own communication.
Ahoy
Twilio's developer community hub
Best practices, code samples, and inspiration to build communications and digital engagement experiences.