Using The Node.js Debugger For Fun And Profit
Time to read:
June 21, 2016
Written by
This post is part of Twilio’s archive and may contain outdated information. We’re always building something new, so be sure to check out our latest posts for the most up-to-date insights.

Did you know that Node.js has a built in debugger? I didn’t until a few months ago. Check out how it can make debugging your code a breeze.
To follow along at home you’ll need:
First let’s write some code to debug. We’re going to sum the contents of an array with a for loop.
Paste the following into a file named index.js.
Running this with node index.js you’ll see NaN printed out.

Instead of smashing our faces against the keyboard let’s run the file through the Node.js debugger by passing node the debug keyword.
The debugger will load up the file and enter in a paused state or rather reach an initial breakpoint. If you’ve ever used GDB before you should feel right at home and if you haven’t you’re about to see how powerful debuggers can be.
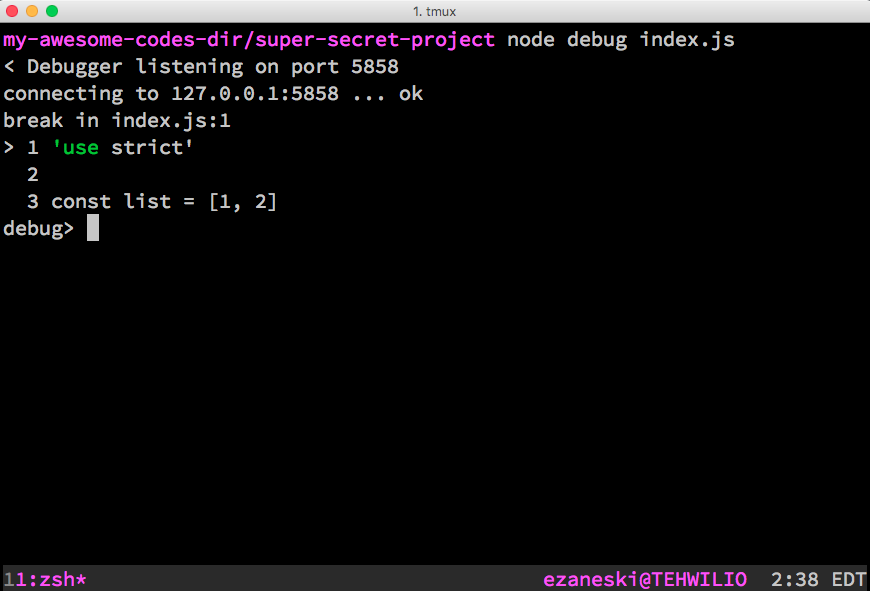
Set a breakpoint inside the loop on line 7.
Since our breakpoint is inside a loop our program will pause on each pass. Let’s set some watchers on the variables we care about. Watchers will print out the variable each time a breakpoint is reached.
Now we tell the debugger to continue with execution.
We hit our breakpoint and see the values of our watched variables printed out.
The values appear to be correct. Let’s continue forward with the shortcut c.
This is still correct. We should now leave the loop and print the total. Let’s continue.
Woah hold on a second. There’s our NaN and what is that undefined there. Also, why did we run this loop again? Let’s print out the length of the list. We can use exec to execute a string of JavaScript while in the debugger.
Oops! We made the mistake of using <= instead of <. There might not be a lot of code here but I bet you can recall a bug that you’ve dealt with where stepping through and looking at the variables would have caught it.
In The Real World
Next let’s look at a real world example. Say you are using Twilio to receive an SMS for the first time and haven’t yet looked at our beautiful new docs to see what the payload will look like.
Instead of inspecting things with iterative console.log statements, we can set a breakpoint and drop into a magical REPL in the middle of our executing program.
Replace the contents of index.js with the following basic Express app that receives a POST request from Twilio. We can set a breakpoint via our code by adding debugger where we’d like – this will be ignored when not using the debugger.
Next install the dependencies.
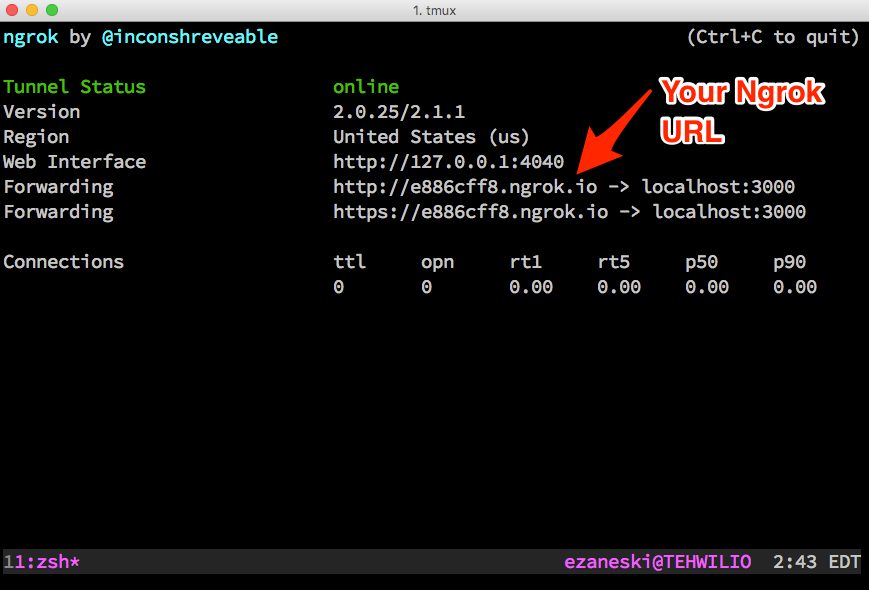
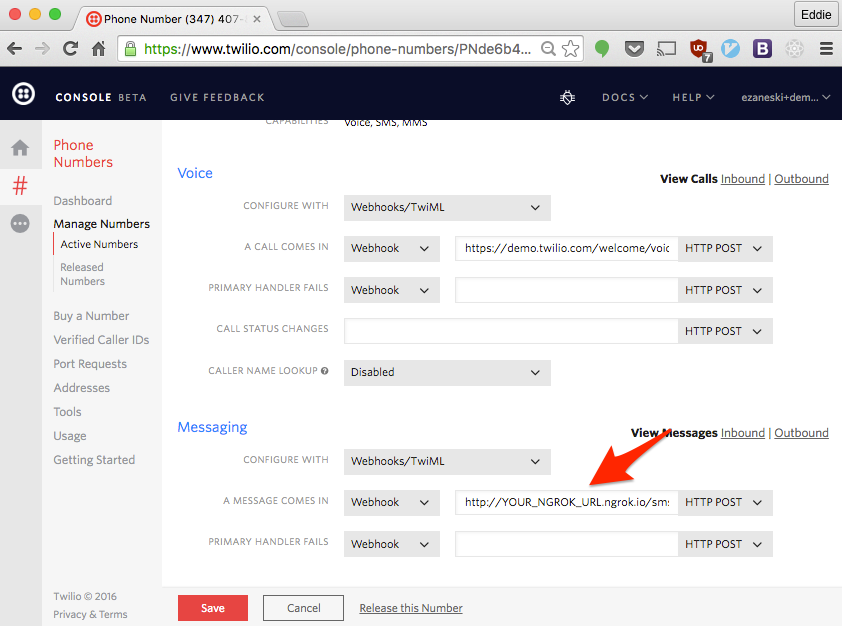
Start Ngrok on port 3000 and configure your Twilio phone number to POST incoming messages to http://YOUR_NGROK_URL.ngrok.io/sms. If you haven’t used Ngrok before my buddy Phil has a great post about why you’ll love using it to test webhooks.
Fire up the app in debug mode and tell the debugger to continue past its initial breakpoint.
Send a text message to your Twilio phone number and watch as the breakpoint gets triggered. We’ll actually be paused with an open HTTP connection. Type repl to drop into a REPL of your paused application.
The request will stay open for about 15 seconds so if you’re quick enough you can actually send a reply text by responding to Twilio. Since we set the Content-Type header to text/plain any text we send back will automatically be sent as an SMS.
You might need to trigger the request again if you receive an error. Don’t forget the initial continue.
Wrap Up
Using the built in Node.js debugger gives you absurd control and introspection into your code.
Before I learned about the debugger I was running my code several times with different console.log statements. Now I drop into it often to test webhooks or the response bodies of API requests.
Being able to just poke around and write lines of your application in a REPL is extremely productive.
Let me know if you find a creative use for the debugger in your own code.
Related Resources
Twilio Docs
From APIs to SDKs to sample apps
API reference documentation, SDKs, helper libraries, quickstarts, and tutorials for your language and platform.
Resource Center
The latest ebooks, industry reports, and webinars
Learn from customer engagement experts to improve your own communication.
Ahoy
Twilio's developer community hub
Best practices, code samples, and inspiration to build communications and digital engagement experiences.