How to Export Logs to Azure Monitor with OpenTelemetry and .NET
Time to read: 4 minutes
March 14, 2023
Written by
Reviewed by

In the first part of this series, you learned how to build an effective logging pipeline with OpenTelemetry in .NET. In this second part, you will learn how to transport logs to Azure Monitor using OpenTelemetry. This article will guide you through the process of setting up Azure Monitor, installing the OpenTelemetry exporters for Azure Monitor, configuring OpenTelemetry to transport logs to Azure Monitor, and viewing logs in Azure Monitor.
What is Azure Monitor
Azure Monitor is a cloud-based monitoring and analytics service offered by Microsoft Azure. It provides a comprehensive solution for monitoring, diagnosing, and analyzing the performance and behavior of your applications and infrastructure. Azure Monitor allows you to collect telemetry data from various sources, including Azure resources, on-premises applications, and third-party services. After collection, the data can be visualized, analyzed, and acted upon using powerful tools and features like dashboards, alerts, and machine learning-based insights. Azure Monitor supports multiple monitoring scenarios, including application performance management (APM), infrastructure, and network monitoring. It also integrates with OpenTelemetry, Application Insights, Log Analytics, Azure Sentinel, Grafana, and more for data collection and visualization.
The diagram below (source: Microsoft) illustrates the components of Azure Monitor.
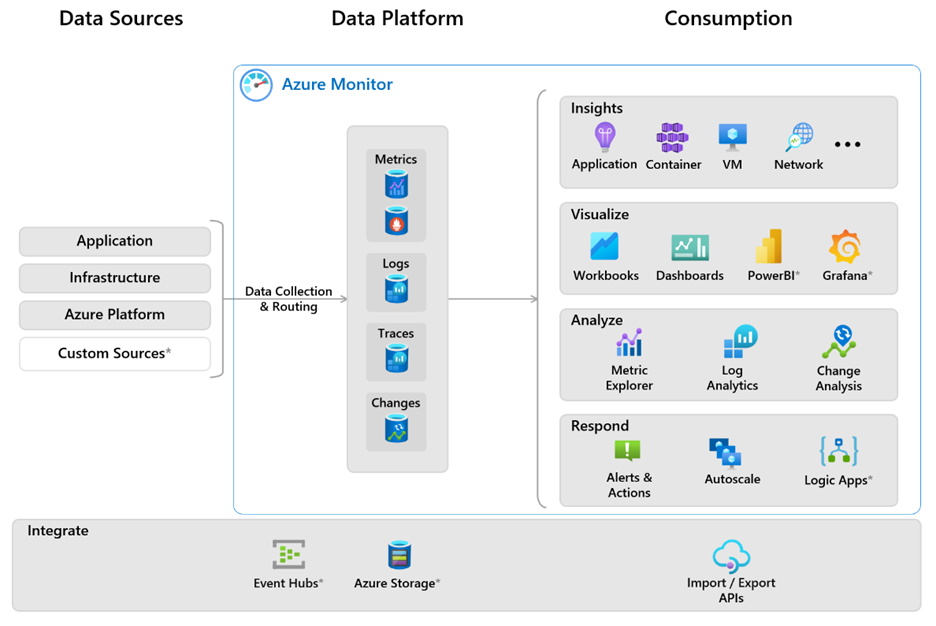
As shown in the diagram, Azure Monitor has the following components:
- The data sources are the source of telemetry data produced by the monitored resources. The data is collected and routed to the data platform.
- The data platform includes data stores for metrics, logs, traces, and changes, enabling users to store different types of telemetry data.
- The consumption platform includes the functions and components that consume the data from the data stores for analysis, visualizations, insights, and responses.
- The integration platform contains services integrating with Azure Monitor to provide additional functionality, such as data export, and archival.
Benefits of using Azure Monitor for log storage
Some of the most important benefits of using Azure Monitor as the telemetry backend for logs are as follows:
- You can use a direct exporter to send telemetry data in-process (from the application’s code) directly to Azure Monitor ingestion endpoint.
- You can use OpenTelemetry protocol (OTLP) to send telemetry data to Azure Monitor using a standard format that is compatible with other vendors.
- You can process your logs in the cloud using Azure Data Explorer (ADX) and apply advanced analytics and machine learning to draw insights from the logs.
- You can reduce the cost of storing high volume verbose logs by using compression and retention policies.
- You can archive your logs for long-term security and compliance using Azure Storage.
- You can use your logs with additional tools such as Microsoft Sentinel, Microsoft Defender for Cloud, Grafana, etc. for actions, analytics, and visualization.
Consider using Azure Monitor as your telemetry storage and analytics solution if your requirements match the benefits of the service. Let's proceed to integrate the demo application with Azure Monitor to store and analyze the logs telemetry.
Setting up Azure Monitor
Before you can transport logs to Azure Monitor, you need to set up an Azure Monitor Application Insights resource. You can refer to the Microsoft guide for instructions on how to create an Application Insights resource. In the screenshot below, you can see an example of the Application Insights setup wizard with the settings populated:
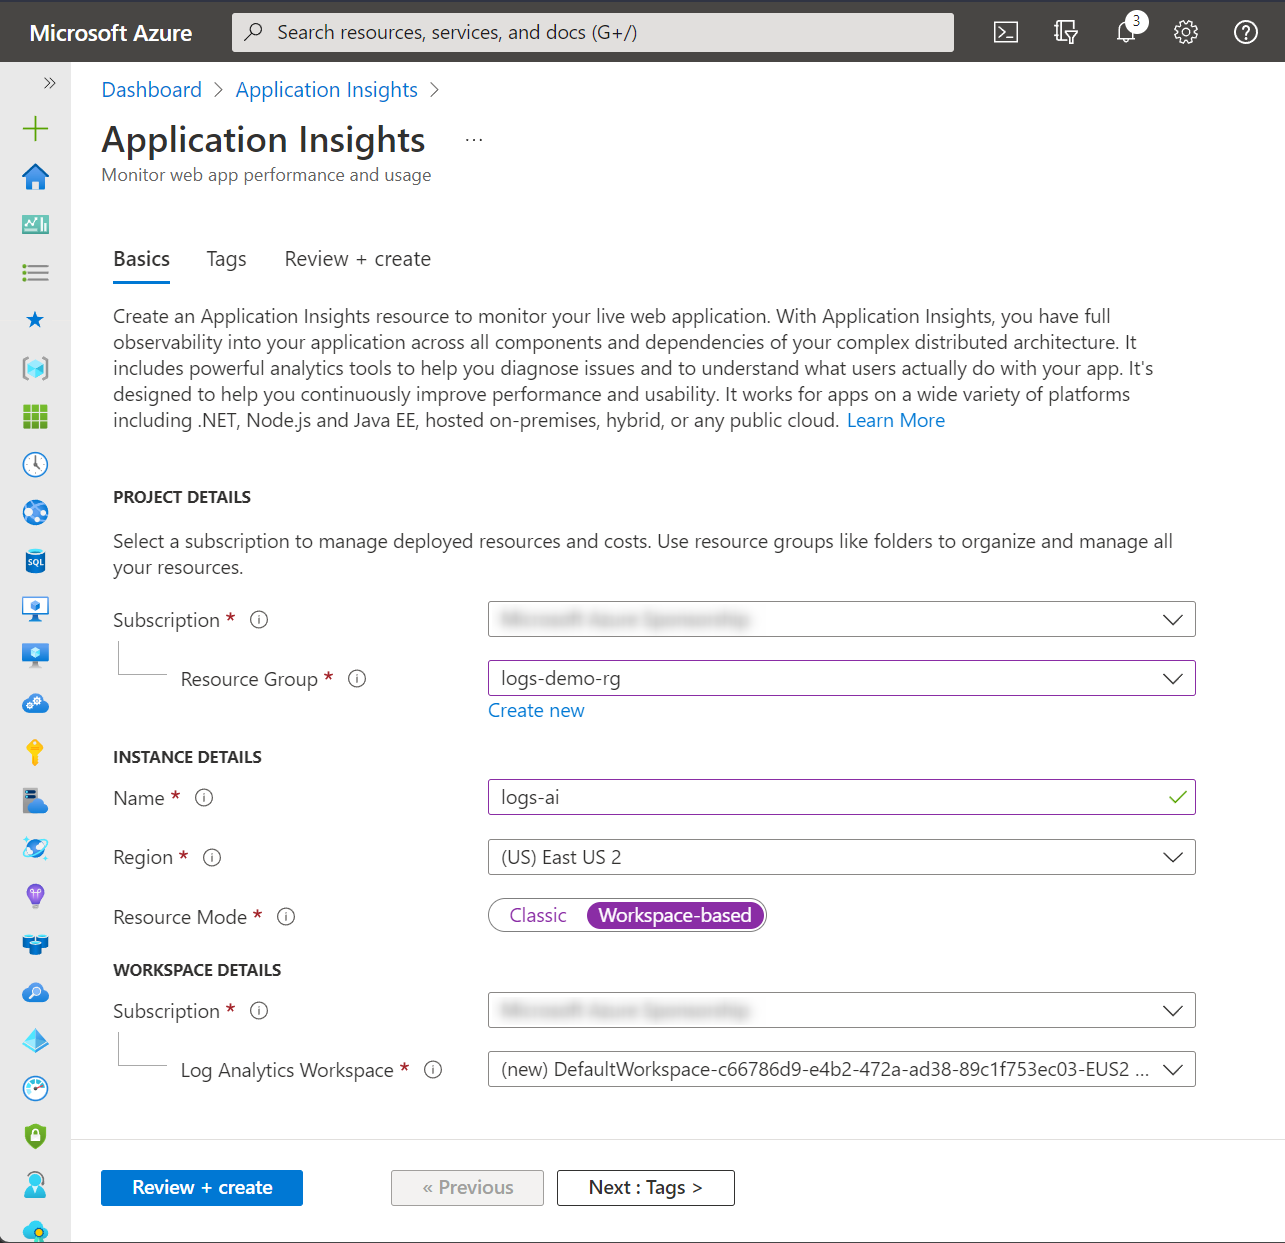
When creating the Application Insights resource, make sure to set the Resource Mode to Workspace-based. Workspace-based Application Insights is a newer mode that integrates with Azure Monitor and Log Analytics, while classic Application Insights is an older mode that does not. Classic Application Insights will be retired soon.
Once your Application Insights resource is set up, you can proceed to install the OpenTelemetry exporters for Azure Monitor.
Installing Azure Monitor Exporter
OpenTelemetry provides an exporter for Azure Monitor that allows you to transport your application logs to Azure Monitor. First, reopen the demo application (reference implementation available on GitHub repository) that you built in the previous exercise in your IDE. You can use the following command to clone the application in the same state as it was at the end of the previous exercise:
After your application is ready, you can install the Azure Monitor exporter using the following command in the Package Manager Console:
Alternatively, you can install the package using the NuGet Package Manager in Visual Studio or JetBrains Rider.
To configure OpenTelemetry to transport logs to Azure Monitor, you need to add the Azure Monitor exporter to your logging pipeline. Here's how you can add the exporter to the demo application:
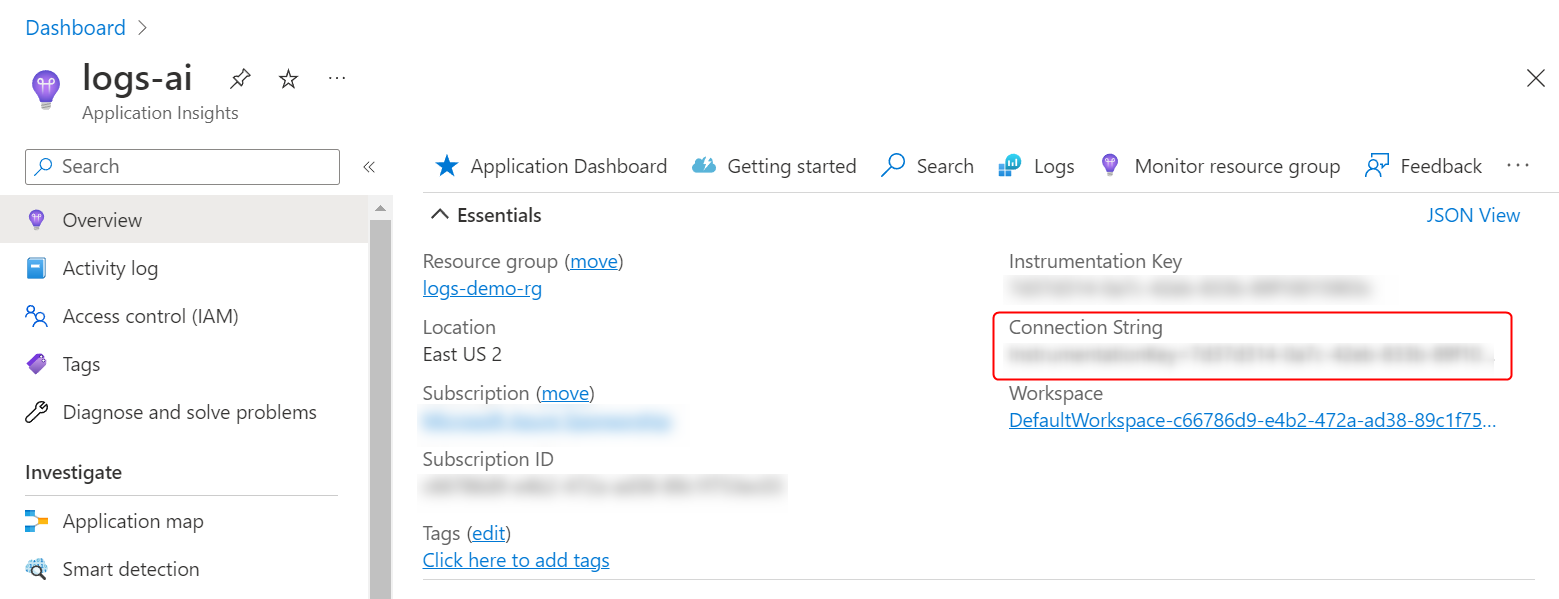
You now have two exporters sending logs to Azure Monitor and the application console. The Azure Monitor exporter requires a connection string for the Application Insight resource. You can find this value in the Overview pane of the Application Insight resource, as shown below:
The code is pulling the connection string from the AzureMonitorConnectionString configuration element. To configure this without putting it directly into your source code, use the user-secrets commands to initialize the user-secrets and configure the secret:
To generate logs, relaunch the application and send HTTP requests to the default and the /login endpoint as you did in the previous exercise.
Once again, you should be able to view the logs in the application console.
Viewing Logs in Azure Monitor
Once you have configured OpenTelemetry to transport logs to Azure Monitor, you can view your logs in the Log Analytics service in Azure portal. To do this, follow these steps:
- Log in to the Azure portal and navigate to your Application Insights resource.
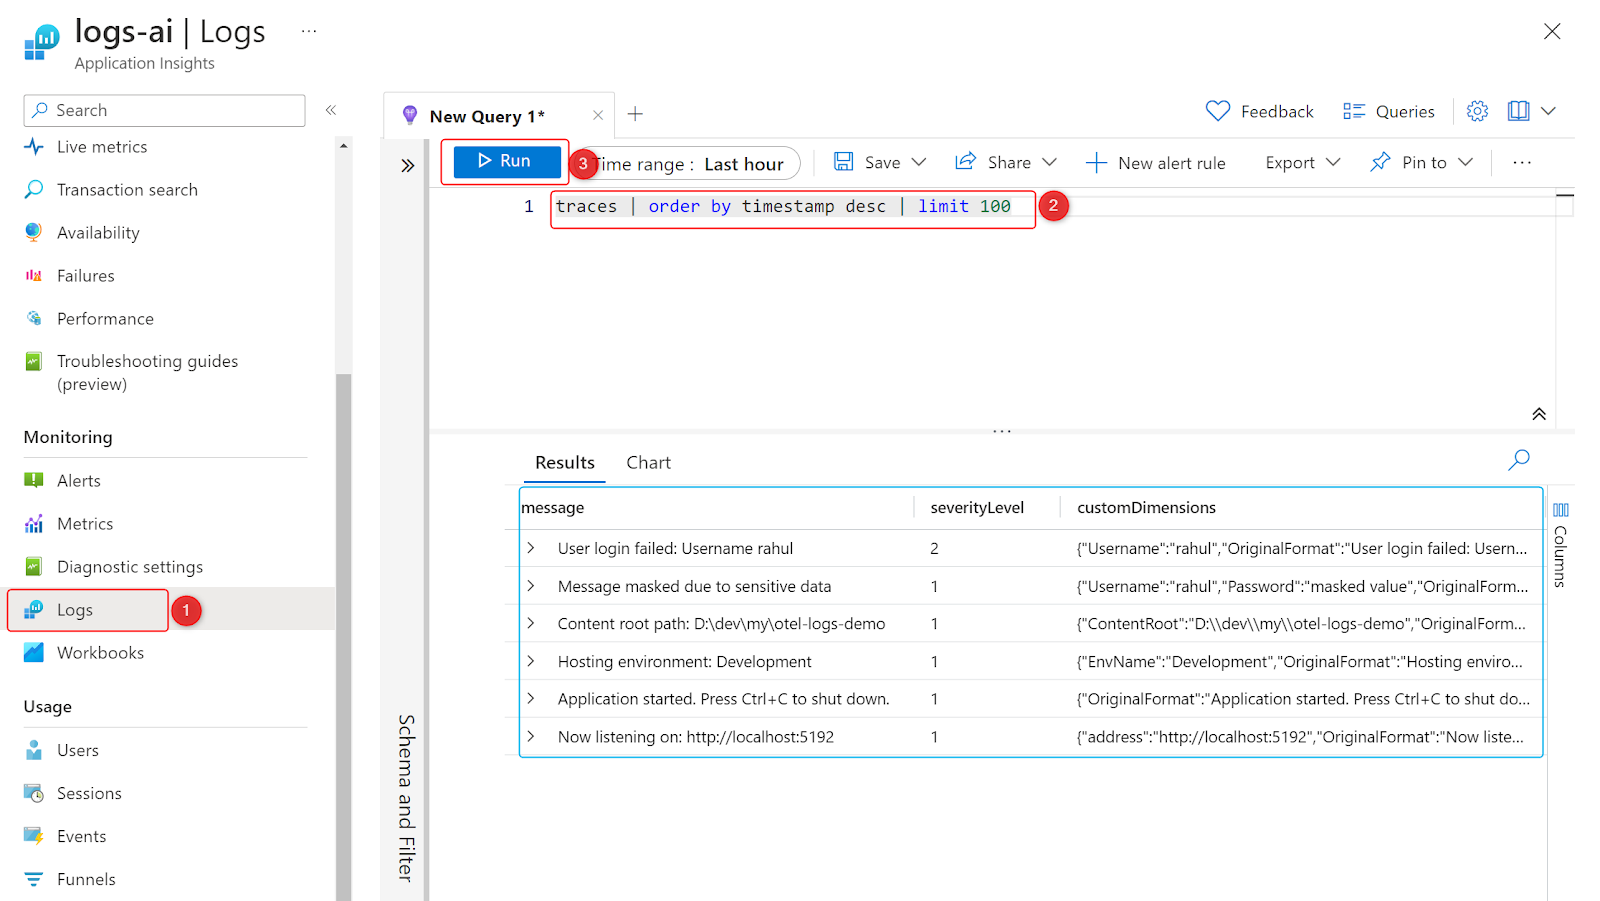
- Click on the "Logs" tab, and then in the query editor, enter the following query to view your logs:
This query will show you the most recent 100 logs recorded from your application, ordered by time generated. You can modify the query to filter by specific log levels, time ranges, and other criteria. An example of logs received from the application is shown in the screenshot below:
To avoid unnecessary costs, please delete the resources from your Azure subscription after you have completed the exercise.
Conclusion
In this article, you learned how to transport logs to Azure Monitor using OpenTelemetry in .NET. By setting up an Azure Monitor Application Insights resource, installing the OpenTelemetry exporter for Azure Monitor, and configuring OpenTelemetry to transport logs to Azure Monitor, you can gain valuable insights into your application's performance and behavior. With Azure Monitor, you can easily visualize and analyze your logs to identify issues and optimize your application's logging strategy.
Next, check out this tutorial on how to automatically instrument containerized .NET applications with OpenTelemetry.
Outside of his day job, Rahul ensures he’s still contributing to the cloud ecosystem by authoring books, offering free workshops, and frequently posting on his blog: https://thecloudblog.net to share his insights and help break down complex topics for other current and aspiring professionals.
Related Resources
Twilio Docs
From APIs to SDKs to sample apps
API reference documentation, SDKs, helper libraries, quickstarts, and tutorials for your language and platform.
Resource Center
The latest ebooks, industry reports, and webinars
Learn from customer engagement experts to improve your own communication.
Ahoy
Twilio's developer community hub
Best practices, code samples, and inspiration to build communications and digital engagement experiences.