SQLite or PostgreSQL? It's Complicated!
Time to read: 12 minutes
June 27, 2022
Written by
Reviewed by

We take blogging very seriously at Twilio. To help us understand what content works well and what doesn’t on our blog, we have a dashboard that combines the metadata that we maintain for each article such as author, team, product, publication date, etc., with traffic information from Google Analytics. Users can interactively request charts and tables while filtering and grouping the data in many different ways.
I chose SQLite for the database that supports this dashboard, which in early 2021 when I built this system, seemed like a perfect choice for what I thought would be a small, niche application that my teammates and I can use to improve our blogging. But almost a year and a half later, this application tracks daily traffic for close to 8000 articles across the Twilio and SendGrid blogs, with about 6.5 million individual daily traffic records, and with a user base that grew to over 200 employees.
At some point I realized that some queries were taking a few seconds to produce results, so I started to wonder if a more robust database such as PostgreSQL would provide better performance. Having publicly professed my dislike of performance benchmarks, I resisted the urge to look up any comparisons online, and instead embarked on a series of experiments to accurately measure the performance of these two databases for the specific use cases of this application. What follows is a detailed account of my effort, the results of my testing (including a surprising twist!), and my analysis and final decision, which ended up being more involved than I expected.
Porting the application to PostgreSQL
The first step that I took was to make sure that I can easily reconfigure the application to use SQLite or PostgreSQL, as this would allow me to run side-by-side comparisons. So I installed PostgreSQL on my Mac laptop to get things working in development.
Adapting the code so that it is compatible with PostgreSQL was relatively easy to achieve because this application uses SQLAlchemy, an ORM library for Python that allows the developer to create schemas and queries using mostly database-independent Python constructs. By making the database connection URL configurable I made it possible to switch between postgresql:// and sqlite:// URLs. The Python code did not need any modifications, as the differences between these databases were handled internally by SQLAlchemy. SQLAlchemy even created all the tables and indexes on my new PostgreSQL database, exactly as they were in SQLite.
To enable the application to fully work with PostgreSQL, I also needed to migrate the data currently stored in the SQLite database. I used pgloader, a fairly complete open source script that imports data from several sources into a PostgreSQL database. Luckily, SQLite is one of the supported data sources.
The easiest way to import data with pgloader is to create a configuration file that defines the source, the destination and the options. Here is the one that I’ve made:
The only option that I used is data only, which tells pgloader to not create any tables or indexes, just move data from the source to the destination databases. This is important, because I wanted to have the database schema as close as possible to the SQLite one, and the best way to do that is to let SQLAlchemy create all the tables and indexes.
To perform the data migration, pgloader is invoked with the name of the configuration file as its only argument:
After a couple of tries, the import process worked without a hitch. The initial failed attempts alerted me of a couple of potentially serious issues I had in my database design, which SQLite decided not to report or care about:
- For the article slugs, I have defined a 256 long
VARCHARcolumn. The data migration failed for four articles that had slugs that were longer than the maximum. SQLite, with its unusual typing system, did not care and stored the longer slugs without complaining. PostgreSQL has strict enforcing of its column types, so these four posts could not be migrated. The solution was to grow theslugcolumn to 512 characters and retry. - Also related to typing, one of my tables initially had integer primary keys, but at some point I decided to change these keys to UUID strings. When I made this change in SQLite I migrated the table by hand, and didn’t realize that I left the primary key column on this table defined as
integer. Once again, SQLite happily stored my UUIDs on this column and even indexed them, but to get these across to PostgreSQL I needed to fix the schema and properly declare these keys as strings.
At this point, with relatively low effort, I could switch between equivalent SQLite and PostgreSQL databases just by editing the database URL in a configuration file and restarting the Python server.
I manually tested some queries on my development laptop and felt everything was faster with the PostgreSQL database, which was an encouraging first impression.
Creating a performance test
My next task was to create a test that is automatable and repeatable, so that I can then test the system under both databases and determine which one wins. Simple, right?
Unfortunately, designing a test that covers all the ways this system can be used is very challenging because of the large number of possibilities, as I designed it to let the user create a lot of different queries. For example, it allows the user to obtain traffic stats over a period of time that can cover days, weeks or even years, and categorize the results by article, author, team, product, computer language, written language or publication year. The user can also split the traffic results by country of origin. When retrieving articles, the user can opt to see all the translations of an article grouped with the original. For all queries, the user can filter in or out a section of the data set, given by any combination of authors, teams, products, computer languages, written languages, or publication dates. And all of this can be done for the Twilio or SendGrid blogs, or for both blogs combined.
To avoid going down a rabbit hole, I decided to concentrate on the most common use cases, so I created a list of API requests that represents them. Here is the list that I came up with:
These URLs then need to be completed with additional query string arguments. The start and end arguments are required in all queries, as they specify the period of time that is requested. I’ve found that this has a big influence on response times, so my plan was to try different period lengths.
There are a large number of query string arguments that can be used to implement filters. The blog argument that I’ve included in the URLs above selects the Twilio blog, which is the one with the most traffic. I decided not to complicate my testing with other filters, because from looking at usage logs I noticed that most queries by users do not include any.
Armed with this list, I created a short Python function that runs through these queries and records how long each query took in a results dictionary:
The test() function makes a copy of the requests list, reorders it in a random way, and then runs the request with curl as a subprocess. It uses the timeit() function from the Python standard library to measure the time it takes for each query to return a response, and adds this measurement to the results dictionary, under the corresponding URL.
The reason I’m randomizing the list is that I intend to run multiple instances of this function in parallel to simulate concurrent clients. Having the function go through the queries in random order is convenient, as that ensures the database will have a variety of queries to work for at any given time, instead of receiving several instances of the same query.
The function receives the domain portion of the URL as the server argument. I wanted this to be easily configurable, so that I can switch between my development and production systems. An API key is also passed into this function, so that the requests can be authenticated. Finally, the required start and end query string arguments are passed in and added to the URL before making the request.
The results dictionary uses the URLs from the requests list as keys. For each key, I store an array of results and not just a single value, as this would allow me to record multiple runs for each query and get an average.
To complete my test script, I added a run_test() function and a command-line parser:
The run_test() function launches one or more threads, according to the num_threads argument. All the threads are configured to run the test() function in parallel. This simulates load coming from multiple concurrent clients, each going through the list of URLs in their own random order, to create some unpredictability.
After all the threads have ended, run_test() prints the average request time for each request URL, and also an average of all the queries combined, which is the metric I decided to use for my analysis.
The command-line arguments allow me to pass the server root, the API key and the start and end dates to query and the concurrency. With these controls I have the ability to test a variety of scenarios.
The test script is now ready, so it’s time to get some metrics!
Testing on the development system
The development system that I work on is a Mac laptop with 6 hyperthreaded cores and 16GB of RAM. The production environment for this dashboard is a Linode virtual server with 1 vCPU and 2GB RAM.
From past experiences with benchmarking, I know that results from a fast system are not always the same as a slower one, so my end goal is to test the production system and make decisions based on the results I get on that platform.
But before doing that, I wanted to do a first round of “practice” tests on my laptop, both as a way to ensure that the test script was working correctly, and also, why not admit it, because I was curious about how these two databases perform on a fairly powerful platform.
The testing methodology that I decided to use is as follows: I would test the system running under the two databases, for queries with periods of a week, a month, a quarter and a year, with all queries having 2021-01-01 as the start date. I would also repeat the tests with 1, 2 and 4 concurrent clients. For each individual test I would run the script three times, and record the best run of the three. The metric I would use is the total average of all queries.
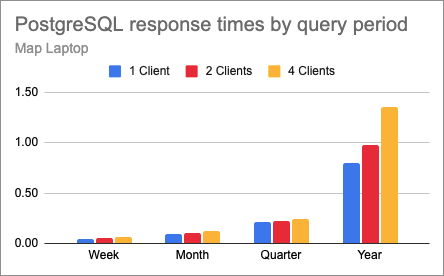
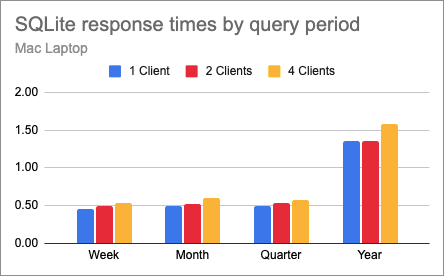
With this plan I ended up with 24 data points (2 databases x 4 query periods x 3 concurrency levels). The following chart shows the response time for PostgreSQL (blue) and SQLite (red), with a single client.
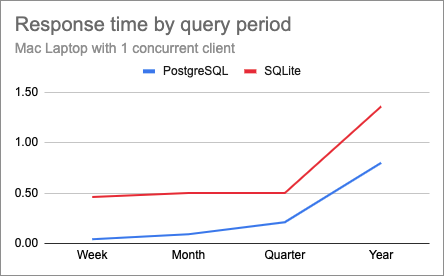
Here it is very clear that PostgreSQL returns results faster, and is especially efficient for shorter queries. PostgreSQL’s response times increase more or less linearly as the query period grows, but SQLite interestingly had a near flat response time on the first three tests and then suffered greatly on the last one.
Below are the charts for the same test with 2 and 4 concurrent clients.
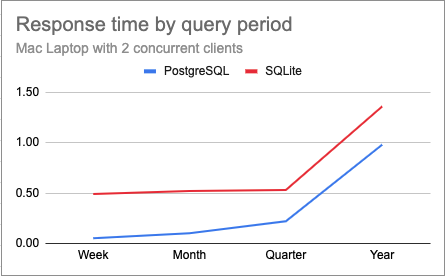
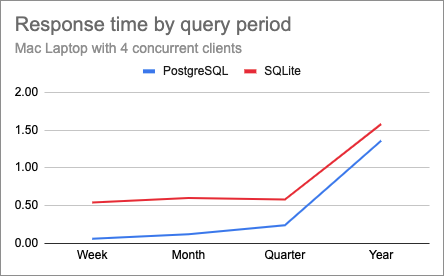
I thought it was interesting that changing the concurrency doesn’t appear to have a great impact on response times for most tests, likely due to the multiple cores I have on this laptop. The only case in which there is a difference is in the year-long queries, where PostgreSQL appears to suffer proportionally more than SQLite.
To help visualize this, below is a chart that shows the response times for the PostgreSQL tests, comparing the three levels of concurrency for each of the query periods.
This confirms that for queries involving a small or medium number of rows, a concurrency of up to four clients does not affect response times in a big way. But as the number of rows involved grows, a higher concurrency does start to slow things down.
Here is the same chart for SQLite:
And this is actually a surprise, because this shows that SQLite can handle concurrent loads much better than PostgreSQL on this system. Of course the response times are longer here, but the fact that concurrency has less of an effect on these response times is very interesting.
Will the production platform show similar results? My expectation is that a single CPU, compared to the 6 on my laptop, is going to make concurrency a much bigger factor in the results.
Testing on the production system
Armed with a now well tested benchmarking script, I booted a new Linode with a clone of the production system, repeated all the steps to migrate the SQLite database to PostgreSQL, and made sure that I can, once again, easily switch databases by editing the configuration file and restarting the service.
For this testing effort I decided to run the test script on my own laptop, so all the latencies involved in the traffic going over the Internet, encryption and proxying would be included in the results. I could have chosen to run the tests on the same host as the service and avoid these extra costs, but in the end, my goal is to make the service perform better for users, and users have no choice but to go through all these seemingly unrelated layers.
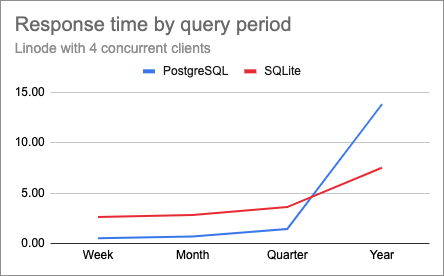
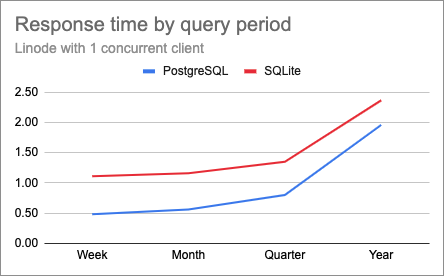
Here is the chart that I obtained when using a concurrency of one:
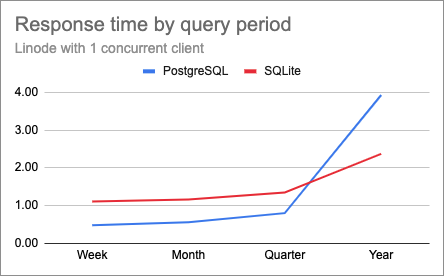
And this is a totally unexpected twist. The lines are crossing!
PostgreSQL beats SQLite on the short and medium length queries, but it has a lot of trouble with the year long query, which takes almost twice as long as SQLite. In case you are thinking that this must have been a fluke, I repeated these tests several times and confirmed that these results are actually correct.
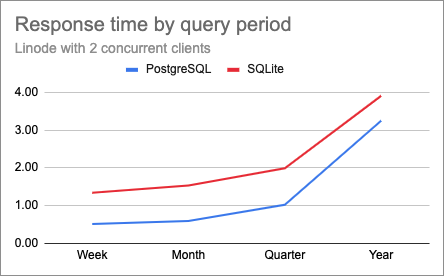
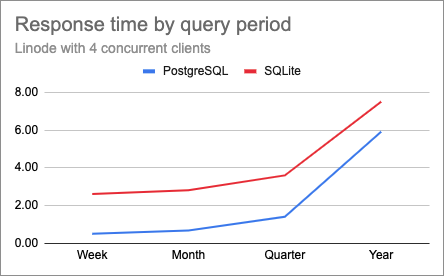
Here are the charts for 2 and 4 clients on this production server.
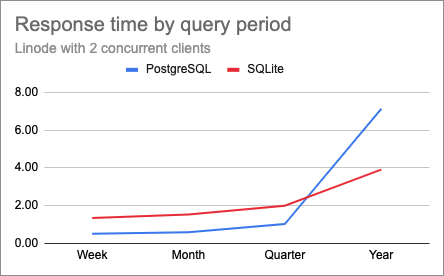
While the shapes of the curves are pretty much identical at all concurrency levels, you just need to look at the scale of the Y axes to see that on this platform, response times are much more affected by concurrency than my laptop. For the year-long query with four concurrent clients the response times were extremely slow, at about 14 and 8 seconds for PostgreSQL and SQLite respectively.
Are PostgreSQL and SQLite equally affected by concurrency? Let’s look at them separately to find out. The next chart shows how PostgreSQL did on the four period lengths with 1, 2 and 4 concurrent clients.
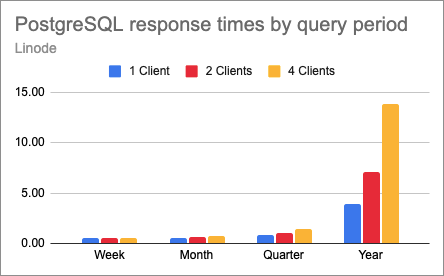
This shows that for this database, things get very much out of control for large queries, but for small and medium sized queries response times are relatively stable.
Below is the same chart for SQLite:
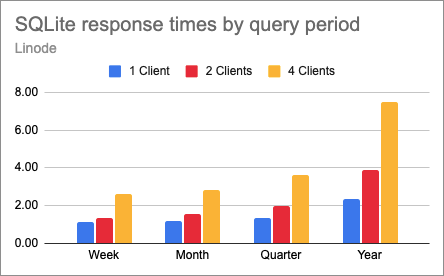
This paints a different picture, right? With a single CPU, concurrency in SQLite plays a role even for the small and medium sized queries. Response times grow less than linearly, but they always grow, even on the smaller tests.
To help me visualize these differences better, I created another set of charts. For each query period that I tested, the following charts compare the two databases at each concurrency point.
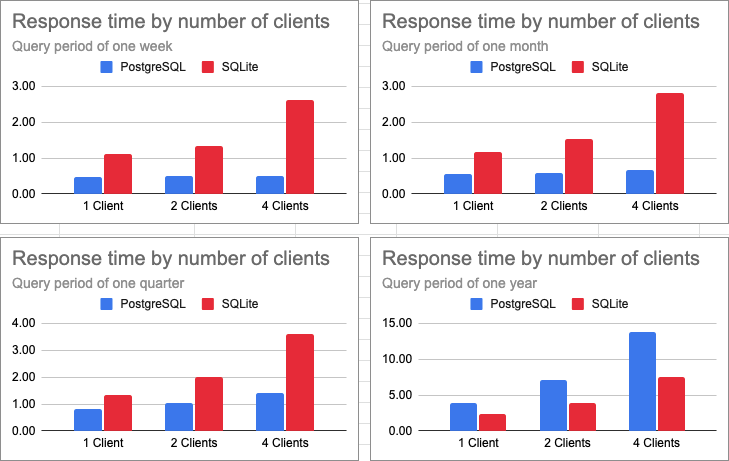
These charts clearly show that PostgreSQL can handle the small and medium queries much better than SQLite, to the point that increasing the concurrency has a very small effect in response times, which is great. SQLite, on the other side, is more directly affected by concurrency for all query sizes, and while it performs worse in the small and medium sized queries, it ends up significantly ahead of PostgreSQL for the longer queries.
Fine tuning for performance
Up until now, I have not worried about configuring the databases, I simply assumed the default configuration would be good enough. In the case of SQLite there isn’t much to configure, but PostgreSQL does have some tuning levers to play with.
After looking through the configuration options related to memory usage, I’ve found the work_mem option, which configures how much memory each query can use before it starts storing data in temporary disk files. The default for this option is 4MB. I changed it to 16MB:
The week, month and quarter tests had similar response times as before. But this change did improve the longer queries. Below are the charts for 1, 2 and 4 clients after I ran the year-long PostgreSQL tests again:
With this change, the lines uncrossed, and PostgreSQL started returning faster than SQLite even for the longer queries. For the heavier test with year-long queries and four clients, response times went from 14 seconds down to 6 with the memory-tuned database server. These queries are still slower than I would like, but considering I’m running on a low-end platform I think they are reasonable.
Conclusion
As I’m sure you can guess, after the results I obtained I decided to switch to PostgreSQL. After upgrading the production system, I informally asked a few users about performance and all thought the system was responding noticeably faster than before, so my mission was accomplished.
If you are going to take one thing away from this article, I hope it is that the only benchmarks that are valuable are those that run on your own platform, with your own stack, with your own data, and with your own software. And even then, you may need to add custom optimizations to get the best performance.
In terms of improving performance even further, this testing exercise leaves me with two possible avenues:
- If I get the budget, I now know that adding CPUs is likely to improve those longer tests. Switching to a dedicated server with 4 CPUs should make a considerable difference and bring response times closer to what I measured on my laptop.
- Without throwing additional money at the problem, the main area of improvement is in those longer queries, which could maybe be simplified if the database stored precalculated monthly totals in addition to the daily data. A year of traffic could then be retrieved from 12 rows per article instead of 365. Some of the savings will be offset by more complex logic when queries are not aligned on month boundaries, but overall this should reduce the longer query times.
I hope you found some new ideas in this article, and you are encouraged to benchmark and optimize your own projects!
Miguel Grinberg is a Principal Software Engineer for Technical Content at Twilio. Reach out to him at mgrinberg [at] twilio [dot] com if you have a cool project you’d like to share on this blog!


Related Resources
Twilio Docs
From APIs to SDKs to sample apps
API reference documentation, SDKs, helper libraries, quickstarts, and tutorials for your language and platform.
Resource Center
The latest ebooks, industry reports, and webinars
Learn from customer engagement experts to improve your own communication.
Ahoy
Twilio's developer community hub
Best practices, code samples, and inspiration to build communications and digital engagement experiences.