Introducing The New Developer Experience From Twilio
Time to read: 3 minutes
May 23, 2016
Written by

We’re delighted to share the reimagined experience of developing on Twilio. A new end-to-end experience for prototyping, building and debugging Twilio apps, our aim with the new Twilio Console, Documentation and Debugger is to accelerate your speed with cutting Twilio code faster than ever before.
After watching one million developers work with the Twilio platform, we’ve learned a lot about what information is important in a developer’s journey and when it is the most critical in the craft of software. The new experience we’ve designed focuses on the moments when a developer is using Twilio for the first time, getting the app into production and troubleshooting inevitable bugs.
Get What You Need Faster With Console
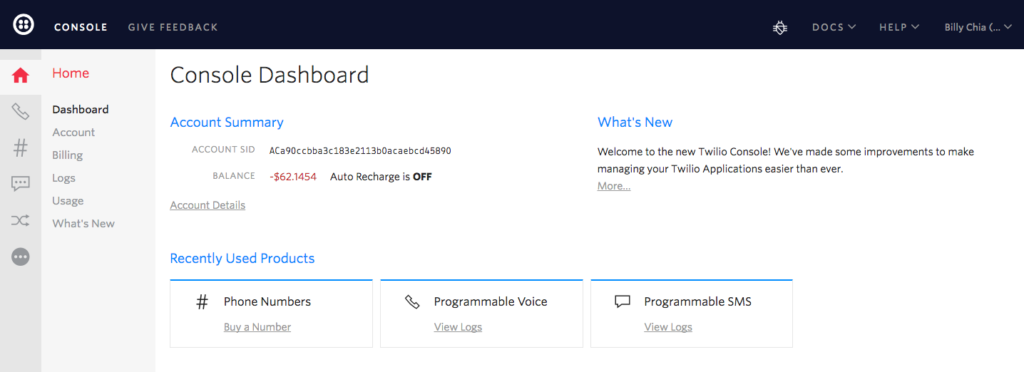
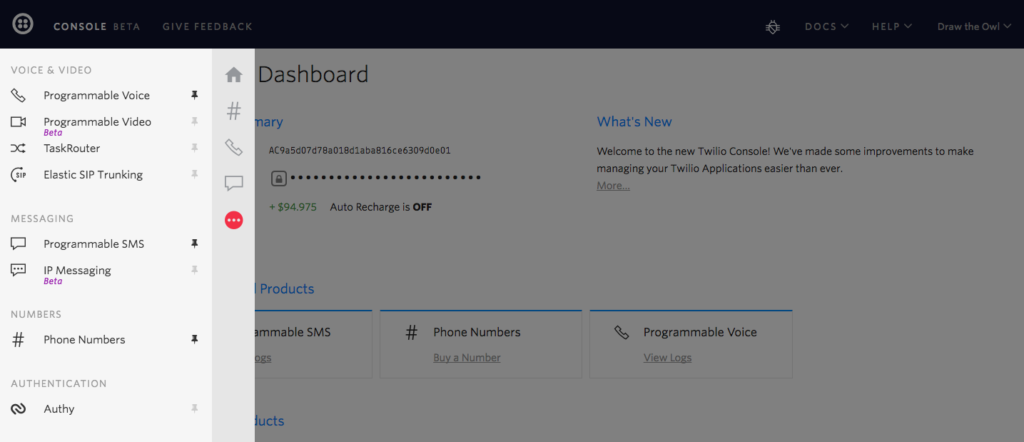
In the run up to SIGNAL, we debuted Console as our sneak peek into the new developer experience from Twilio. The whole suite of Twilio products can be accessed with the new slim dock to the left of the Console.
The interface permits pinning of the products you care about for faster access.
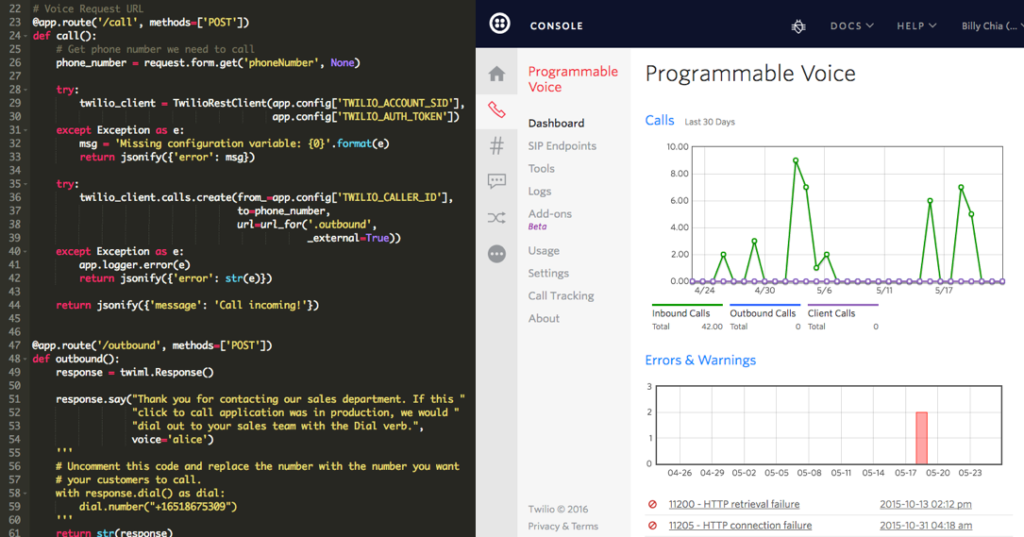
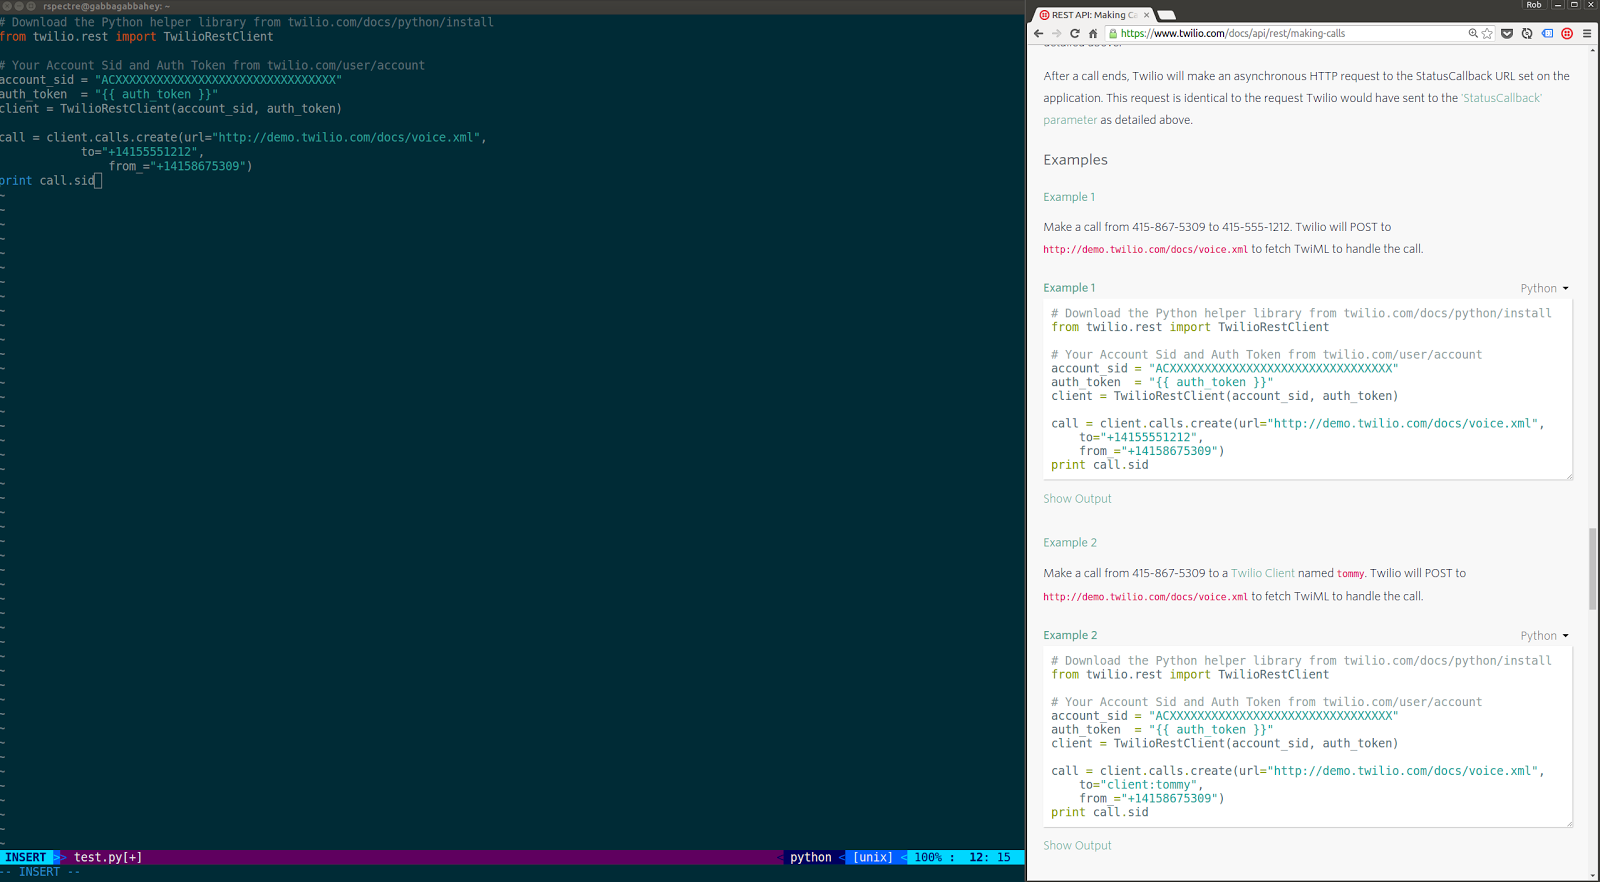
And finally the experience is wrapped in a responsive design for developers – the console can sit side-by-side your text editor on a laptop screen.
But perhaps my favorite of the many new features introduced in the Console is the introduction of TwiML Bins. Now you can create static TwiML responses for your webhooks right inside the console without the need to stand up your own publicly available web host.
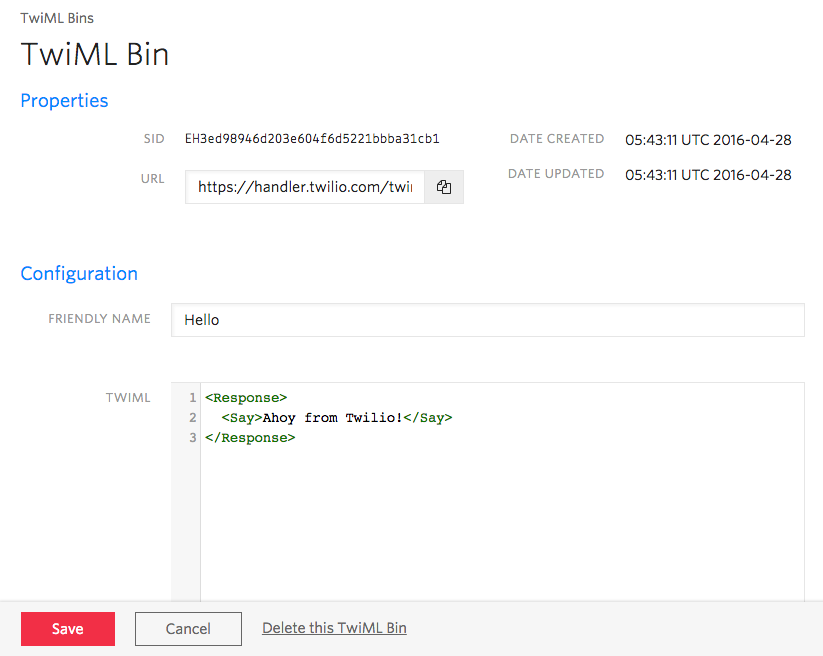
These webhooks can be applied to one or multiple Twilio phone numbers, dramatically accelerating your ability to get your prototype functional.
Find Your Answers Faster With New Docs
Accompanying the new Console is a redesigned Documentation experience. Starting with our Tutorials launch a few months ago, we’ve been hard at work reimaging Twilio Docs from the ground up to help you find the information you are looking for faster than ever before.
Similar to the new Console, Docs enjoys a new developer responsive design permitting the documentation you’re reading and the code you’re writing to fit side-by-side on an 11-inch Macbook with 80 columns width for your text editor.
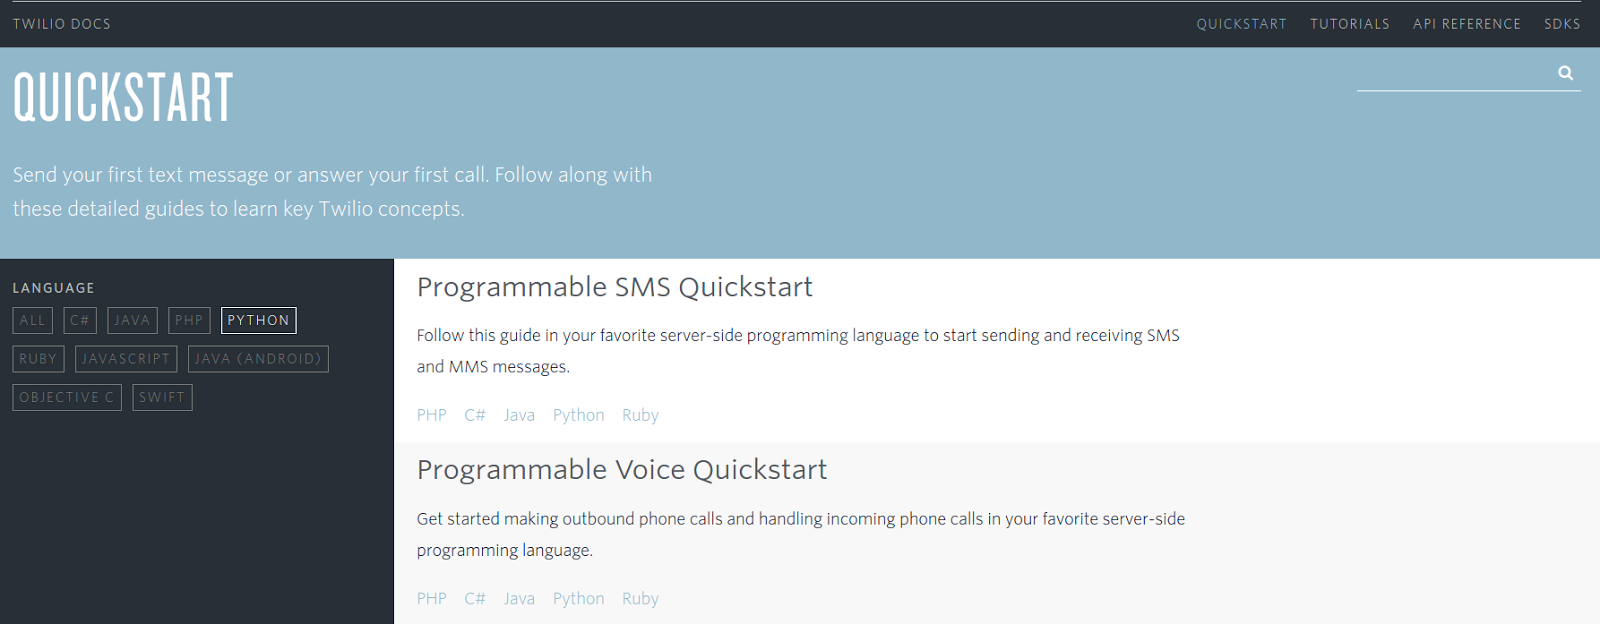
Browsing for the right languages and products is also faster with a new filterable sidebar, winnowing the displayed documentation to fit your stack and ideas.
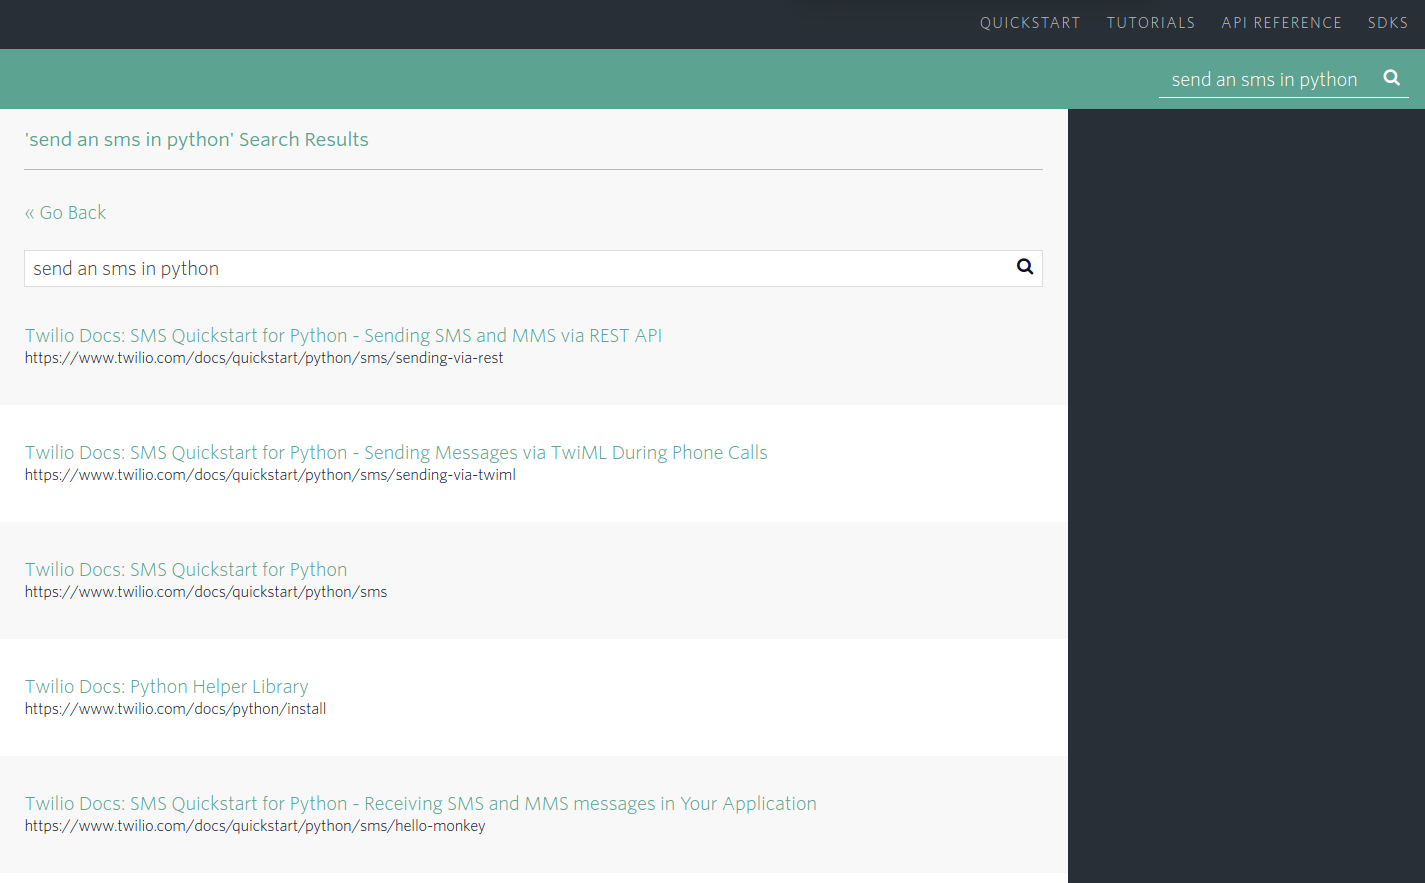
Finally, in-site search helps you specify exactly what you’re looking for with a code-forward implementation that gives you snippets right in the results.
Troubleshoot With Lightning Speed With The Debugger
Once you’ve got the happy path of your app up and running, finding the edges that produce errors quickly becomes critical to getting to production. To provide a speed boost on that stage of your journey, we’ve completely revamped how you find and fix your errors with a new Debugger.
At the top of the nav, you’ll see an new icon for the Debugger. No matter what Twilio product you’re using to build, the Debugger will watch for new errors. If it notices that an error has taken place, it will glow red. Clicking on the icon will give you the option to go to the Debugger or mute these notifications.
When you go to the Debugger, the first thing you’ll see a chart of all the errors that have happened in the last 24 hours. We want it to be instantly clear if there’s something wrong that requires your attention. You can easily tweak the search criteria and the chart and results will instantly reload.
In addition to grouping these debugging events by type, developers can now group errors by the webhook URI that is associated with it, giving you unprecedented insight to the problematic endpoints of your Twilio application.
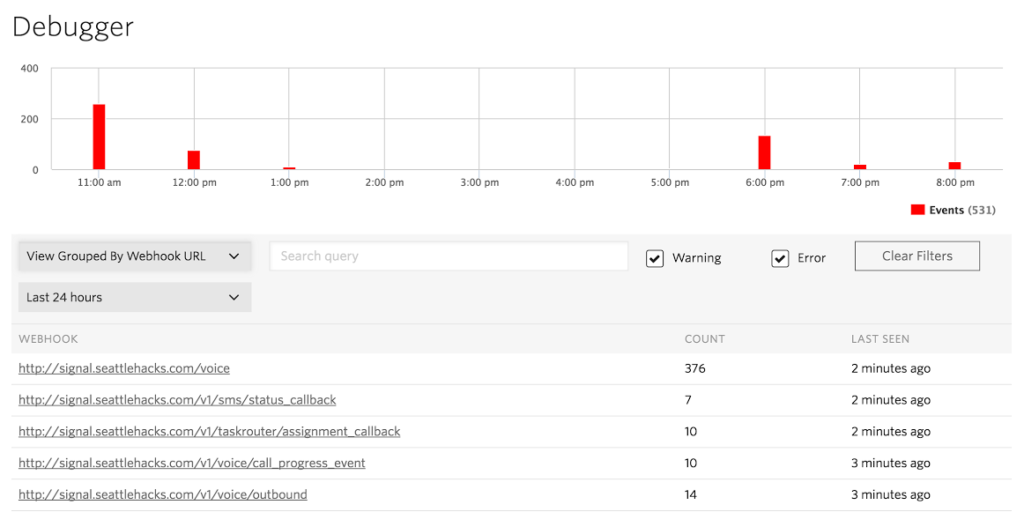
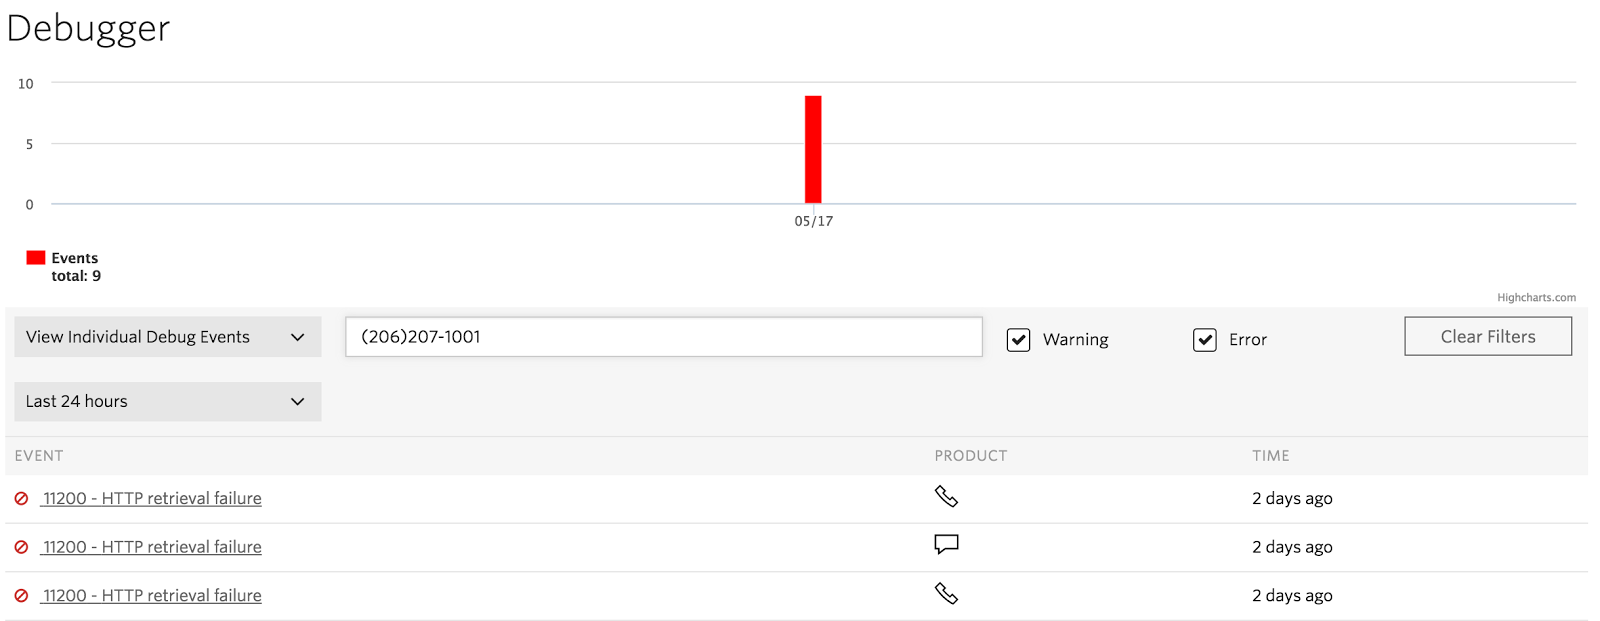
You can then click on any of those endpoints to see all of the errors associated with just that endpoint:
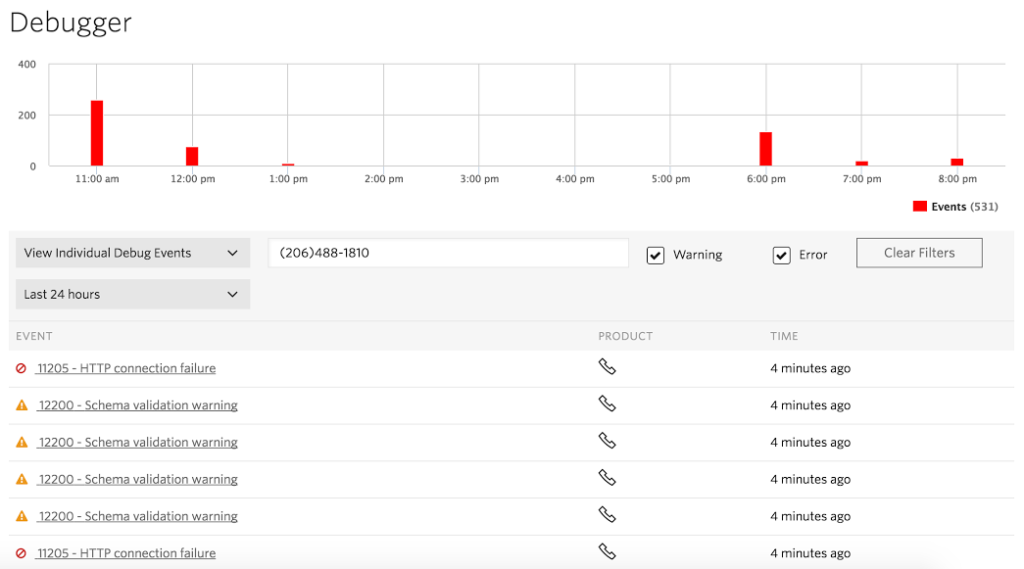
Robust search fills out Debugger’s ability to pinpoint errors. In addition to searching by webhook URI, developers can search for errors by phone number, Call Sid, SMS Sid or any of the parameters that Twilio included in its HTTP request to your application.
We Can’t Wait To See How Fast You Can Build
With the combination of our newly reimagined Console, Docs and Debugger, developing on Twilio has never been faster. While we are stoked to share this new developer experience from Twilio with you, the journey to accelerate your build time is only just beginning. Included in each part of the experience is an easy way to submit feedback on what you see.
We want to hear what you think – submit feedback either through these channels or hit us up on Twitter at @twilio.
We can’t wait to see how fast you can build.
Related Resources
Twilio Docs
From APIs to SDKs to sample apps
API reference documentation, SDKs, helper libraries, quickstarts, and tutorials for your language and platform.
Resource Center
The latest ebooks, industry reports, and webinars
Learn from customer engagement experts to improve your own communication.
Ahoy
Twilio's developer community hub
Best practices, code samples, and inspiration to build communications and digital engagement experiences.