How to Build a Logs Pipeline in .NET with OpenTelemetry
Time to read:

OpenTelemetry is an open-source observability framework that enables developers to collect, process, and export telemetry data from their applications, systems, and infrastructure. It provides a unified API and SDKs in multiple programming languages for capturing telemetry data such as traces, metrics, and logs from telemetry sources such as applications and platforms. With OpenTelemetry, developers can instrument their applications with ease and flexibility, and then send the collected data to various backends for analysis and visualization. The framework is highly customizable, extensible, and vendor-agnostic, allowing users to choose their preferred telemetry collection and analysis tools.
One of the essential components of observability is logging. Logging is the process of capturing and storing information about an application or system's behavior, performance, and errors. It helps developers diagnose and debug issues, monitor system health, and gain insights into user behavior.
In this article, you will learn the step-by-step process of building an efficient OpenTelemetry logs pipeline with .NET. You will learn the key concepts of OpenTelemetry logs, how to integrate OpenTelemetry into your .NET application, and how to configure the logs pipeline to send the logs to a preferred backend for analysis and visualization.
Logging with .NET
The Microsoft.Extensions.Logging library provides native support for logging in .NET applications. Developers can utilize the simple and extensible logging API provided by this library to log messages of varying severity levels, filter and format log messages according to their preferences, and configure logging providers to suit their needs. A logging provider is responsible for handling the logged messages and storing them in different destinations such as the console, a file, a database, or a remote server.
The OpenTelemetry logging signal does not aim to standardize the logging interface. Although OpenTelemetry has its own logging API, the logging signal is designed to hook into existing logging facilities already available in programming languages. In addition, OpenTelemetry focuses on augmenting the logs produced by applications and provides a mechanism to correlate the logs with other signals. The logs collected by OpenTelemetry can be exported to different destinations, including centralized logging systems such as Elasticsearch, Grafana Loki, and Azure Monitor.
Building an OpenTelemetry logs pipeline
OpenTelemetry components can be arranged in the form of a pipeline in which they work together to collect, process, and export telemetry data from an application or system. The pipeline offers flexibility and customizability, enabling users to tailor the pipeline to their specific requirements and integrate it with their preferred telemetry analysis tools. The components of the pipeline will vary with each signal - metrics, traces, and logs. The following diagram illustrates the core components of the OpenTelemetry logging pipeline:
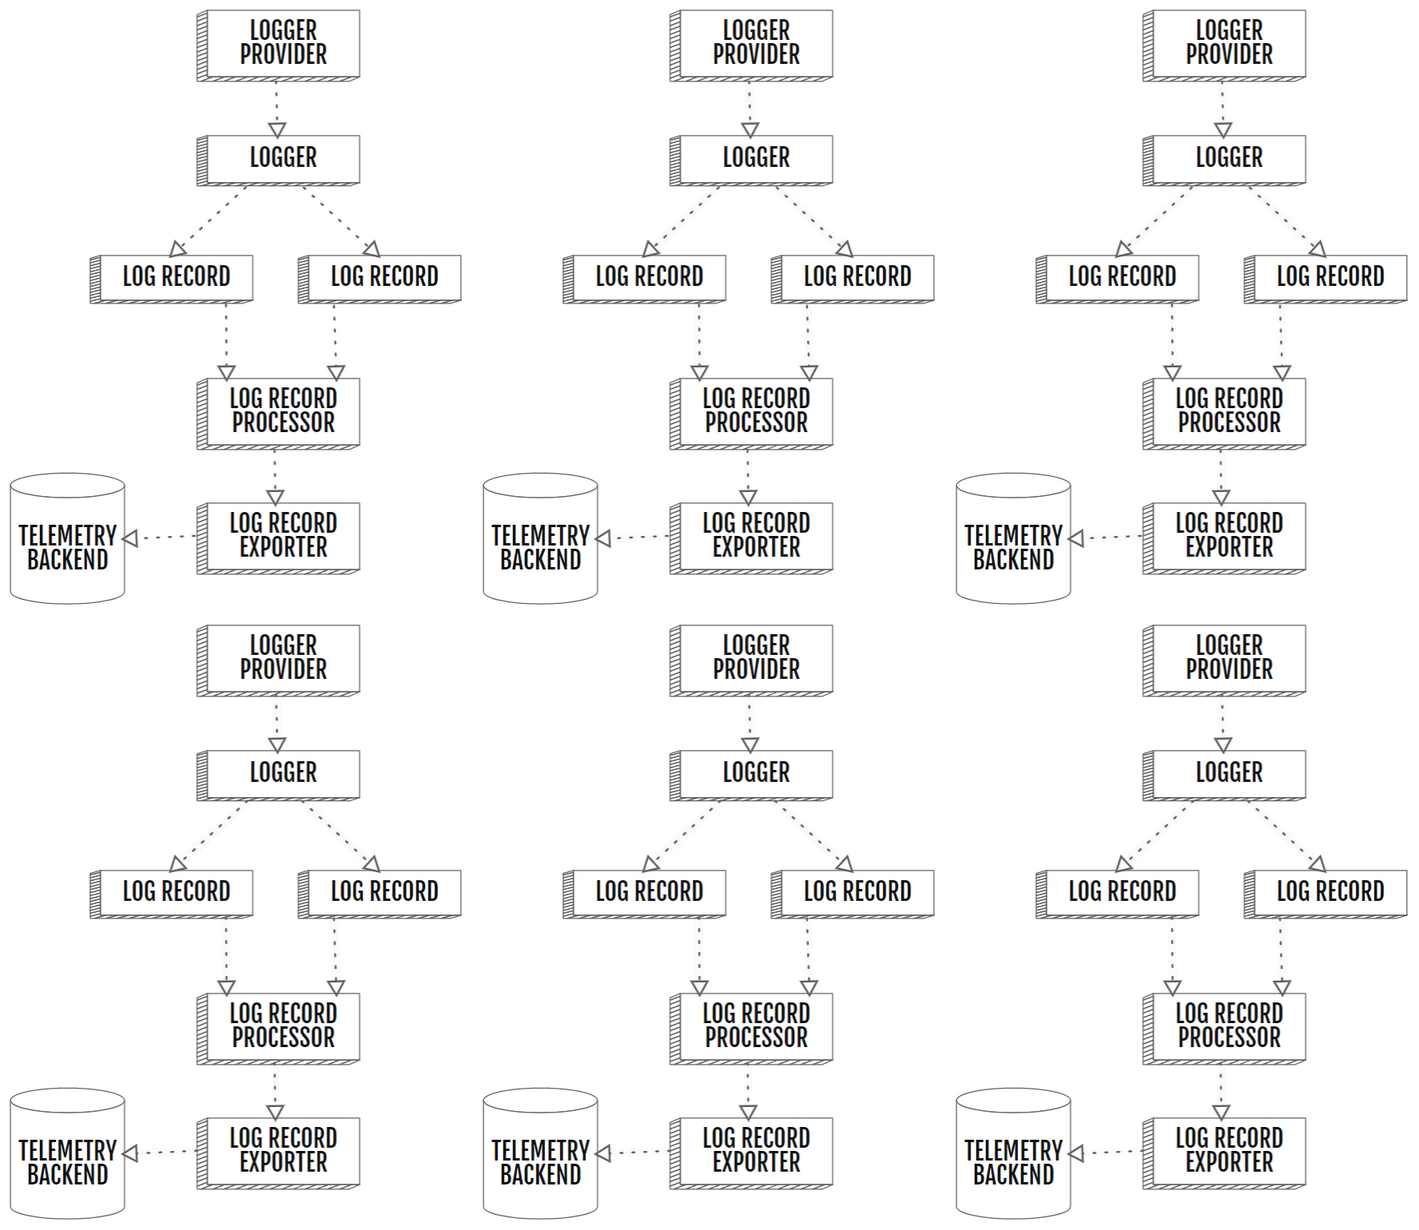
The pipeline components perform different functions, as summarized below:
- Logger provider: Provides a mechanism for instantiating one or more loggers.
- Logger: It creates a log record. A logger is associated with a resource and an instrumentation library, which is determined by the name and version of the library.
- Log record: It represents logs from various sources, including application log files, machine-generated events, and system logs. The data model of the log record supports mapping from existing log formats. A reverse mapping from the log record model is also possible if the target format has equivalent capabilities.
- Log record processor: It consumes log records and forwards them to a log exporter. Currently, there are three built-in implementations of the log processor:
SimpleLogRecordExportProcessorandBatchLogRecordExportProcessor, and a processor to combine multiple processors namedCompositeLogRecordExportProcessor. - Log record exporter: It sends log data to the backend. The exporter implementation is specific to the backend that receives the log data.
Let's implement the logging pipeline in an ASP.NET Core application. Use the instructions outlined in the Microsoft Learn guide to create a new ASP.NET Core Web API project named LogsDemoApi and install the following NuGet package to it that adds support for OpenTelemetry and the OpenTelemetry console exporter to your project. You will use this exporter to write application logs to the console.
It is now time to define the logging pipeline. First, you need to define the attributes of the resource representing your application. The attributes are defined as key-value pairs, with the keys recommended to follow the OpenTelemetry semantic conventions. To define the attributes of your application, edit the Program.cs file and use the following code:
Then, add the following code after the previous code to define the logging pipeline:
Let's take a closer look at the code you just wrote. In the default configuration, your application writes logs to the console, debug, and event source outputs. The ClearProviders method deletes all logger providers from the application to ensure that your application uses only the OpenTelemetry console exporter for writing logs. We'll now take a look at the OpenTelemetry pipeline setup. First, the SetResourceBuilder method associates the logger with the resource builder you defined. Then, using the AddProcessor method, you added a custom log record processor of the type CustomLogProcessor to the pipeline to manipulate the logs before they reach the exporter. Adding a processor to the logging pipeline is optional. You will, however, use the CustomLogProcessor to include state information in the application logs. Your final component in the pipeline is a console exporter that prints all logs to the console.
You can further customize log records by adding additional information, such as scopes and states, through the logger options. You can enable or disable these settings depending on your complexity and storage needs.
Log enrichment
In the previous section, you configured the OpenTelemetry logger to use the CustomLogProcessor to process logs. By adding your own processor, you can update the log records to add additional state information or remove sensitive information before they are sent to their destination. In your project, create a file named CustomLogProcessor.cs and define the CustomLogProcessor class as follows:
Any custom log processor must inherit from the BaseProcessor<LogRecord> class. You can override different base class methods depending on where in a log record's lifecycle you want to modify it. Here, you captured the LogRecord object just before the logger passed it to the exporter, removed sensitive data, and added some runtime information to its state.
Writing logs
OpenTelemetry's logger provider– OpenTelemetryLoggerProvider, plugs into the logging framework of .NET. Therefore, you can now use the .NET logging API to log messages, and these messages will be collected by OpenTelemetry and exported to the configured exporters. To illustrate, you can add the following API endpoints to your Program.cs class to log messages with different severity levels:
Now you can launch the application and send requests to both endpoints. To do so, here are the cURL commands and PowerShell cmdlets for your convenience:
As a result of this operation, you can view the logs you defined in the application console. For example, the screenshot below shows the logs recorded from a GET request to the default endpoint.
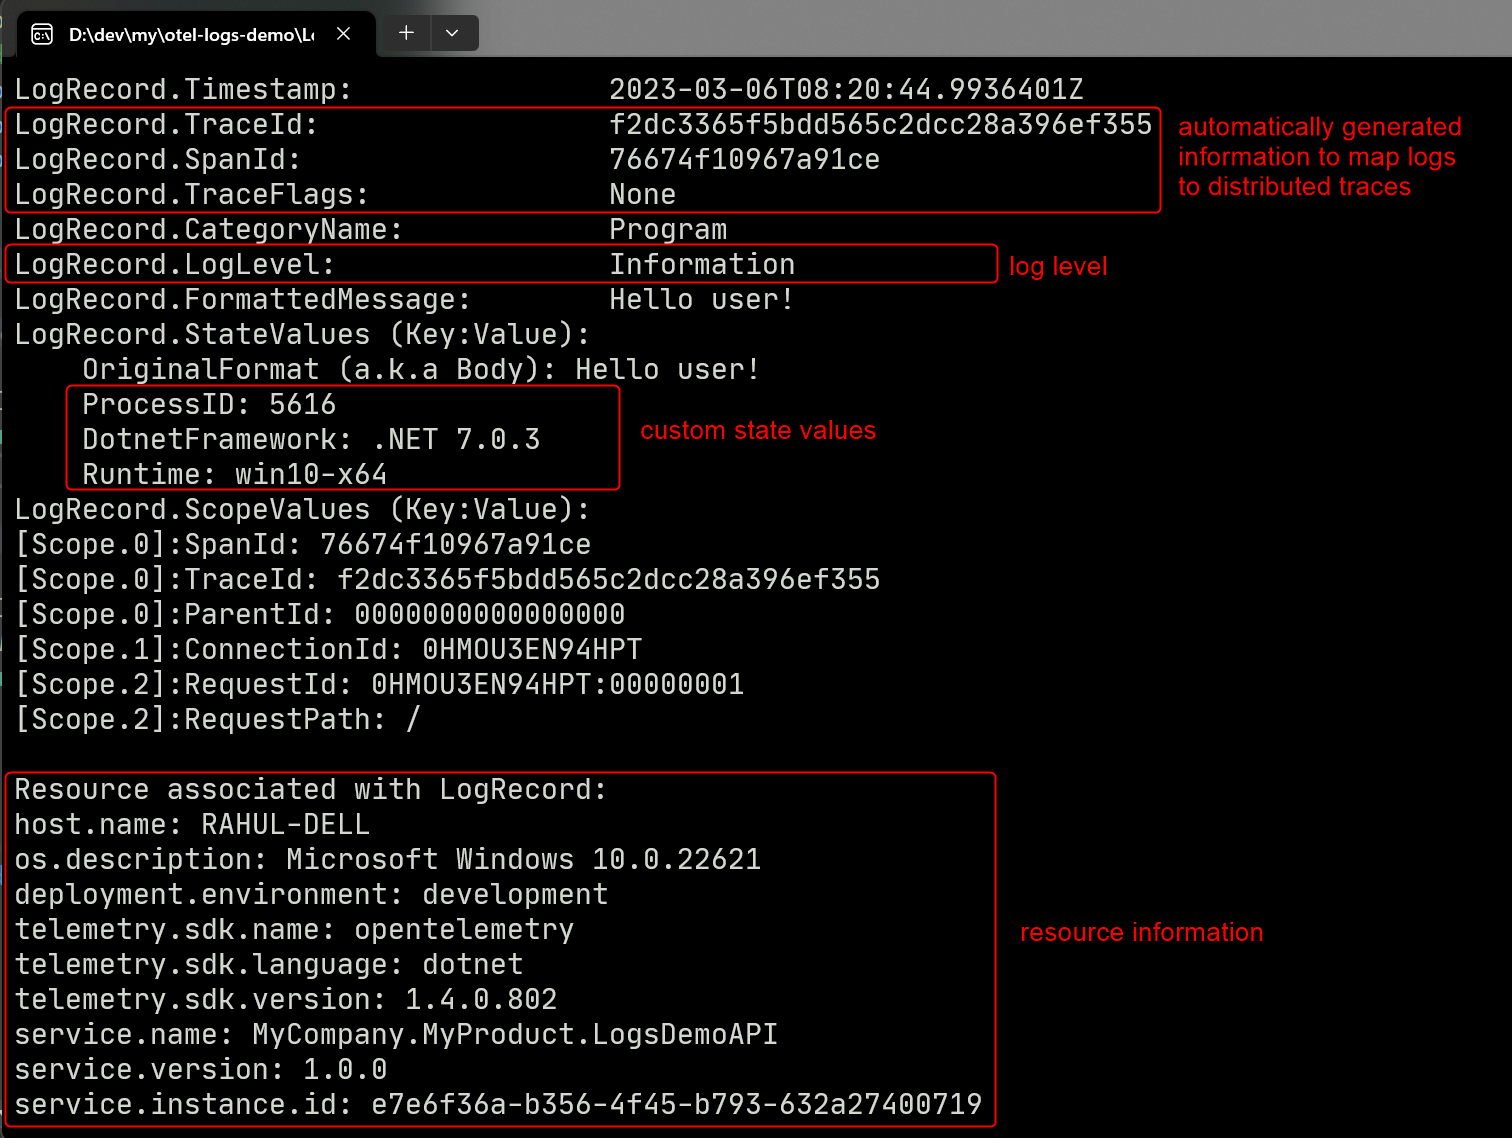
You can gather the following information from the recorded output:
- Timestamp: The time associated with the log record.
- Trace id and span id: Identifiers of the trace to correlate with the log record.
- Log level: String representation of the severity level of the log.
- State values: State information stored in the log.
- Resource: The resource associated with the producer of the log record.
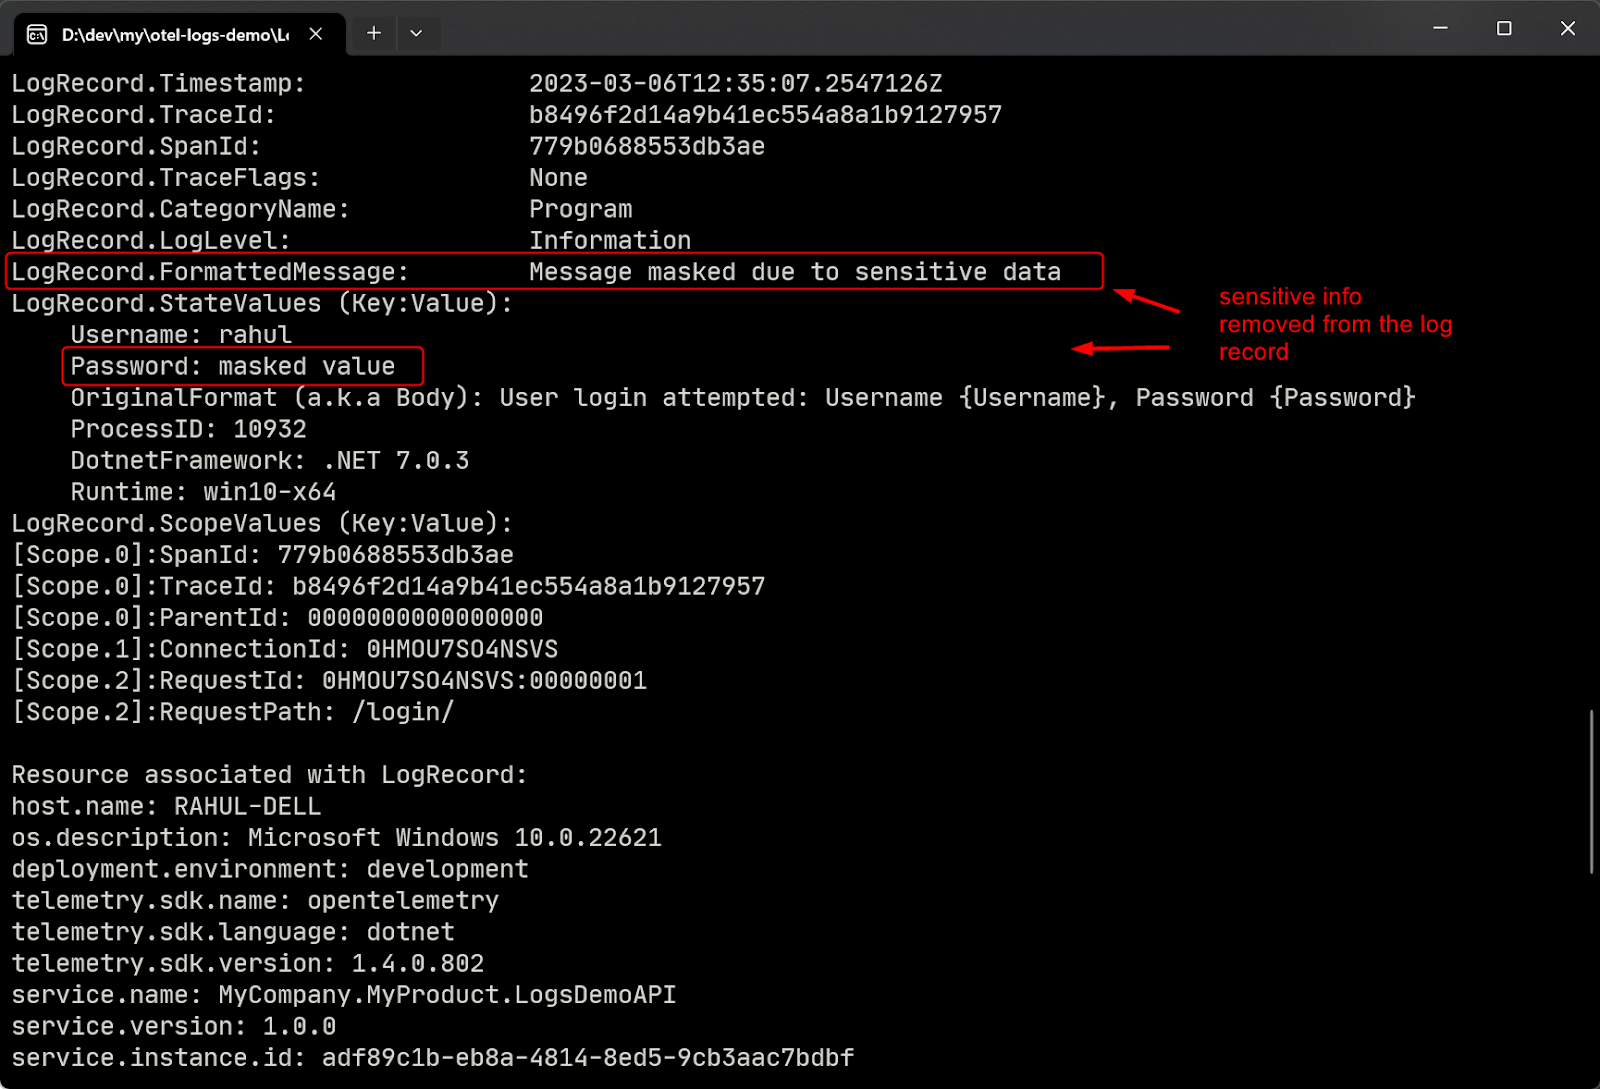
Finally, here is the console output from the request sent to the /login endpoint. The screenshot below shows the custom log message that replaces the original log message with sensitive information. Note that the state key-value pair, which contains the password, has been updated as well:
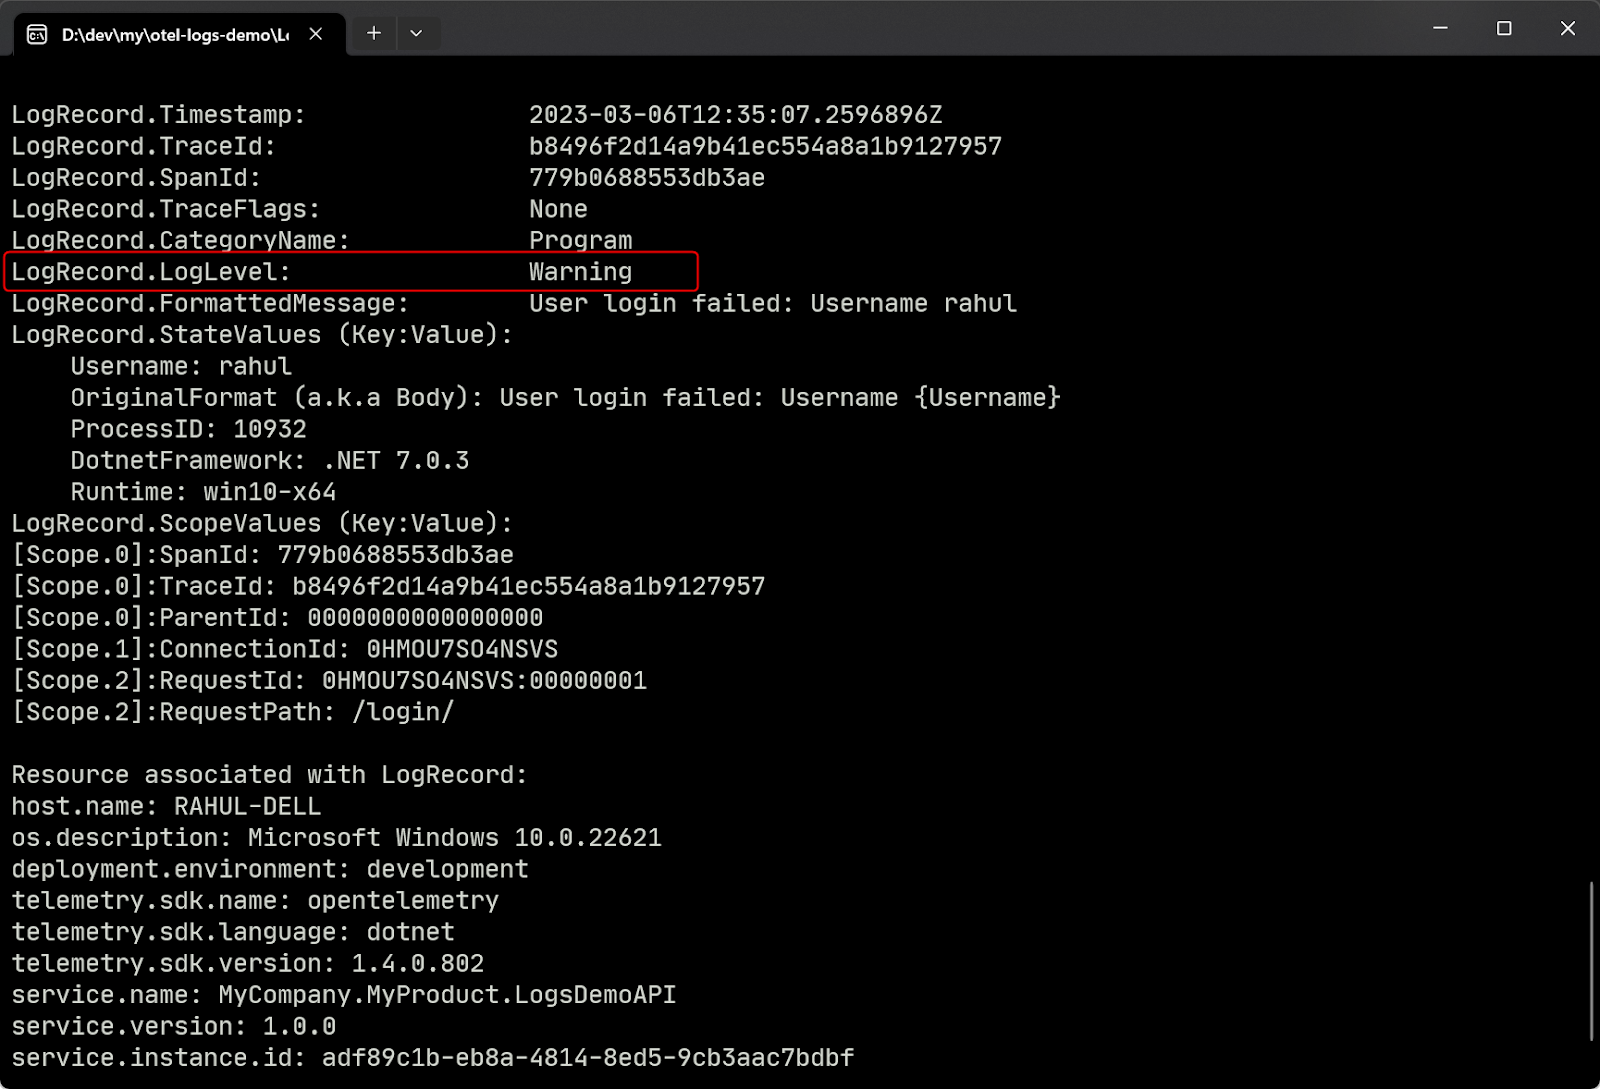
Below is the screenshot of the second log statement containing the warning message from the same API endpoint:
Conclusion
This exercise concludes the discussion on building an OpenTelemetry logs pipeline for a .NET application. In this article, you learned how to build an OpenTelemetry logs pipeline with .NET. You installed the OpenTelemetry .NET console logging exporter, configured the OpenTelemetry logs pipeline. You also built a custom log processor to add state information and manipulate the log records before export. The application is also available on my GitHub repository for reference.
In the next part of this series, you will configure this application to export logs to Azure Monitor.
Also, check out this tutorial on how to automatically instrument containerized .NET applications with OpenTelemetry.
Outside of his day job, Rahul ensures he’s still contributing to the cloud ecosystem by authoring books, offering free workshops, and frequently posting on his blog: https://thecloudblog.net to share his insights and help break down complex topics for other current and aspiring professionals.
Related Posts
Related Resources
Twilio Docs
From APIs to SDKs to sample apps
API reference documentation, SDKs, helper libraries, quickstarts, and tutorials for your language and platform.
Resource Center
The latest ebooks, industry reports, and webinars
Learn from customer engagement experts to improve your own communication.
Ahoy
Twilio's developer community hub
Best practices, code samples, and inspiration to build communications and digital engagement experiences.

