Debugging Errors In Your Twilio Apps
Time to read:
October 31, 2014
Written by
This post is part of Twilio’s archive and may contain outdated information. We’re always building something new, so be sure to check out our latest posts for the most up-to-date insights.

Halloween is my favorite holiday. One of my favorite things about Halloween is scary stories. I want to share my own scary story – “The Tale of the Unknown Voice”. Imagine receiving a phone call, when you answer you hear a voice you’ve never heard before and it’s saying something terrifying. Gather around the campfire, grab some s’mores and listen up. This happened to me and if you’re not careful it may happen to you too.
It was a day much like today, in a room much like the room you’re in right now. I just finished a new Twilio app and was ready to run it for the first time… or so I thought. I kicked off the code and as expected my phone rang. That’s when I heard the terrifying lifeless robotic voice for the first time: “An application error has occurred”. My keyboard felt like a Ouija board as I pounded random keys in an attempt to exorcise this spirit from my code. I ran the code again and my phone rings. Hands trembling. Despite my better judgement I answered. It was that same voice repeating the same terrible message: “An application error has occurred”. The voice toyed with me for hours before it eventually disappeared.
I hope you never have to experience what I experienced. But if you do, have no fear! There is hope. Today I’ll give you some tips on debugging your Twilio apps, handle this terrifying specter and help you realize why there’s a Twilio logo hidden on the proton pack.
Our Haunted House
Maybe you don’t have any ghosts in your code right now. Don’t worry, download this sample code I built that comes pre-baked with a few different bugs. We’ll be using this throughout this post as our very own haunted house of code. The first 3 people to e-mail me all the bugs in this code will get a copy of my favorite scary book – Scary Stories to Tell in the Dark.
Meet Your Ghost Hunting Guide: App Monitor
Before we use those files you just downloaded, let me tell you about some of the most common Twilio errors. Whenever you hear a scary voice the Twilio App Monitor should provide some indication of what went wrong. You can click on any error in the App Monitor to find out the details about the error. You can also use the error and warning dictionary to see even more details what you’re encountering. It may be Halloween but it would be a bit too scary to go over every possible error you could encounter. Instead I want to highlight three of the errors that often haunt me.
12100 Document Parse Error – You’ll see this error when the response you’re giving back to Twilio isn’t valid TwiML. Are you sure you’ve properly closed all of your XML tags? Twimlbin is a great tool for hosting TwiML but will also show you invalid formatting. Try throwing your response in a Twimlbin and see if it helps you discover the issue.
11205 HTTP Connection Failure – This error is telling us that Twilio was unable to connect to the server where your TwiML is hosted. Is your code currently hosted on your local machine? Ngrok is a great tool that exposes your localhost to the outside world. You can learn how to setup ngrok from my buddy Kevin (or a super special Windows version from Devin Rader).
12300 Invalid Content Type – You may see this error when you’re trying to send MMS. Make sure the media you’re trying to send is an accepted MIME type. Many times, I’ve not realized the media I’m trying to send is returning a 404 and as a result have gotten this error.
One other great feature in App Monitor is Triggers. Triggers will notify you when errors are happening in your app. You can even learn from Paul Hallett on how to set up Triggers to send you SMS notifications.
We’ll be using App Monitor throughout this post as we work through our haunted house of code.
Did You See that? Check Again With Request Replay
Once you’ve identified your error in the app monitor you’ll want to start working on a fix. Having to make a new phone call or SMS to test fixes can slow down your development and sometimes you just get tired of hearing that scary voice. That’s why we created Request Replay. Request Replay is an easy way to re-run a request that previously failed and compare the two requests side-by-side to see if your fix looks good.
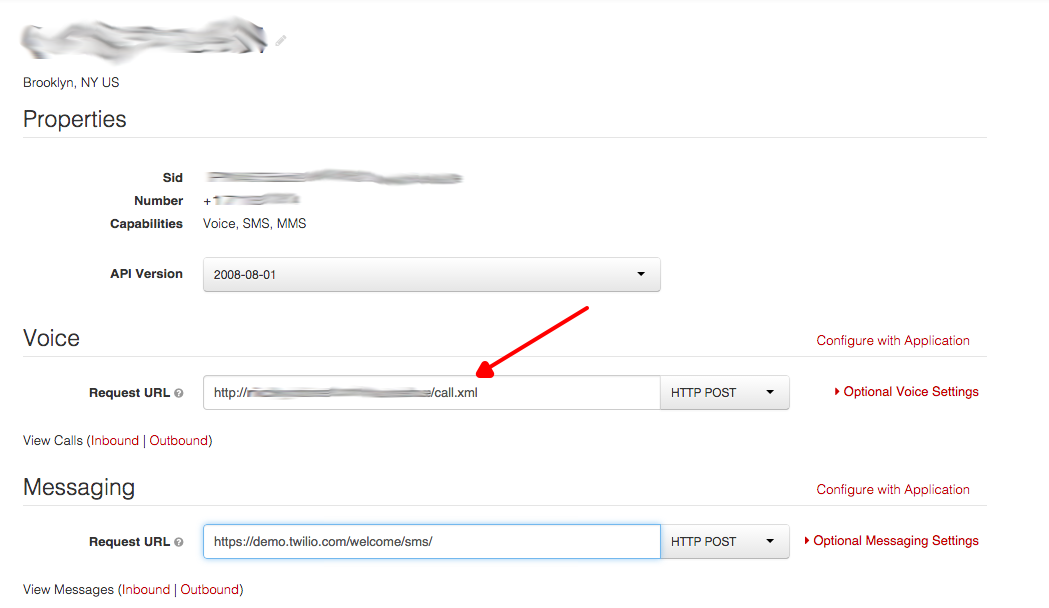
Let’s check out how it works. In our haunted house code there’s a file called call.xml. Make sure that file is someplace publicly accessible via HTTP (either on your own server or on your localhost with ngrok). Now we’ll set up a new Twilio number and set the Voice Request URL to our call.xml file:
Now that we’ve set up our number give it a call. We’re hearing that unknown voice. Don’t be scared. Let’s use the skills we’ve already learned to to figure out what’s happening. Jump in App Monitor and you’ll notice we’re getting a Document Parse Error. D’oh, looks like we have a typo in our TwiML! We can fix that by properly closing our tag. Now that we have a fix in place we can test it using Request Replay.
Using Request Replay is easy. Find the failed call in your call logs and click on it. Scroll down to the Request Inspector and then click the replay button. You can now see your side-by-side comparison:

This runs an identical request with the same headers and parameters. In this case, our issue was fairly trivial but replaying your requests becomes even more valuable when you’re battling more complicated bugs in your app. Give your number a call and listen to the scary story.
Exploring Dark Corners With Postman
Request Replay is great if you want to try an identical request. If you want to test out a custom request Postman lets you easily build and test HTTP requests in your browser. Postman comes in handy when trying to debug your Twilio webhooks. If you haven’t already installed Postman, install it now. We’re going to be using it to fix some more bugs in our code.
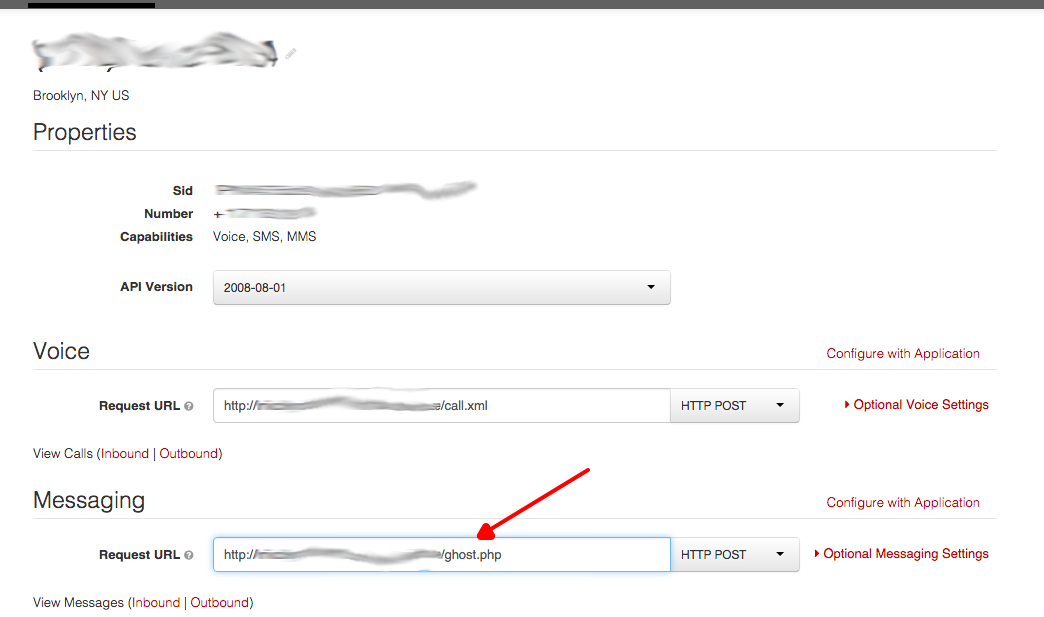
Let’s set up a new Twilio number to see how it works. This time we’ll be using the ghost.php file in our haunted house code. Like before, make sure this file is on a publicly accessible web server that can serve PHP. Then set that URL as the message request URL for your new number:
This is a (broken) file that should let someone have a simple SMS conversation with a ghost. Our app should have the following functionality:
- If a user sends “Boo” they will get a response saying “Boo to you!”
- If a user sends “Trick” they will get a response saying “or treat!”
- Otherwise they’ll get a response saying “Hello! Scary ghost here!”
We can use Postman to test our webhook and see if we can discover any bugs:
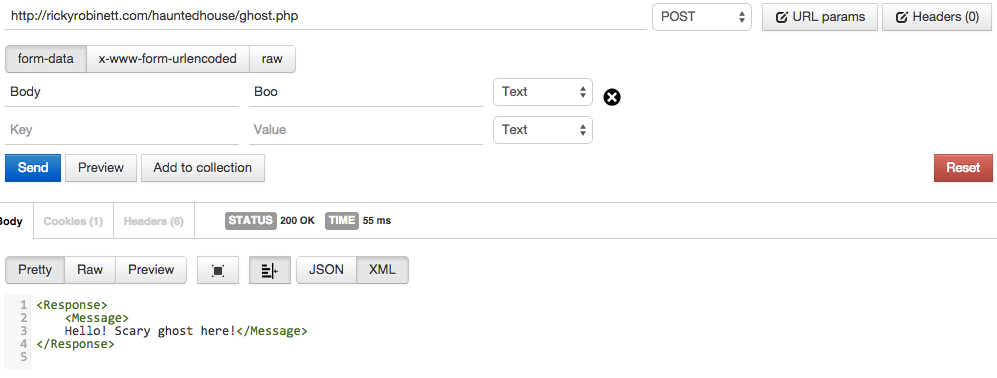
When you launch postman you’ll provide a URL to hit. In this case it’ll be ghost.php on your server. We need to set the method to POST. Finally we’ll add our Body parameter. We’re testing it with “Boo”. Click send to have Postman make the request and see the response.
Oh no! That’s not the response we expect. Let’s take a look at our code to see if we can figure out what’s going on:
Oops, we’re using $_GET when we should be using $_POST. Update your code and try making the request with Postman again:

Much better! We’ve still got a couple other bugs in this code. Can you use Postman to find and fix them?
Find Things You Can’t See With Runscope
Maybe there’s an issue with your Twilio webhooks that other users are experiencing but you can’t recreate. Runscope is a great tool that let’s you monitor all HTTP requests going through a URL. Once you’ve signed up for a free Runscope account you can use the URL Helper to get the Runscope URL you’ll be using to debug your traffic:
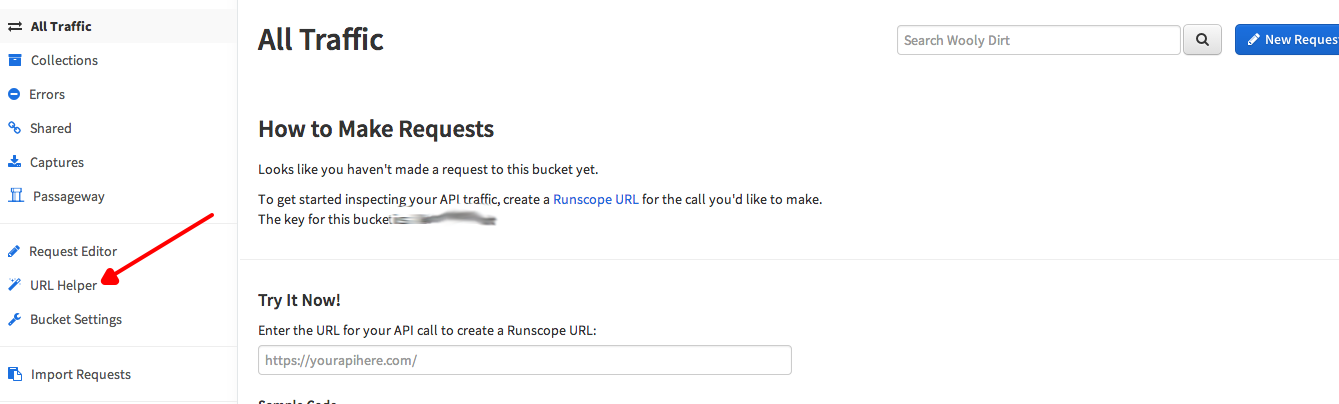

First enter the URL that you are currently using for your Twilio webhook. We’ll be trying this out with our ghost.php URL. Once you enter this you’ll get a Runscope URL that will let us capture all the traffic that comes into it. You can copy this and update your phone number in Twilio to use this URL as the message request url. As request come through, you can dive into them and see exactly what’s going on:
Runscope is a really powerful tool. I’d highly recommend diving into their API debugging docs if you want to get a grasp on all the ways it can help. See if Runscope can help you find any other issues in ghost.php that you might of not found with Postman.
Happy Hunting!
The first time you hear the unknown voice (or encounter any other bug) it can be scary but it doesn’t have to be. App Monitor, Request Replay, Postman and Runscope can save you time and make sure you’re able to sleep at night. Want to test your skills? There’s a mms.xml file in our haunted house that we didn’t fix in this post. See if you can find any bugs in the file using these tools. Do you have a favorite tool for debugging Twilio apps that we missed? Shout it out in the comments. Are you experiencing something in your own Twilio app you just can’t figure out? You can always e-mail us at help@twilio.com.
Related Posts
Related Resources
Twilio Docs
From APIs to SDKs to sample apps
API reference documentation, SDKs, helper libraries, quickstarts, and tutorials for your language and platform.
Resource Center
The latest ebooks, industry reports, and webinars
Learn from customer engagement experts to improve your own communication.
Ahoy
Twilio's developer community hub
Best practices, code samples, and inspiration to build communications and digital engagement experiences.