How to Make Charts in Notion using Database Data and Node JS
Time to read: 9 minutes
September 14, 2022
Written by
Reviewed by

The popular productivity tool Notion is so versatile that if you longed for some non-native functionality, you don’t always have to wait for their team to include an implementation, you can build your own implementation integrated directly into their platform!
One such component that is not currently supported at the time of writing is the ability to make charts from database data in Notion. Many no-code services available online will offer their own integrations to provide charts, but if you ever wanted to know how to make your own charts for free using Notion’s API and SDK, along with a couple of other API’s to help render the charts and host the images, then read on to discover one way of accomplishing this task.
Prerequisites
To follow along with this tutorial, you will need the following:
- A Notion account – this tutorial assumes a free personal account
- Node.JS installed on your computer
Setup
To get set up and ready to write some JavaScript for this project, there will be a few setup instructions to ensure successful completion of the tutorial.
The first step is to set up Notion to be ready to access and work with their API. The second step is to create accounts and access the Imgur API and QuickChart, which will be used to render the charts and host the images. The last step is to set up the project files and install the dependencies needed for everything to work together.
Set up in Notion
This tutorial will assume the reader knows how to create a new Page and a Table database in Notion. It is also assumed that the reader knows how to create a new Integration.
If you are not familiar with this process, please see this tutorial to see the complete steps required to set up a database and create an integration, as well as where to obtain the Integration Token. All the Integration set up steps will be the same as this tutorial, but instead of naming it “Demo”, name the integration “Charts”. This dedicated guide from Notion is also a great resource for getting started.
Now that you have an understanding of how to create a Page, Database, and an Integration, here is a look at how the pages of this project will be structured.
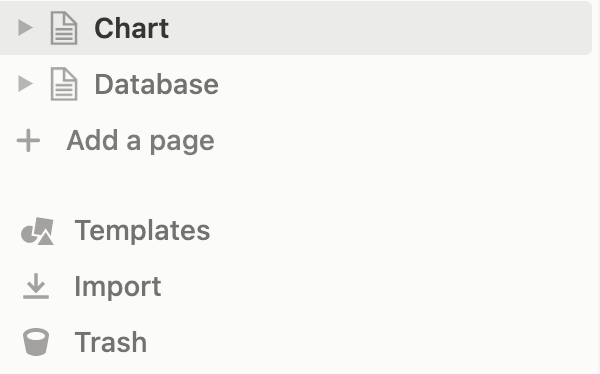
Create two new Pages, one called “Chart” which will have the chart created from the data within the database, and the other called “Database” which will contain only a Table database.
Construct the Chart page
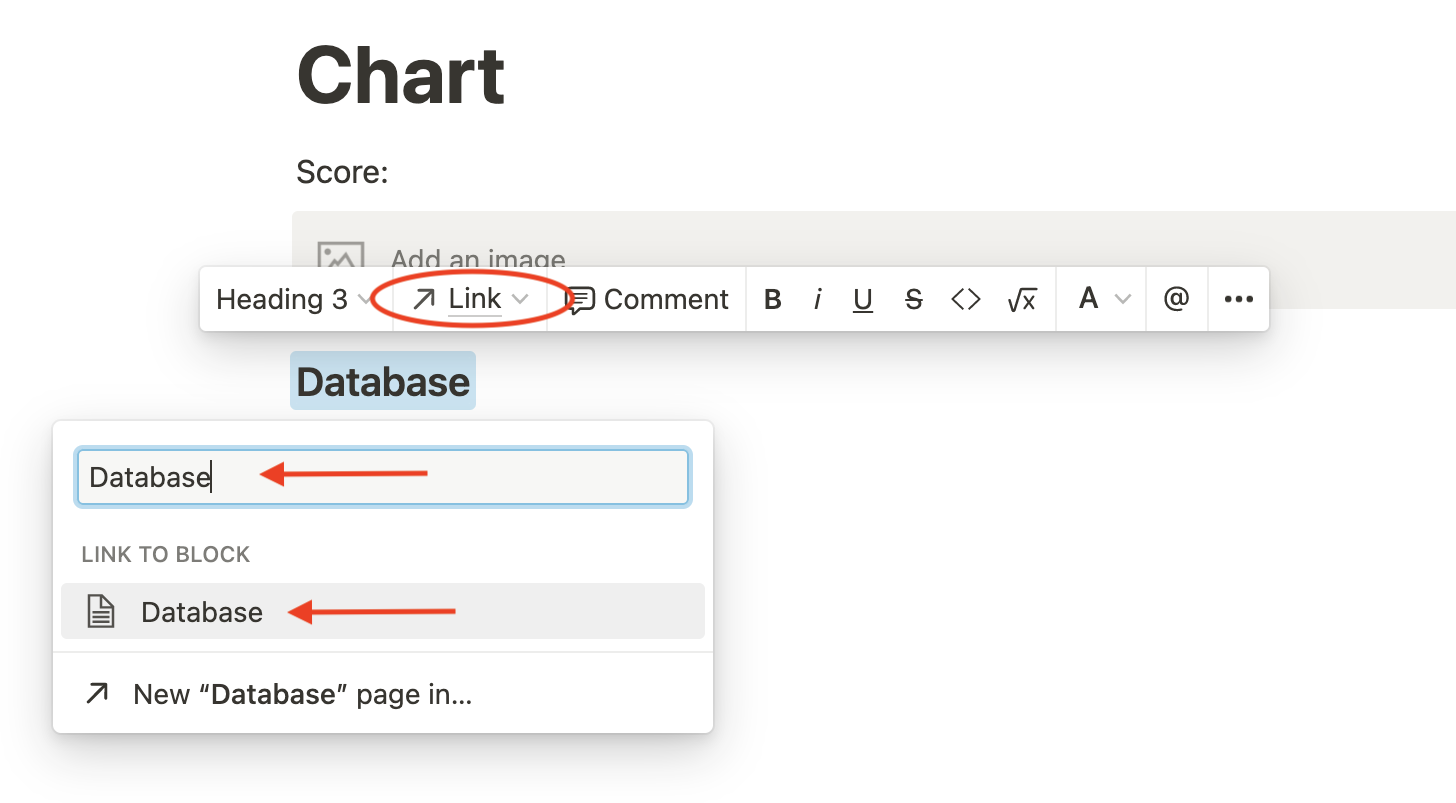
In “Chart”, create three components in the following order by typing them in and pressing enter.
Score:– this is just text. Press enter to go to the next line./image– press enter to insert a box that acts as an upload button for an image. Keeping it as-is or uploading a placeholder image will not affect results./heading3– after pressing enter, type inDatabase. Highlighting this text will make a toolbar show up. Click the Link button in the toolbar to open a text box and dropdown menu. Select the Database page made earlier in the dropdown menu or type in “Database” into the text box to find it.
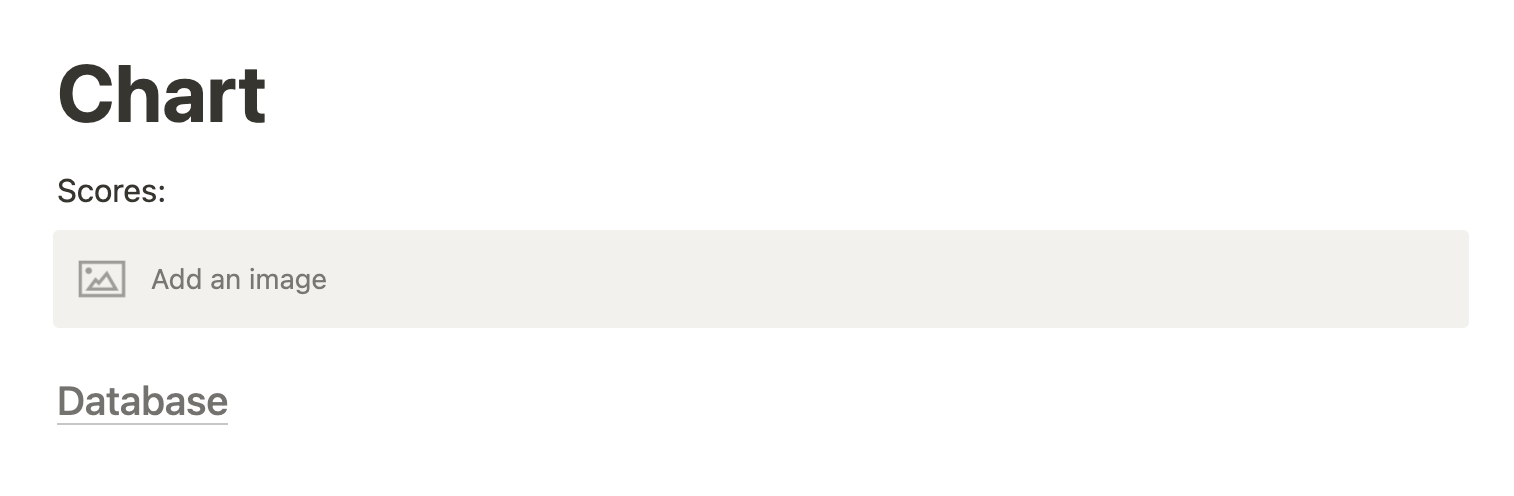
At this point, the “Chart” page is complete and looks something like this:
Construct the Database page
Navigate to your Database page, type “/”, and scroll down to the DATABASE section. Click on Table view and then click on the + New database button on the right sidebar. A new database will then appear:
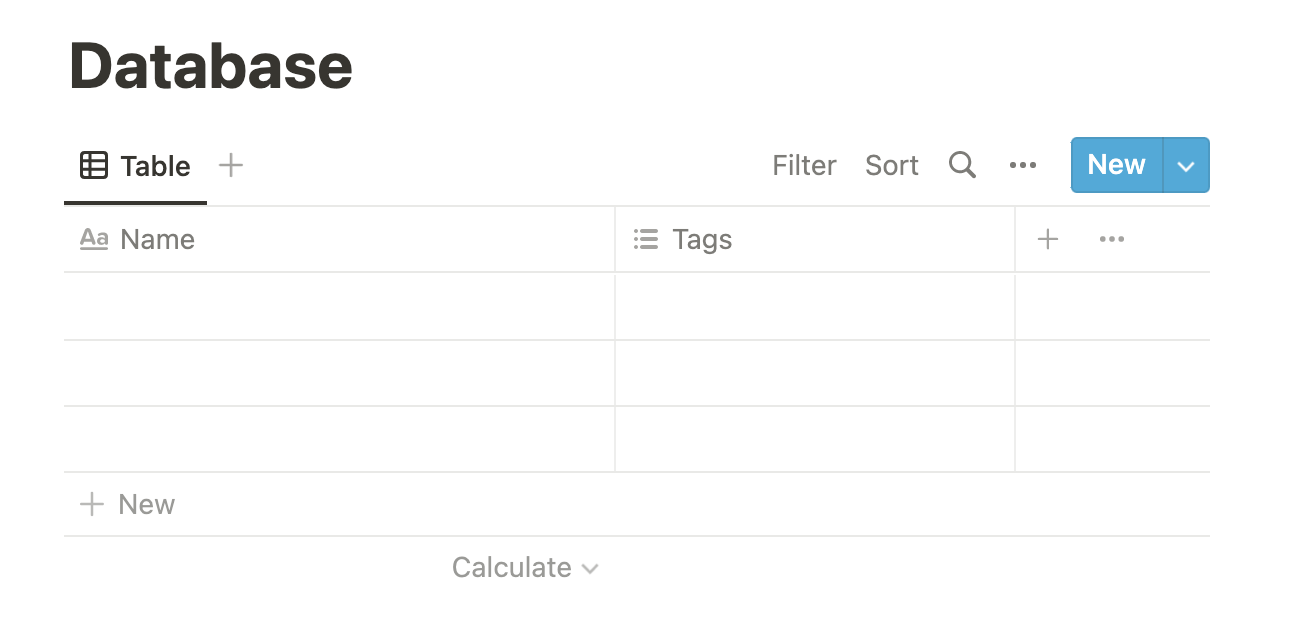
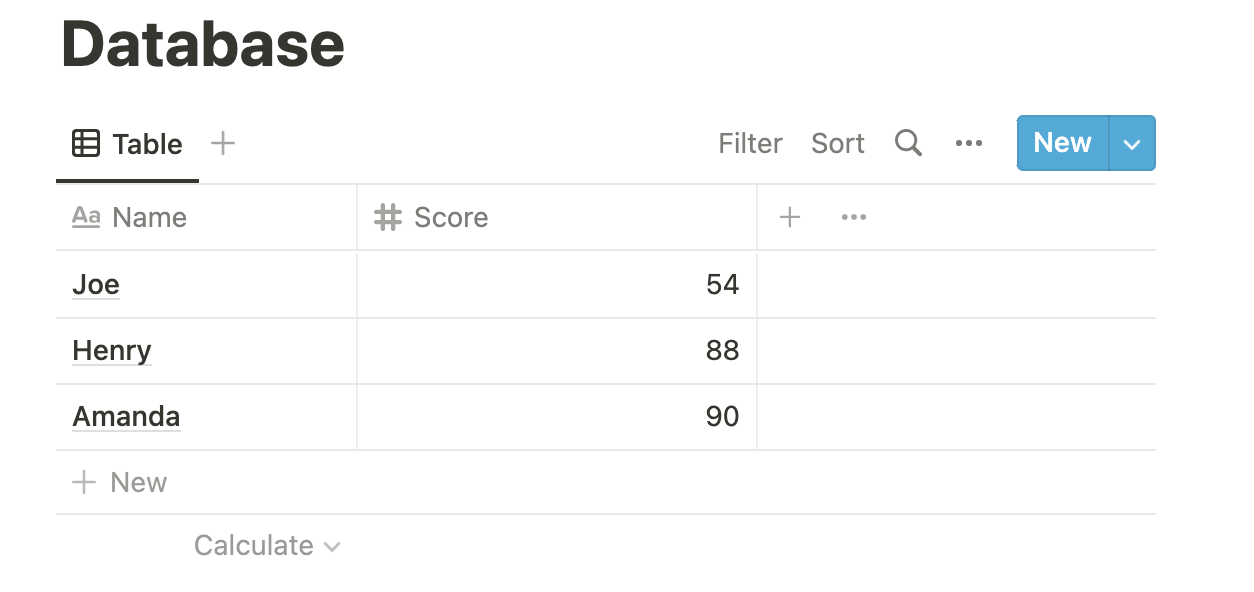
Keep the first column as “Name”, but change the second column from type Multi-select to Number and rename it as “Score”. Fill in the following fields so that the database has some data to use in the chart(s).
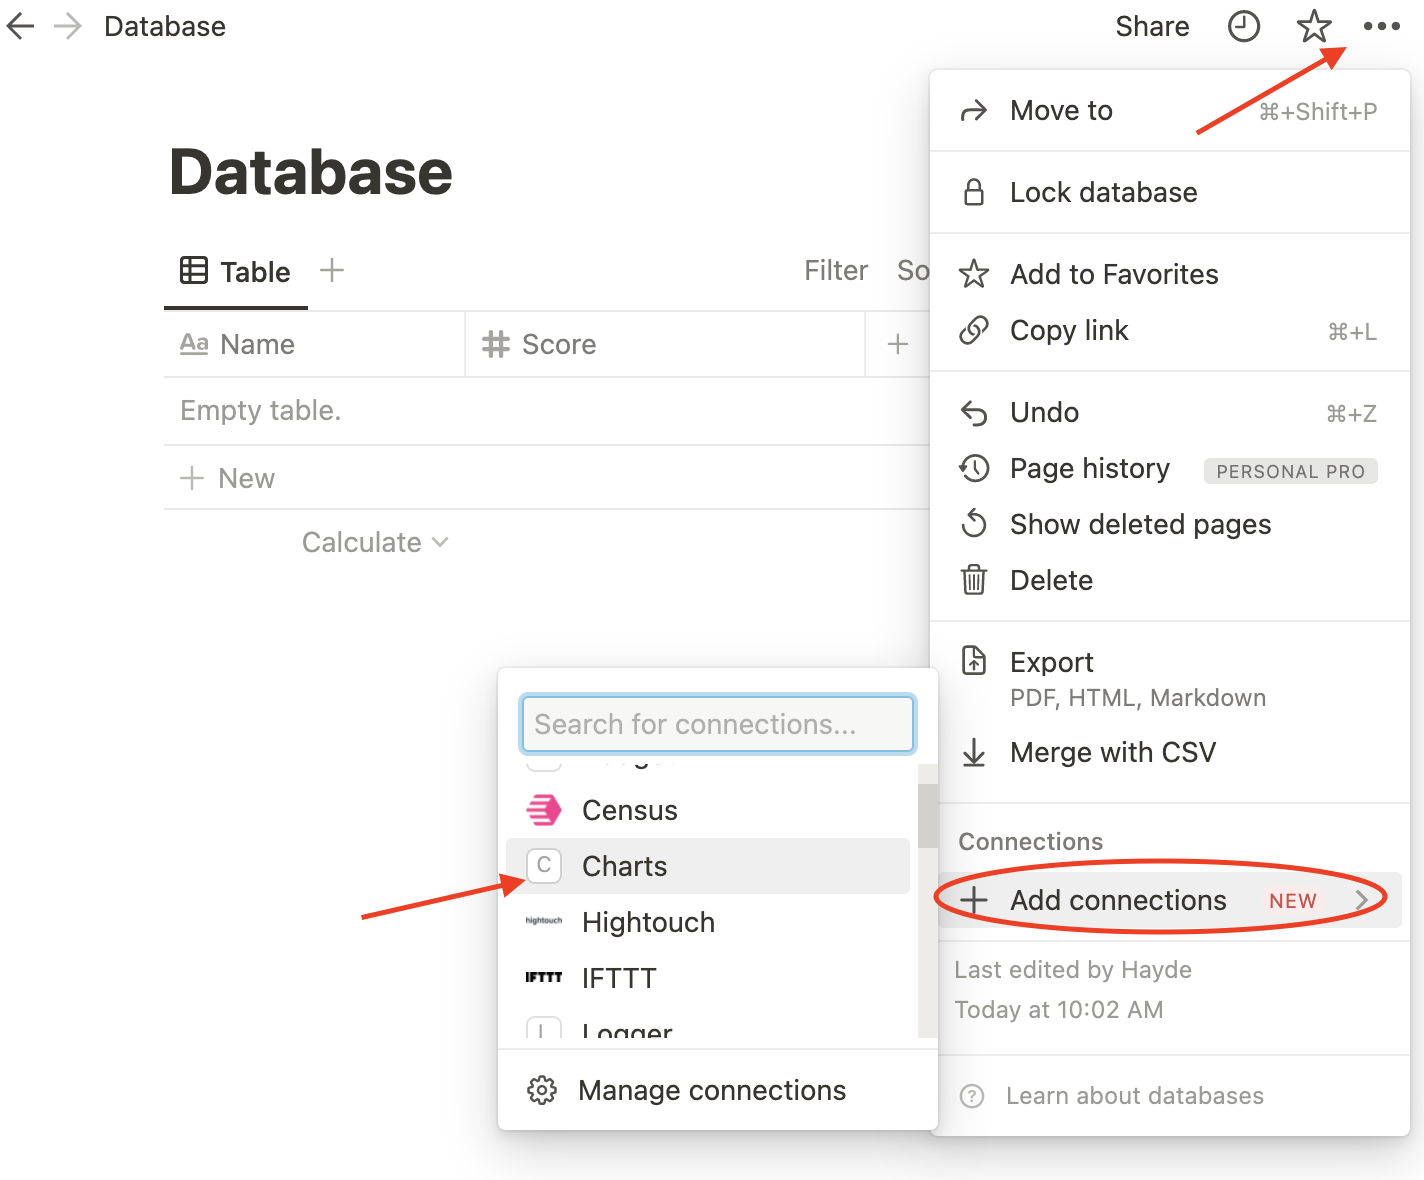
At this point, the “Chart” and “Database” pages are ready to use. Click the three dots in the top right of the page and scroll down to Connections. In the Add connections popout, search for and include the name of your Integration, “Charts”, that was set up at the very start of this tutorial. If it wasn't set up in the beginning, follow this previous tutorial to find out how to create one. Be sure to share this integration with both the “Chart” page and “Database” page by clicking the name of the integration that shows up when the name is typed into the textbox.
The next step is to obtain the page ID from your “Charts” page and the database ID from your database.
Grab the URL for your “Chart” page and it will look something like this: https://www.notion.so/Chart-6a6d75d2d6334d3a8c397aca6e523cb7. The Page ID will be the code found after Chart-. Once you grab the ID, it needs to be in a 8-4-4-4-12 character length pattern which will look like the following: xxxxxxxx-xxxx-xxxx-xxxx-xxxxxxxxxxxx.
For the database ID, head to your “Database” page and open it as a full page by clicking the highlighted button below:
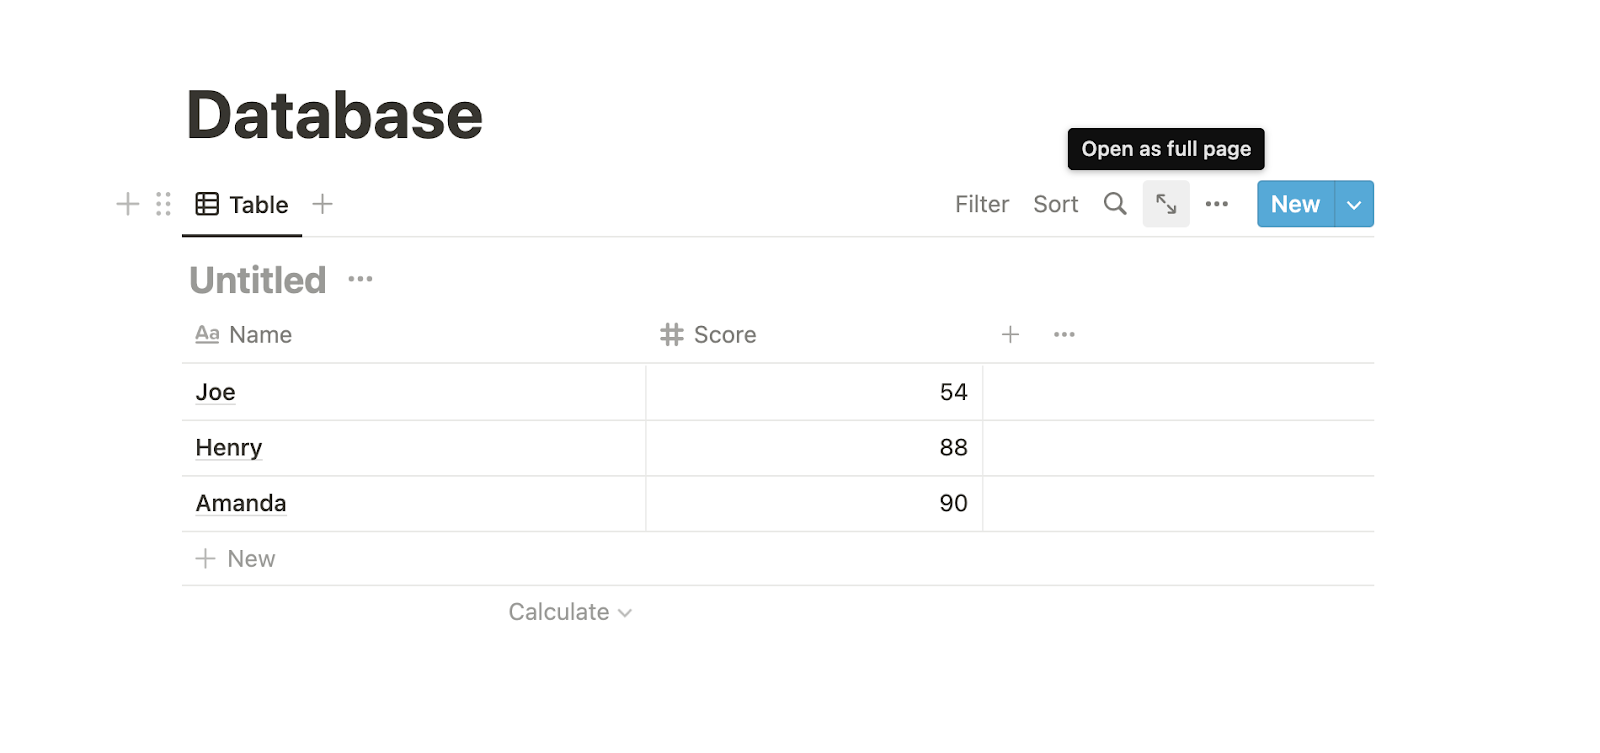
Once it’s opened up, the URL will look like this:
https://www.notion.so/2294ec2a019c4b47b64c5af87b670df7?v=a0443a853c084c0a96cfdf9a2b36495f. The Database ID will be the code between the last backslash and the first question mark.
Set up to use Imgur and QuickChart API
This tutorial utilizes QuickChart to render charts and Imgur to host said charts. For unknown reasons, the Notion API does not recognize a QuickChart URL as an image, so to workaround this issue the chart will be uploaded to a more recognizable Imgur URL.
Acquiring Imgur credentials
Go to the Imgur website and create a free account. This account will keep all of the chart images that you upload, which will all be hidden by default, which means they will not show up publicly on the website but will be readily accessible via URL. Ensure all chart information is as anonymized as possible for this reason.
Once your account is set up and ready to go, proceed to register your application to use Imgur’s API and fill out the following fields.
- Under Application Name, type “charts”.
- Under Authorization Type, select “OAuth 2 authorization with a callback URL”.
- Under Authorization Callback URL, paste the following link:
https://www.getpostman.com/oauth2/callback. - Leave Application Website blank.
- Under Email and Description, enter your own email and description of your application, or enter a period for both fields.
- Check the reCAPTCHA box and then click the gray Submit button at the bottom.
Once submitted, Imgur will redirect you to a new page with your codes to be used in our requests to their API, the Client ID and Client Secret.
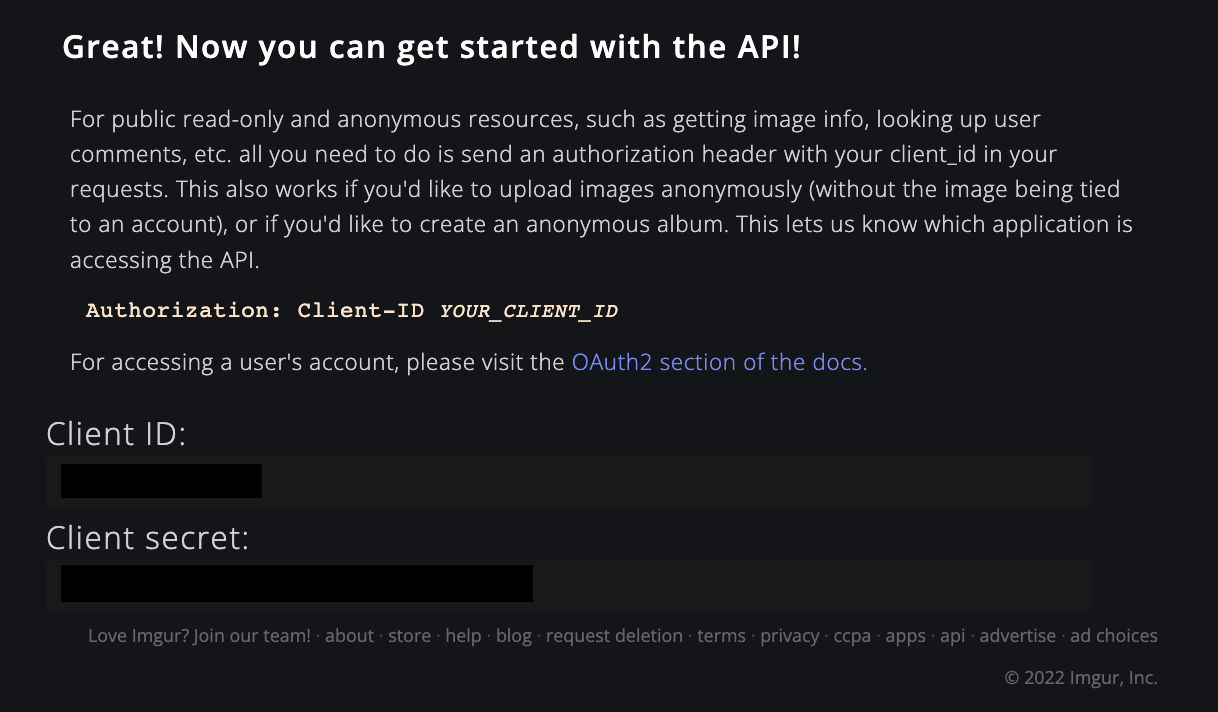
Copy and keep these values handy. The Client ID is the one to use for this tutorial as it is the only one required to upload images, but save the Client secret as well for the sake of completeness.
Set up with QuickChart
The greatest part about using the QuickChart API is that there is no API key or credentials needed in order to use their services. For ease of use, this tutorial utilizes a QuickChart SDK which will be installed and initialized in the next section.
Set up project files and install dependencies
In the terminal on your computer, navigate to a directory where you would like to store your project files and enter the following commands.
Once inside the empty notion-charts directory, initialize a new npm project and install the Notion SDK, the dotenv library to read the private credentials for Notion and Imgur, the QuickCharts SDK, and axios to send requests with the following commands.
Once all the dependencies are installed, create two files index.js and .env by using the following command.
Open the .env file and paste the following variables, replacing each <PLACEHOLDER> with the respective values that were collected over the course of the setup. Note that the NOTION_API_KEY is the Integration token acquired when the “Charts” integration was created.
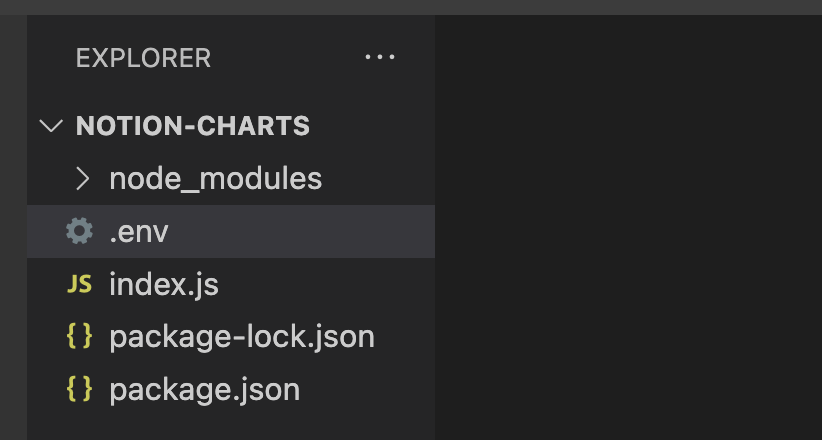
Save the .env file and open the project in your favorite code editor or IDE. I am using VSCode for this tutorial, and thus far, here is how my file structure looks.
Open up package.json, add the highlighted line to ”scripts”, and save it.
Once this is complete, the last step is to import all the dependencies that we installed and set up some global variables that will store the necessary credentials. Open up index.js in your editor and paste the following at the top of the empty file.
After saving the index.js file, setup is complete and the project is ready for some code!
Use database information to create a chart
The Notion SDK adds direct support for accessing information stored in their databases. In this section, this database information is sent to QuickChart, which will render the chart on their platform and send back a URL that contains the image. At the time of writing, Notion does not support uploading images directly via their API, so external hosting will be necessary for this project.
Write a function to query Notion database and get child blocks
The first function that is going to be added to index.js will provide means to query the Notion database. The second function will return a list of all the child blocks on a page given the page ID.
Below the global variable definitions, paste the following two functions.
These two functions use the Notion API to access information in a database or page. As long as your integration has been shared with both the “Database” and “Chart” pages, then the integration token that you copied during setup will be able to access the information with the proper databaseId and pageId.
Create a chart with Notion database data using QuickChart
To create a chart with Notion database data and render it with QuickChart, you first need to query the database, parse the data according to your database schema (in this case, the database only has two values for each entry, Name and a Score), and supply this data in an array-based format to the QuickChart API call.
Below the getChildBlocks() function definition, paste the following.
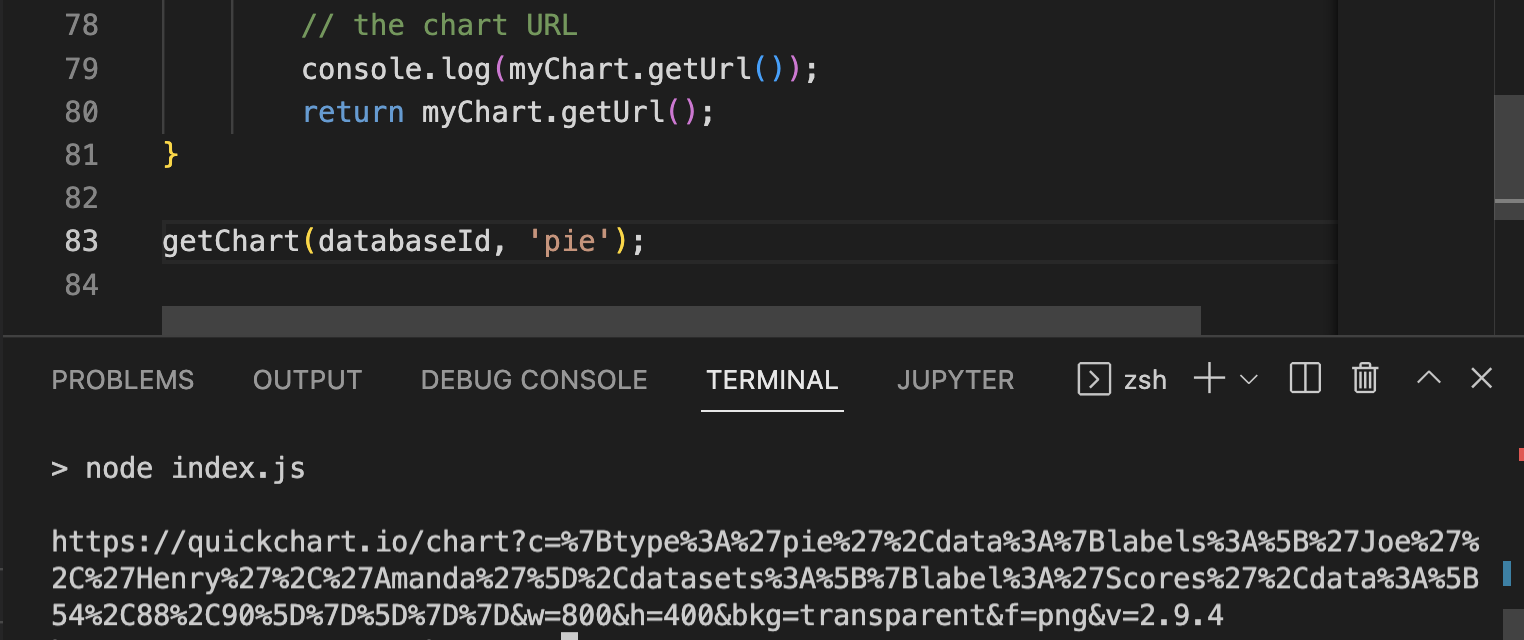
The highlighted line will print the chart URL, which we can test by uncommenting the line and then pasting the following code snippet directly beneath the getChart() function.
Run this program by entering the following command in the project directory.
This will access the database information, parse it according to each Name and Score, supply this information to QuickChart, and then print the URL of the chart that was generated.
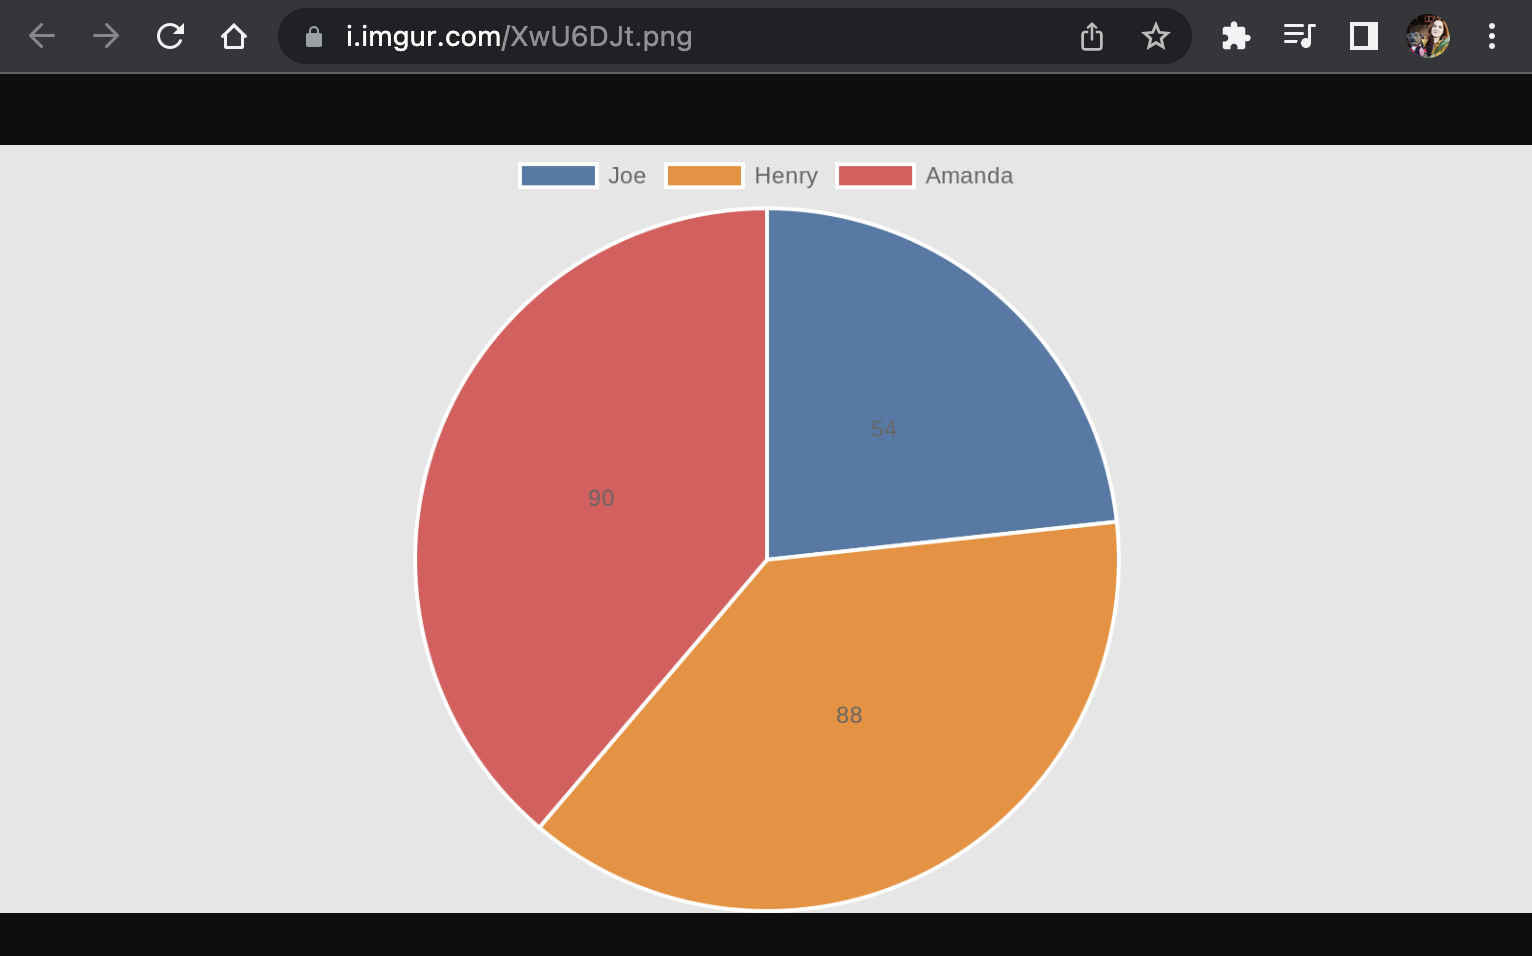
Copying the link to view it in the browser will display a nice pie chart representing the Notion database data.
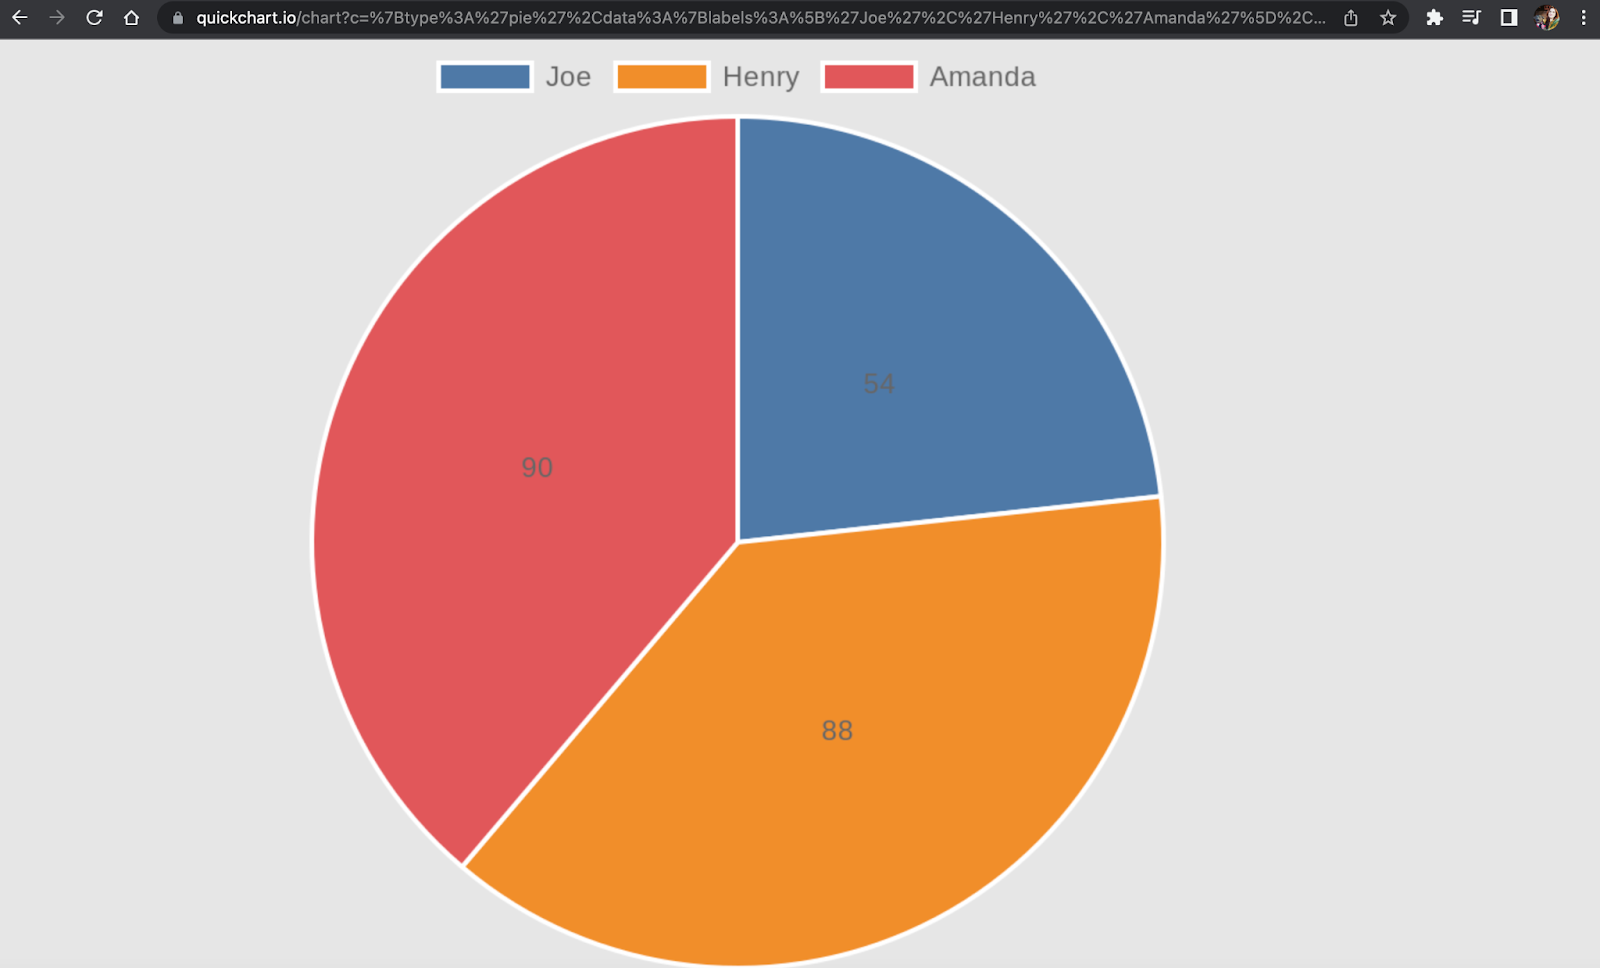
For this tutorial, we will stick with the pie chart, but the getChart() function will produce any of the supported chart types with its second parameter, chartType, with some necessary modifications for certain types.
Before moving on, delete the call to getChart() and feel free to comment back out the console.log() statement that prints the chart URL.
Replace existing charts with new ones
This section will entail writing the functions required to upload the QuickChart image to Imgur using only API calls, and then use the Imgur link to replace the existing images on the Notion “Chart” page.
Swap a QuickChart link for an Imgur link
As mentioned previously, Notion doesn’t recognize QuickChart links as images. In order for images to show up on a page, they must be hosted externally so we cannot generate a chart and upload it either. Therefore, one workaround to this problem is to simply use a different service, like Imgur, to host the images that QuickChart generates.
Underneath the getChart() function definition, paste the following swapLinks() function.
To test this function, paste the following below the swapLinks() function definition.
With the console.log(imgurLink); statement uncommented in swapLinks(), the Imgur link is printed to the terminal and can be pasted in the browser window to view.
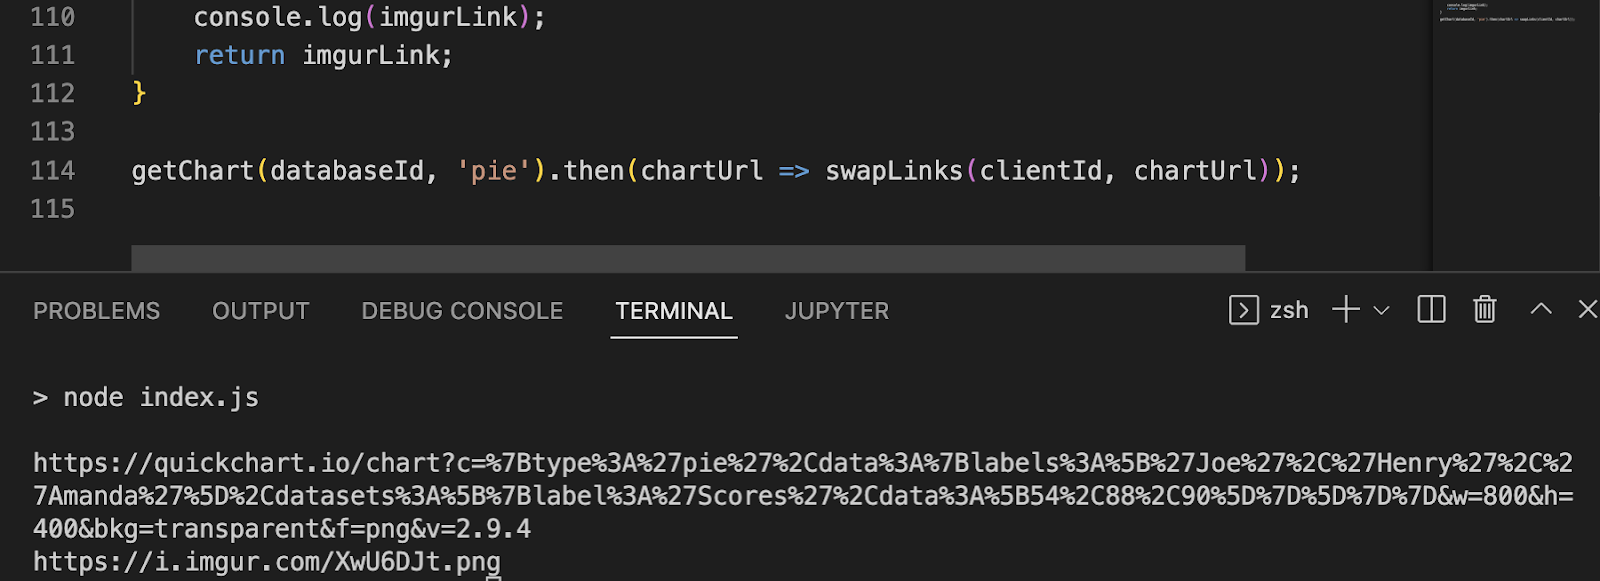
Following this link shows that the image was uploaded successfully!
Delete the last call to swapLinks() and proceed to the next section to find out how to replace images in-place on a Notion page with these Imgur links.
Replace the charts given new links
At the time of writing, the Notion API does not natively support the ability to replace images on a page, only to delete Block objects and append Child block objects. This means that in order to change images, all the objects on a page need to be cached in an array in the precise order that they appear on the page. The image links in this cache need to be changed to reflect the updated links, then all the blocks need to be deleted, and only then can this revised cache be appended as new child blocks.
Below the swapLinks() function, paste the following replaceCharts() function.
Since replaceCharts() supports multiple image links, the imgUrls parameter must be passed in as an array. Test this function by pasting the following replaceCharts() function call under its definition with your Imgur image link as a single string element in an array.
Run this code with npm run start in the terminal and watch your Notion “Chart” page change right before your eyes!
Delete the call to replaceCharts() and proceed to the final step of this tutorial to put it all together.
Refresh the Notion Page
Now that you have completed all the pieces required to create a chart from Notion database data and replace existing images on a Notion page, the last step is to create a driver function that will call each function and pass the information from one to the next.
After the replaceCharts() function definition, paste the final function of this tutorial, refreshPage() below.
Test this function by pasting the following call after the refreshPage() function definition.
Feel free to change the chartType to bar instead of pie to see a new chart, or add additional data to your database to watch how everything changes!
Now you can generate charts from Notion database data!
By harnessing the power of multiple API’s and platforms, you were able to provide non-native functionality to your Notion page. Visualization is a powerful tool for getting a quick overview without reviewing the raw data, and now that you have the means to make your own, the possibilities are endless!
If you are in the market for more project ideas, I highly recommend browsing the Twilio blog for some inspiration. Until then, keep building and happy coding!
Hayden Powers is a Developer Voices intern on Twilio’s Developer Network team. She enjoys enthusing over creative ideas and endeavors, and hopes you will reach out to her with yours at hpowers[at]twilio.com or on LinkedIn.
Related Resources
Twilio Docs
From APIs to SDKs to sample apps
API reference documentation, SDKs, helper libraries, quickstarts, and tutorials for your language and platform.
Resource Center
The latest ebooks, industry reports, and webinars
Learn from customer engagement experts to improve your own communication.
Ahoy
Twilio's developer community hub
Best practices, code samples, and inspiration to build communications and digital engagement experiences.