Introducing Request Replay: An Easier Way To Debug and Deploy Your Twilio Apps
Time to read:
April 28, 2014
Written by
This post is part of Twilio’s archive and may contain outdated information. We’re always building something new, so be sure to check out our latest posts for the most up-to-date insights.

At Twilio, we’re constantly looking for new ways to give developers greater visibility into their applications. Tools like the API Explorer, App Monitor, and Test Credentials help make Twilio applications easier to operate, debug, and deploy.
Today we’re happy to introduce you to a new feature in that same family, Request Replay, making it easier for you to debug applications and compare failed requests against one another.
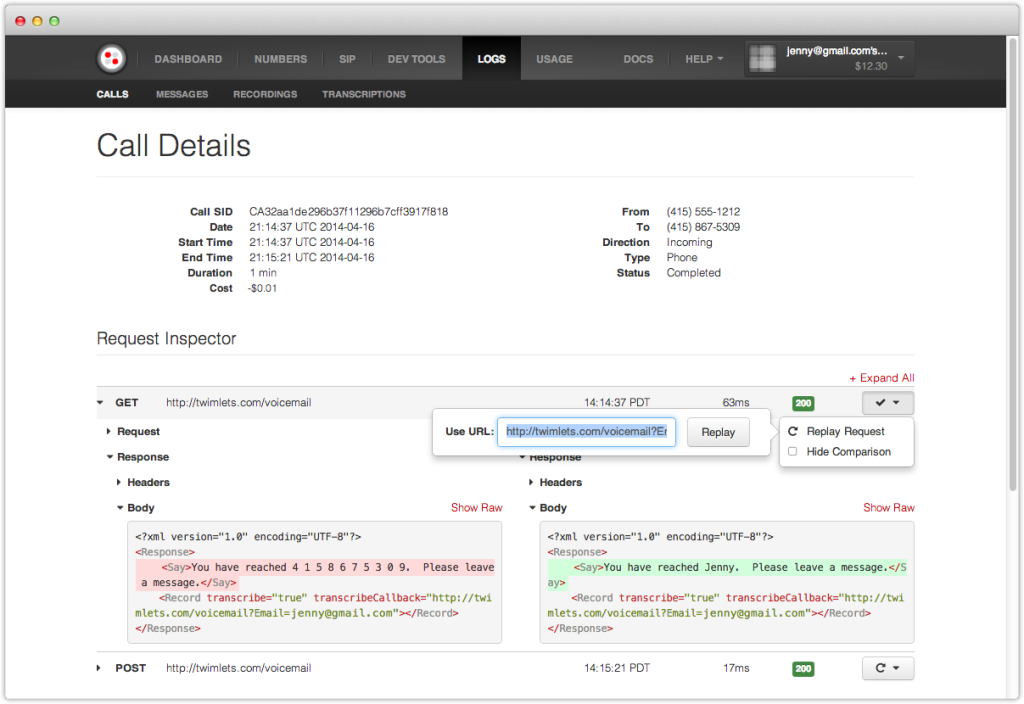
Side By Side Comparison
The Request Inspector tool gives developers insight into the response of their web server and the TwiML Twilio executes. But, when a request fails, developers are left to their own devices to reproduce the problematic request and debug it in the context of their application. That’s where Request Replay comes in.
In the App Monitor and Call Details page, you can find a log of all the requests Twilio makes to your application. Once you’ve identified a failed request, you can replay it and see the side-by-side difference between the two responses.
The replayed request is identical to the original. Twilio will send all the same header and request information. You can even play the request back against a different endpoint, so you can test a failed production request against your development server.
Request Replay is a big step forward in making developing and debugging Twilio applications a more seamless process for developers. We hope you think so, too and we can’t wait to see what you build using it.
Related Posts
-
 Ride the AI Wave with Conversation Relay: Effortless Voice AI, Made HumanJason Spulak
 -
 Twilio named a Leader in the 2026 Gartner® Magic Quadrant™ for CPaaS for the fourth consecutive yearKathryn Murphy
 -
Introducing the Twilio MCP Server and Skills: Give Your Coding Agents Native Access to 1,800+ Twilio APIsSeline Chen Christopher Lintz
Related Resources
Twilio Docs
From APIs to SDKs to sample apps
API reference documentation, SDKs, helper libraries, quickstarts, and tutorials for your language and platform.
Resource Center
The latest ebooks, industry reports, and webinars
Learn from customer engagement experts to improve your own communication.
Ahoy
Twilio's developer community hub
Best practices, code samples, and inspiration to build communications and digital engagement experiences.