How To Setup Your Elasticsearch Cluster and Backup Data
Time to read:
August 14, 2020
Written by
Reviewed by

You may be familiar with some of the well-known SQL and NoSQL databases such as MySQL, MongoDB, and Postgresql. These databases are used primarily to store structured and unstructured data, though can also be used to query records, filter and sort by keywords. Elasticsearch on the other hand is an open source full text search engine; and it has been optimized for searching large datasets without requiring knowledge of a “querying language”.
It also integrates Kibana, a tool to visualize Elasticsearch data, that allows quick and intuitive searching of data. Elasticsearch supports storing, analyzing, and searching data in near real-time. It’s scalable, customizable, and lightning quick.
In this tutorial, you will learn how to set up your own Elasticsearch cluster, add documents to an index in the cluster; and backup your data.
Tutorial requirements
Set up Elasticsearch and creating a cluster
You can get Elasticsearch up and running by following the steps shown below.
There are multiple ways to set up an Elasticsearch cluster, in this tutorial we will run Elasticsearch locally on our new three-node cluster.
Download the appropriate Elasticsearch archive or follow the commands on this guide if you prefer:
- Windows: elasticsearch-7.8.1-windows-x86_64.zip
- Linux: elasticsearch-7.8.1-linux-x86_64.tar.gz
- Mac: elasticsearch-7.8.1-darwin-x86_64.tar.gz
We can extract the archive with terminal. Locate the tar file on your computer (I moved my file to Documents) If you chose to download Elasticsearch with brew or a similar command, you can scroll down to the brew installation steps.
If you are using a Windows machine, enter the following command:
For Mac and Linux machines, you can extract the file with this command:
Or you can install Elasticsearch with Homebrew with the following commands:
Next run Elasticsearch with the following commands for your appropriate machine:
Windows:
Mac/Linux:
If you downloaded Elasticsearch with brew you can run it with:
Windows (on two separate terminal windows):
On a fourth tab, check that your three-node cluster is running properly with:
Your output should look similar to below. We can see that all three nodes were detected and the cluster state is green and running.
Store documents on the cluster
In this tutorial, we'll demonstrate storing JSON documents in an Elasticsearch Index. Elasticsearch clusters are partitioned into indexes, which crudely can be thought of as databases storing a group of documents. Let's say we want to use our cluster to store data about our friends and their locations. With the command below we'll create a new index named `friends` and add a document to it with the unique ID 1.
You should see the following output. You can see that the document was created successfully, and that since it is a new document it is “version 1”.
You can retrieve the document we just added with the following command.
Cool, so we’ve demonstrated how to add and retrieve a single document. Let’s take a look at the ease of searching with Elasticsearch by adding some more documents. Use the following command to add more documents to the friends index.
We can see that the new documents were indexed successfully by running:
Let’s search for all the friends in Pittsburgh with the following command:
In our output (partially shown below) we can see that Elasticsearch correctly found Joe, Allison, and Sara.
Elasticsearch offers much more advanced searching, here's a great resource for filtering your data with Elasticsearch. One of the key advantages of Elasticsearch is its full-text search. You can quickly get started with searching with this resource on using Kibana through Elastic Cloud.
Elasticsearch's Snapshot Lifecycle Management (SLM) API
A snapshot is a backup of indices - a collection of related documents - that can be stored locally or remotely on repositories. Snapshots are incremental compared to the last, only new data will be added to the repository, preserving space.
The Snapshot Lifecycle Management (SLM) API of Elasticsearch allows you to create and configure policies that control snapshots. You can use the SLM API to create, delete, update, and modify such policies on your newly created cluster.
Why are snapshots and SLM important?
Snapshots help recover data in case of accidental deletion (or intentional) or infrastructure outages.

SLM allows you to customize how your data should be backed up throughout and within a cluster.
For example, some data you are storing may contain personally identifiable information and have restrictions on how long it can be stored. You might wish to specify how long those snapshots stay in the repository. Or perhaps you have a cluster that is updated very infrequently and you want to take snapshots for this cluster only once a week. SLM allows you to easily specify and customize and avoids the pain of manually managing snapshots.
Back up your data
To get started with snapshots you need to create a repository to store them. You can do so with the `_snapshot` API of Elasticsearch. I chose to make my repository on a shared file system, but Elasticsearch also supports s3, Azure, and Google Cloud.
The process to create your repository depends on access to cloud repositories unless you wish to use a shared file system such as a Network File System (NFS). You can get started with this resource on registering and creating snapshot repositories.
Now that you have your snapshot repository setup we need to register our repository. For the purpose of this article, we can name the repository as "backup_repo". The following command registers a file system as the repo type.
Make sure to update the location to where your newly created repository is. Here are some sample commands from the Elasticsearch Documentation that you can use for your repo:
We can make sure that the repository we just created has access to all the nodes within the cluster with the following command:

Create a new SLM policy for the cluster
Now create a new SLM policy for the cluster. You can use the following command to create a policy named test-policy, which can be used as a template in this article. The parameters explained below can be modified or used as is.
The schedule field describes what time snapshots will be taken. The name field specifies the naming scheme for snapshots, and the repository is where the snapshots will be stored. Lastly the retention field is how long the snapshot will be retained.
SLM offers additional parameters that you can configure - the official documentation goes through these optional parameters:
We can view the policy we just created with the following command:
The example output could look like the following lines, unless you changed some parameters:
Test the policy
Let's test the policy by executing it and creating a new snapshot.
This command returns the id of the snapshot just created as seen in the output above. In this case a snapshot named daily-snap-2020.07.31-aw6zoe5rrlc_iyqhf0b2rq was created. Let’s check the status of snapshots on our cluster by running another command:
We can see that the snapshot we just created daily-snap-2020.07.31-aw6zoe5rrlc_iyqhf0b2rq completed successfully.
(Optional): Use Kibana for Full-Text Search
We first need to download Kibana. You can follow these commands to download Kibana.
Once downloaded, open the config/kibana.yml file in an editor of your choice. Uncomment the line with elasticsearch.hosts and replace it with elasticsearch.hosts: ["http://localhost:9200"]. We can then run kibana with bin/kibana on Mac or bin/kibana.bat on Windows. Open a new browser with the url http://localhost:5601, and you should see kibana up and running!
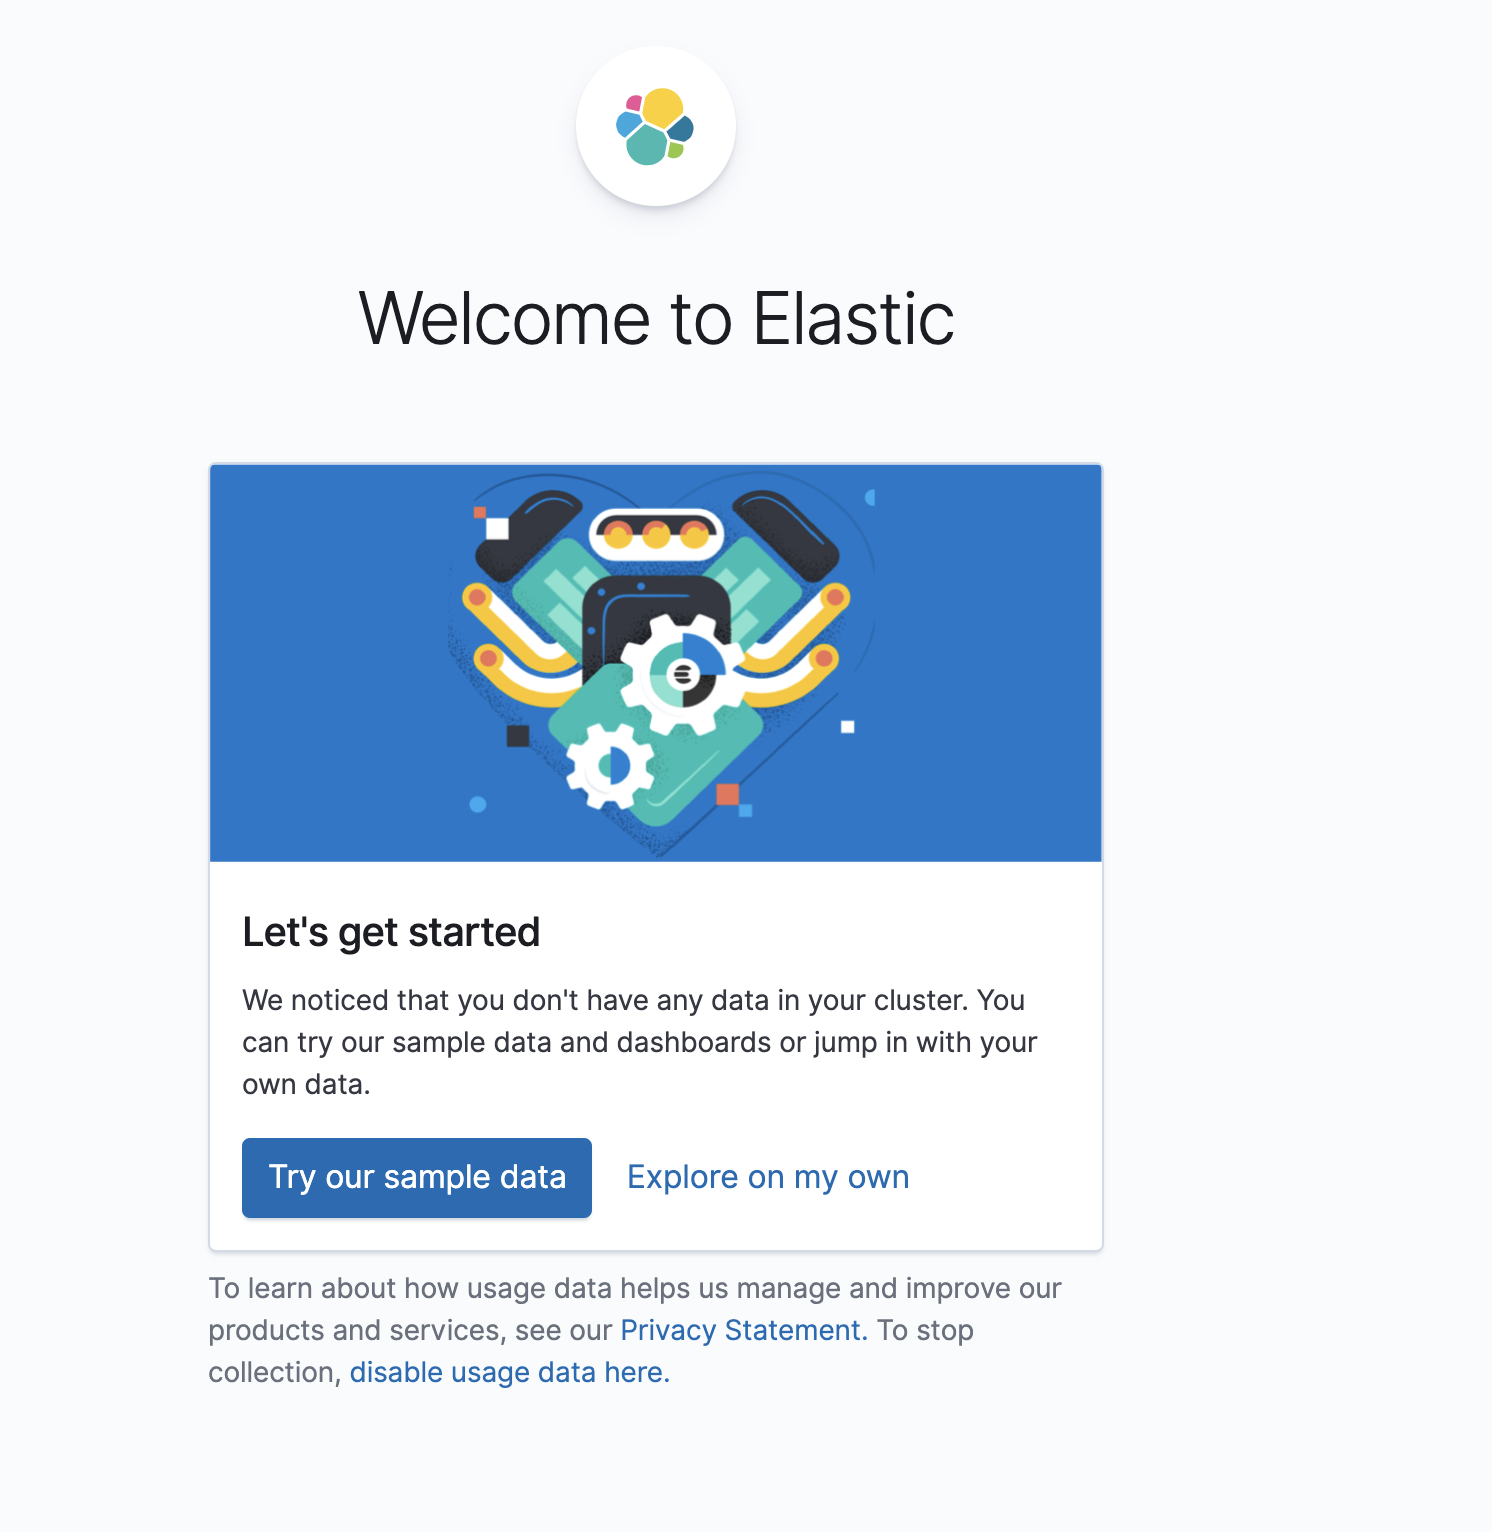
Make sure you have your three node cluster running before running Kibana. You should now see in your browser (at http://localhost:5601) an option to Try our sample data.
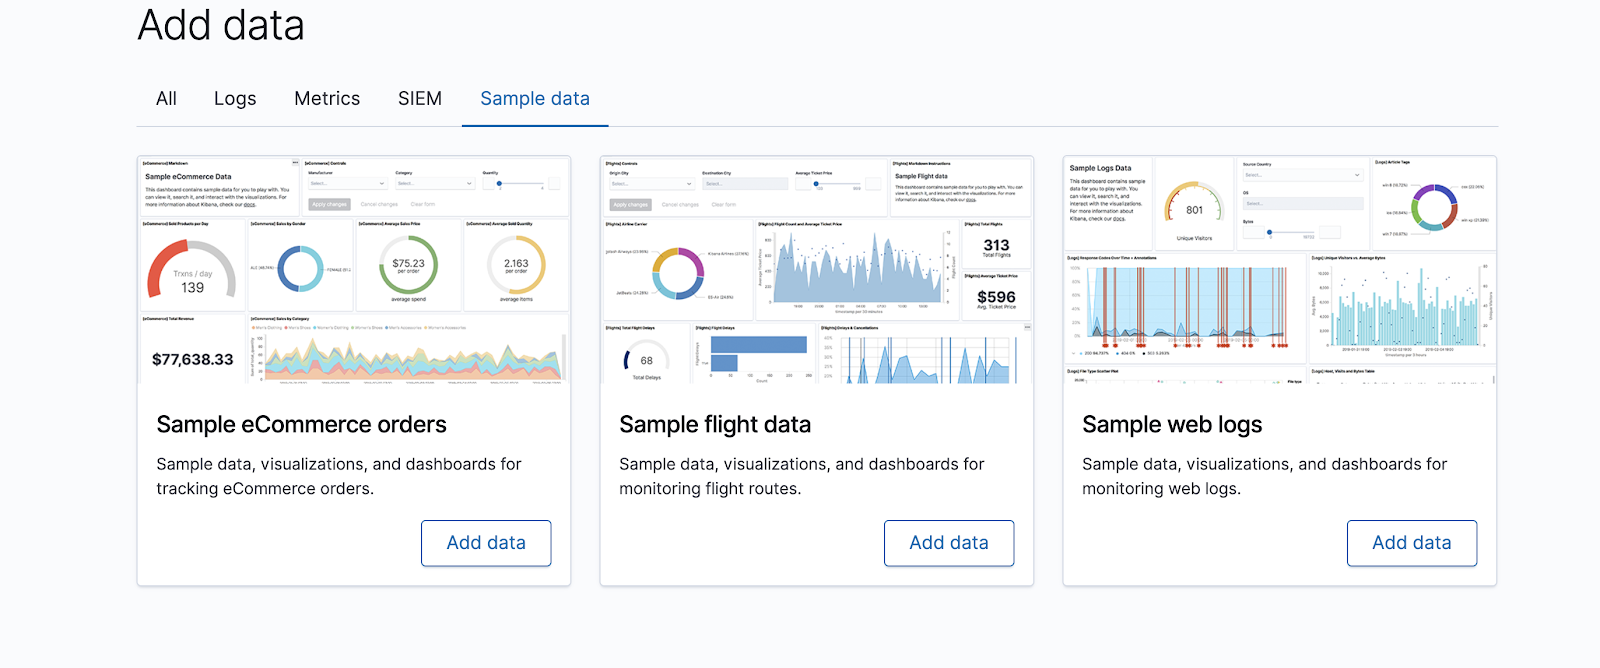
Once you select Try our sample data, you should see three options to add data.
Choose Sample eCommerce orders and select View Data -> Dashboard.
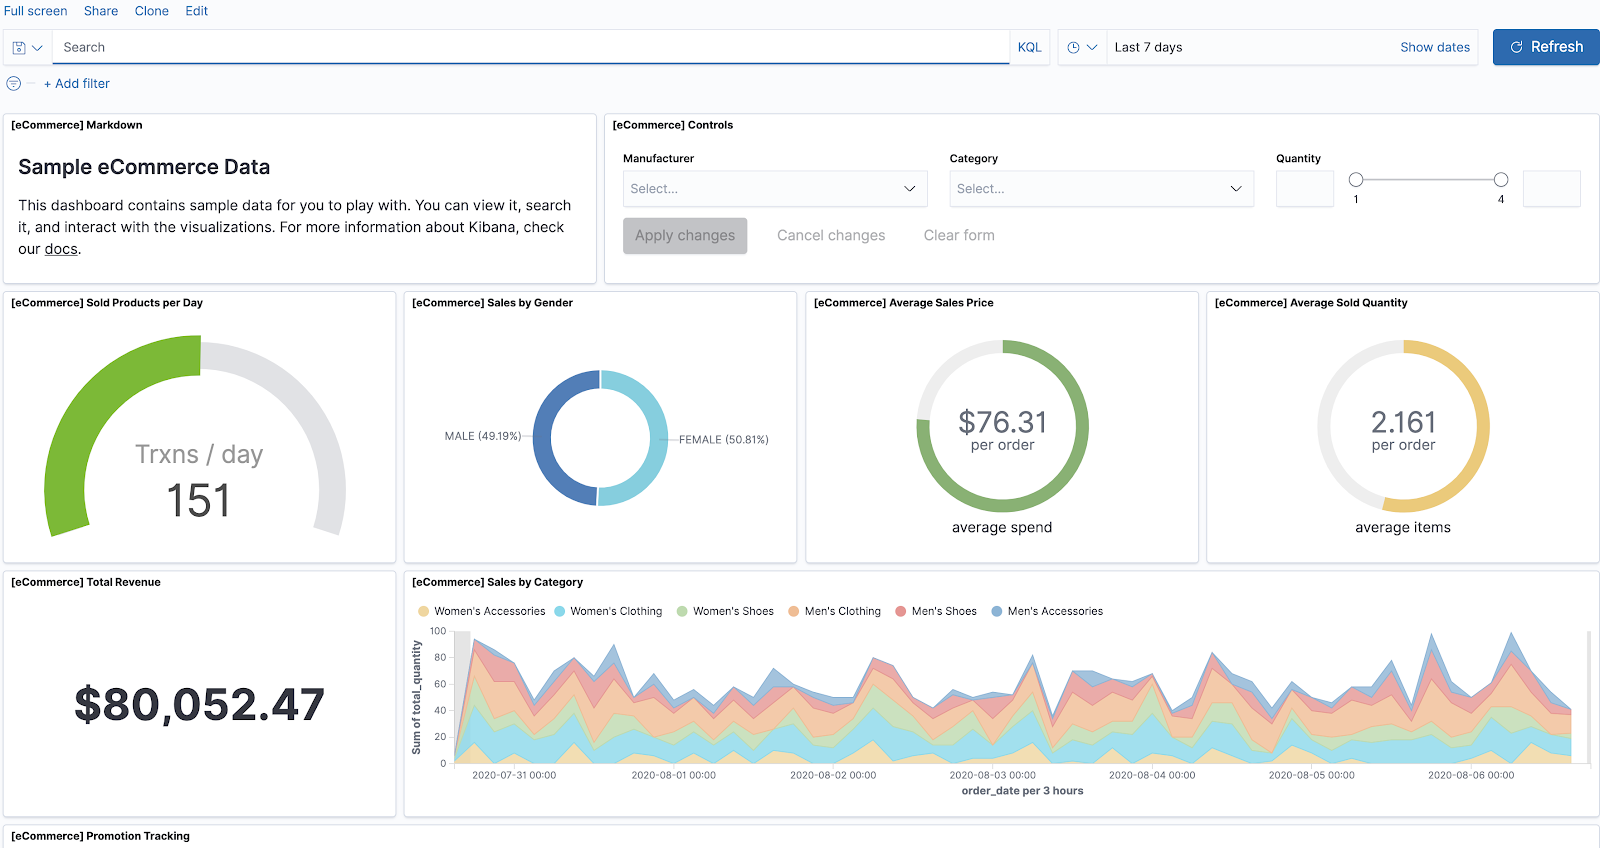
In the search bar enter Angeldale, one of the manufacturers in the dataset, to only visualize data from this manufacturer and click apply on the top right

You’ll notice that the graphics are now different. So far, we’ve set up Kibana and learned how to use it to complete a simple and intuitive search. Here’s a great resource to explore more features of Kibana and visualizing your data.
What’s next for Elasticsearch?
Congratulations, you now have a SLM Policy up and running that will manage snapshots automatically!

SLM supports a ton of other commands that you can use to get a deeper look into snapshots or configure your policies on an index level. The SLM API is a great resource to discover more.
Resources
- Snapshot Lifecycle Management API
- Elasticsearch: Automate Snapshot Backup with SLM
- What is Elasticsearch
- Elasticsearch: Getting Started
Tanvi Meringenti is a software engineer intern on the Elasticsearch team. She is a rising senior at Carnegie Mellon University studying Computer Science. You can contact her at tmeringenti [at] twilio.com or on LinkedIn.

Related Resources
Twilio Docs
From APIs to SDKs to sample apps
API reference documentation, SDKs, helper libraries, quickstarts, and tutorials for your language and platform.
Resource Center
The latest ebooks, industry reports, and webinars
Learn from customer engagement experts to improve your own communication.
Ahoy
Twilio's developer community hub
Best practices, code samples, and inspiration to build communications and digital engagement experiences.