Announcing the beta release of Voice Diagnostics Web App and RTC Diagnostics SDK
Time to read:
July 09, 2020
Written by

We are thrilled to announce the beta release of the Voice Diagnostics Web App and the accompanying RTC Diagnostics SDK and Client JS SDK's Device.runPreflight. These tools are designed to simplify checking for browser calling readiness and diagnosing network related issues. Today, they are available in beta and they are open source.
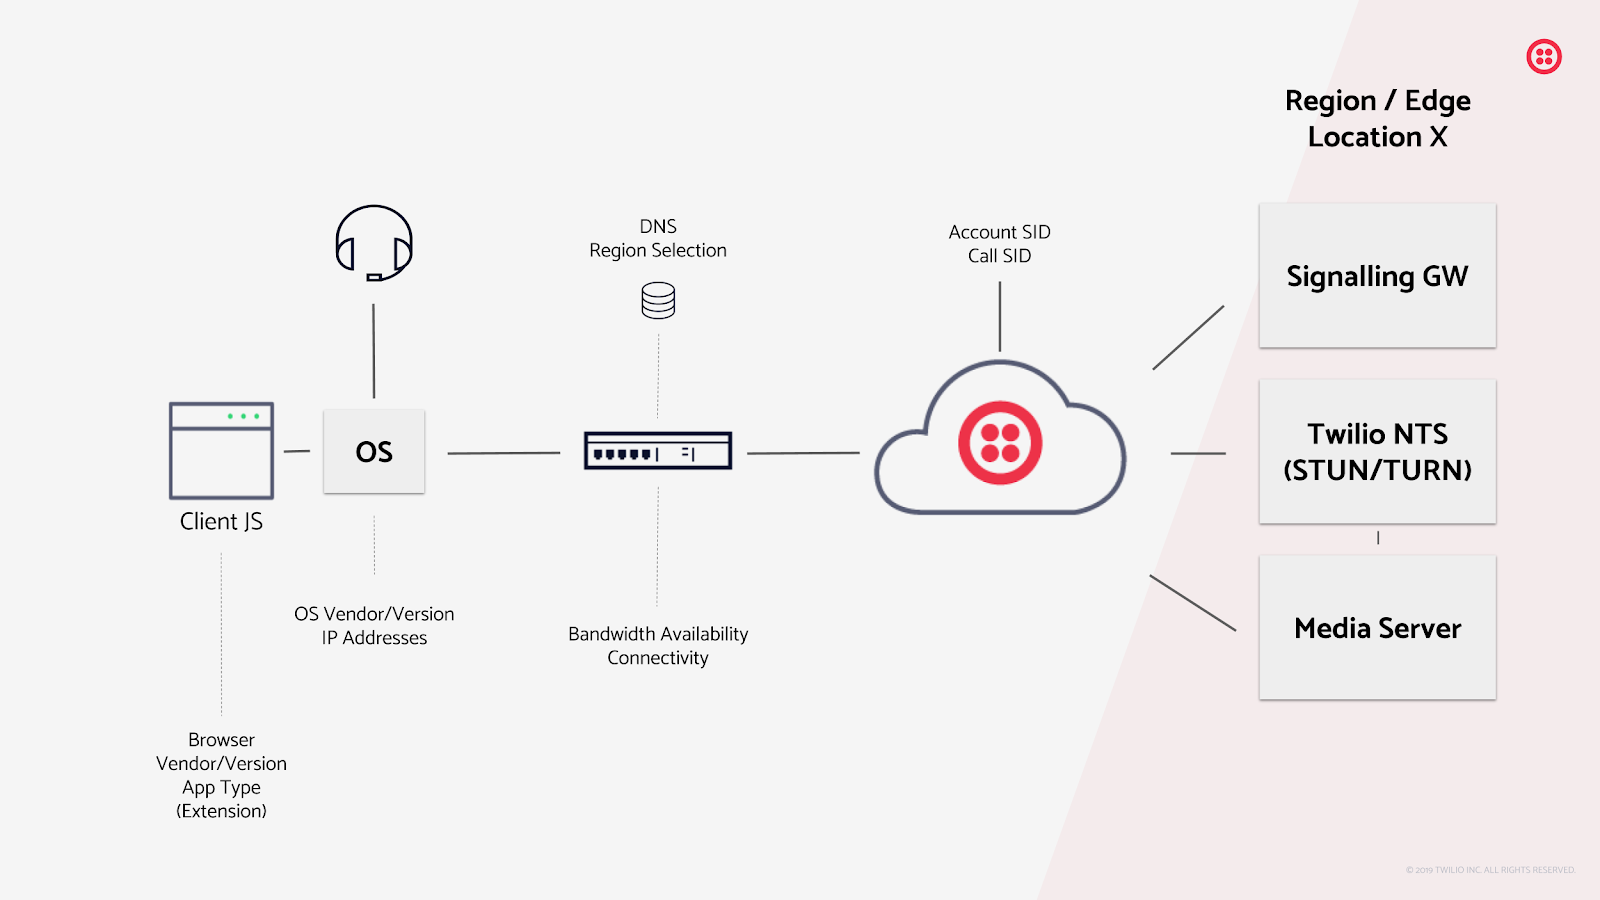
A typical VoIP service requires many connected parts to work together flawlessly. The Voice Diagnostics Web App and SDK help with checking for VoIP calling readiness
Twilio Programmable Voice and WebRTC capable browsers have paved the path for VoIP and contact center service providers to implement cheaper and more engaging calling experiences compared to traditional desk phones and PSTN. As with any VoIP service deployment, specific network setup and hardware is required to provide high quality VoIP calls. Prior to the Diagnostics SDK and Voice Diagnostics Web App, only https://networktest.twilio.com was available to test browser calling readiness. While the network test tool was useful to test local network environments, the application and tests could not be easily consumed by developers or integrated into an application workflow.
Introducing the Voice Diagnostics Web App
The Voice Diagnostics Web App is an open source ReactJS application that tests browser compatibility as well as network bandwidth and connectivity.
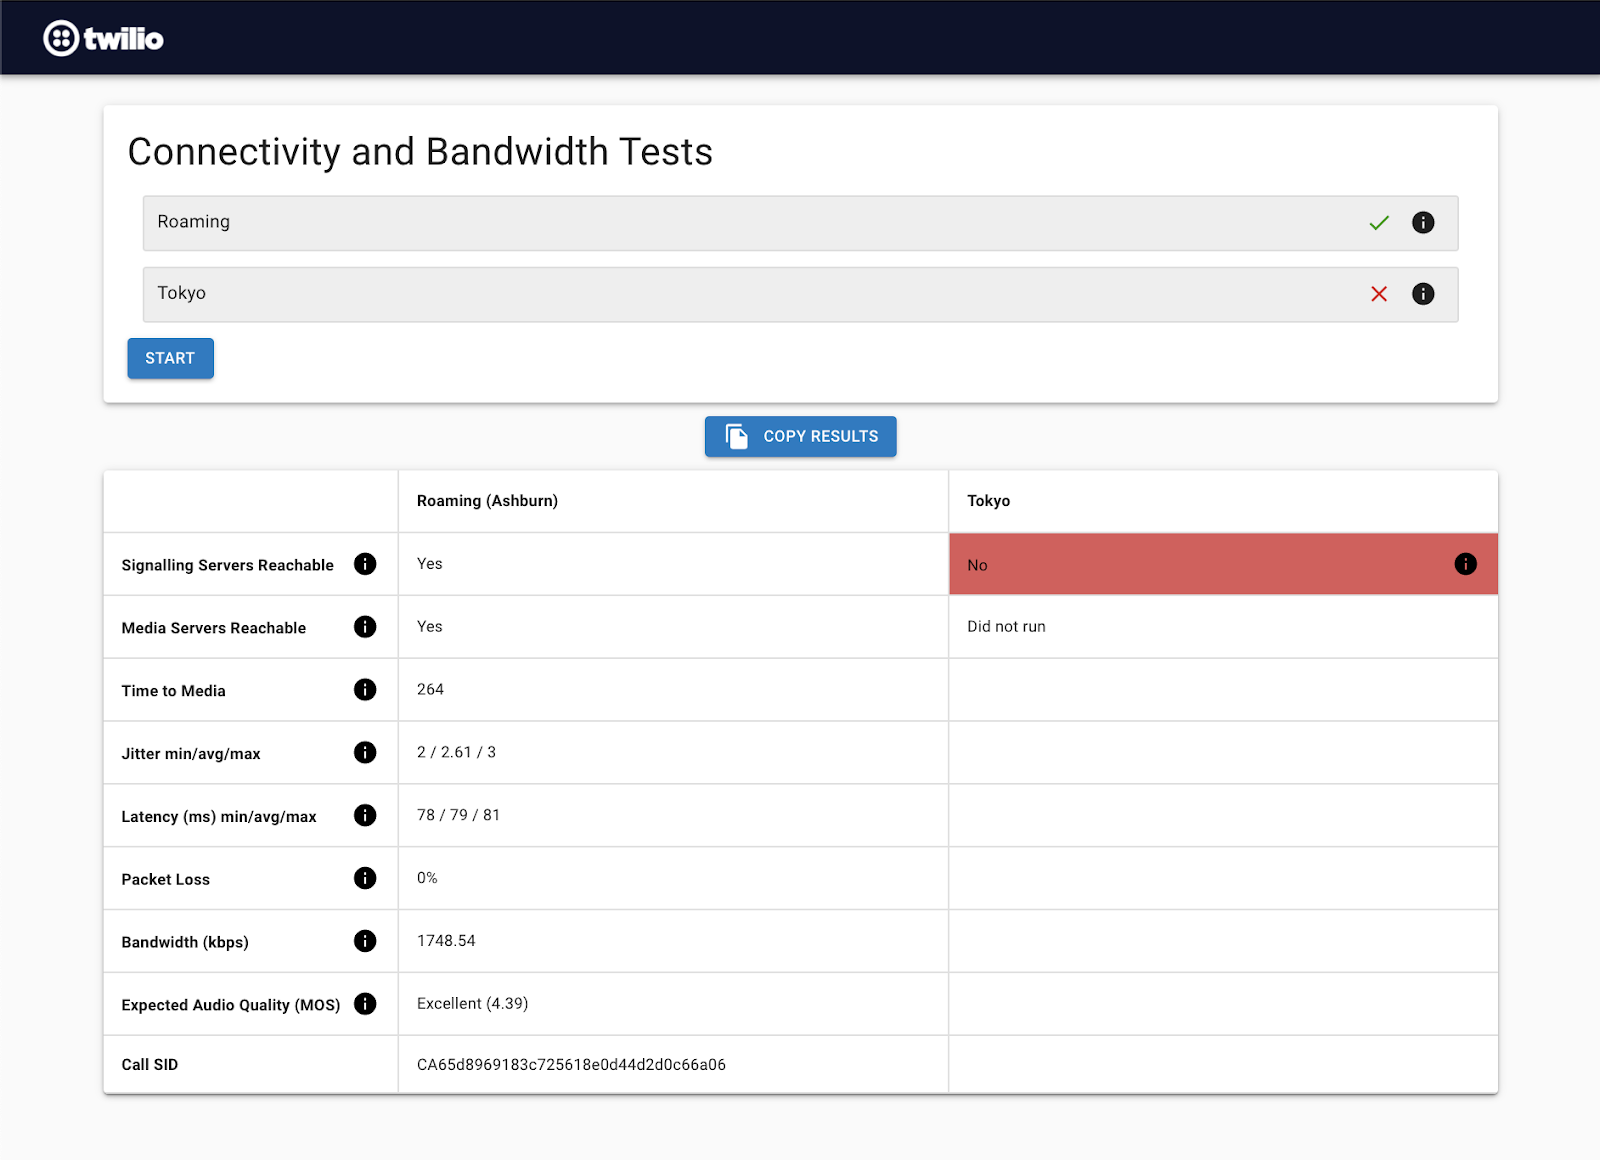
The Voice Diagnostics Web App after running a test towards Roaming and Tokyo regions
This web application introduces many features:
- Open source, brandable/themable, and widget based application
- Supports testing multiple Edge locations (regions)
- Tabulates the results to simplify analysing and detecting underlying issues
- Detects if TURN is required to set up calls
- Does not require user input when performing the tests
- Generates JSON formatted test report for all edges that were tested
- Easy to copy the JSON formatted report to simplify sharing
- Ready for self hosting or embedding into other web applications
Getting started with the Voice Diagnostics Web App
The Voice Diagnostics Web App is a “quick deploy” ReactJS based application. It is deployed to Twilio’s serverless which provides the necessary endpoints and the hosting of the web application.
To get started with the Voice Diagnostics Web App:
1. Ensure all prerequisites are in place:
a. A Twilio account. Sign up for free here
b. Node.js v12+
c. NPM v6+ (comes installed with newer Node versions)
2. Clone the repository
3. Go to the the repository directory and Install dependencies
4. Add your account SID and Auth token to .env (see the template .env.example)
5. Deploy to Twilio Serverless
6. Finally, using a browser, navigate to the URL printed out after the deployment finishes
See the README for more information about getting started and deploying the App.
Interpreting the results
The tests can be classified as connectivity, audio quality, and bandwidth tests. Each of these tests can reveal issues with network setup and or networks that do not meet the requirements for establishing high quality VoIP calls.
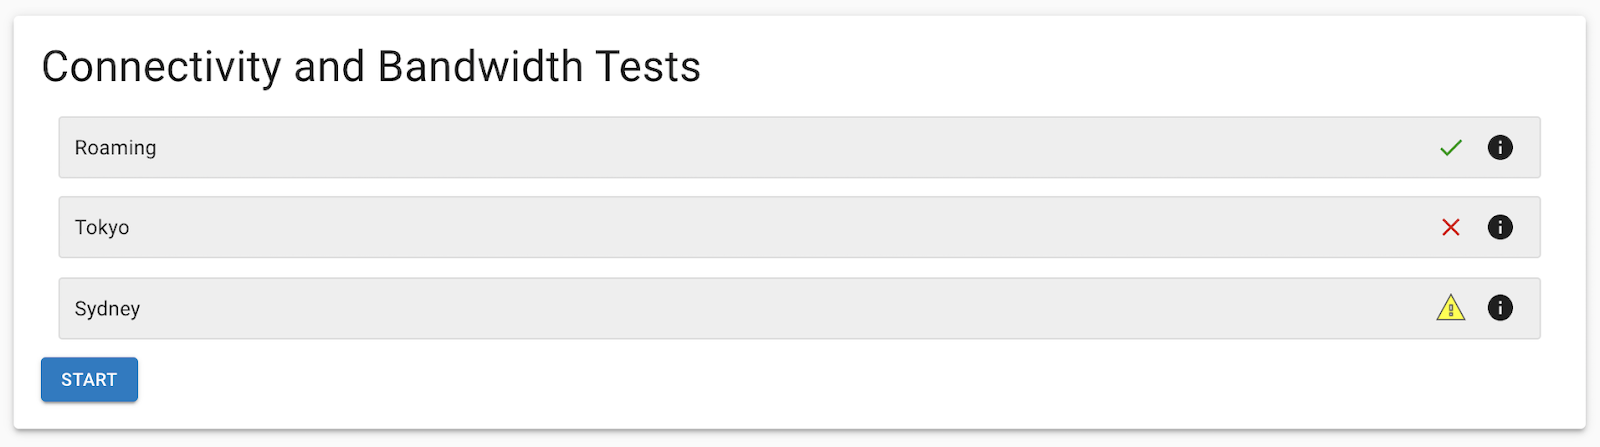
As each edge location test completes, either a check mark, a warning, or a red X icon is displayed to show the result and an info icon is also displayed next to the test result icon. Hovering over the info icon reveals a popup that summarizes the result.
Once all edge locations are tested, the full results are tabulated. Serious issues are highlighted in red and warnings are displayed in yellow. This allows the tester to quickly identify the problem areas.
|
Test |
Description |
Cause/Remedy |
|
Signaling Servers Reachable |
Ability to connect to the signaling servers. It will not be possible to place calls if the browser cannot connect to the Signaling servers. |
See connectivity requirements for more information to remedy any issues encountered. Issues encountered for this test are often related to a misconfigured or strict firewall or DNS. |
|
Media Servers Reachable |
Tests connectivity to the media servers. Unreachable media servers cause the call to drop prematurely and could cause one way audio type issues. |
See media connectivity requirements for more information to remedy any issues encountered. If TURN is required to establish media flow, it will be shown as a warning to signify the required indirect media connection. Issues encountered during this test are often attributed to misconfigured or strict firewalls. |
|
Time to Media |
The time it takes for the media to flow between the caller and callee after the callee answers the call. The lower the better. A high value indicates latency issues in the connection between the endpoints. A high value degrades usability as caller or callee may start to think the other end cannot hear them. |
Long time to media is usually caused by slow networks or caller or callee being physically far. Other possibilities could include VPN connections that connect to a different edge location. |
|
Jitter |
Jitter is a measure of incoming audio packets time variance. A high value for jitter results in deterioration of sound quality and may introduce unacceptable latency. |
High jitter is usually caused by over utilized networks, certain types of networks e.g. wifi, incorrectly configured router QOS settings, and/or insufficient RAM/CPU. |
|
Latency |
Latency is the time a packet of data takes from sender to receiver. High latency leads to poor user experience as speakers unknowingly begin to talk over each other. |
High latency is usually attributed to slow or overloaded networks, being physically far from the edge location, and/or using VPN that doesn't allow routing of the media through the shortest route. |
|
Packet Loss |
The percentage of packets lost. High packet loss results in missing audio fragments leading to unintelligible speech. |
High packet loss is usually caused by overloaded routers and networks and/or incorrectly configured router QOS settings |
|
Bandwidth |
The bandwidth test performs a symmetrical bandwidth test using a loopback loop through a TURN server. | |
|
Expected Audio Quality (MOS) |
Expected audio quality is calculated from jitter, latency, and packet loss measured. A measure of 3.5 and above is needed for good user experience. |
How Does it work?
The Web App consists of a ReactJS frontend application and backend endpoints that generate the tokens to access Twilio Global Network Traversal Service and Programmable Voice, and an endpoint to serve the static assets that are required to render the frontend application.
All endpoints and static assets are deployed using Twilio Serverless and are accessed using the generated Application URL once the deployment completes.
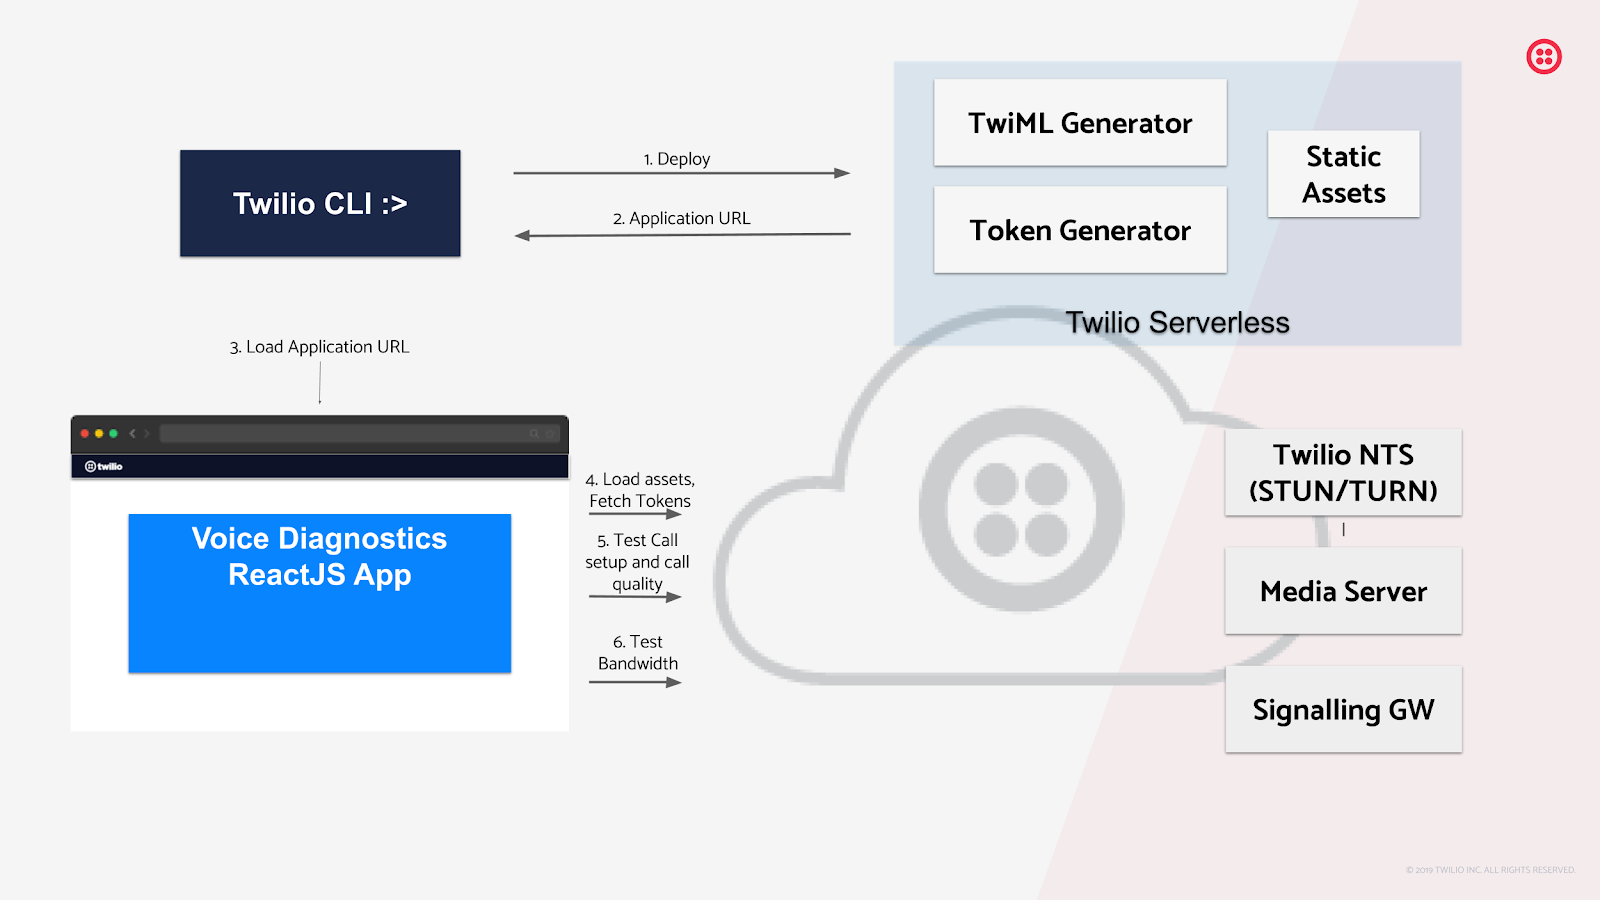
A high level overview of the Diagnostics Web App deployment and interaction with Twilio
The Voice Diagnostics Web App is composed of multiple widgets and makes use of the functionality provided by RTC Diagnostics SDK and the new function, Device.testPreflight, that was added to the Voice Client JS SDK.
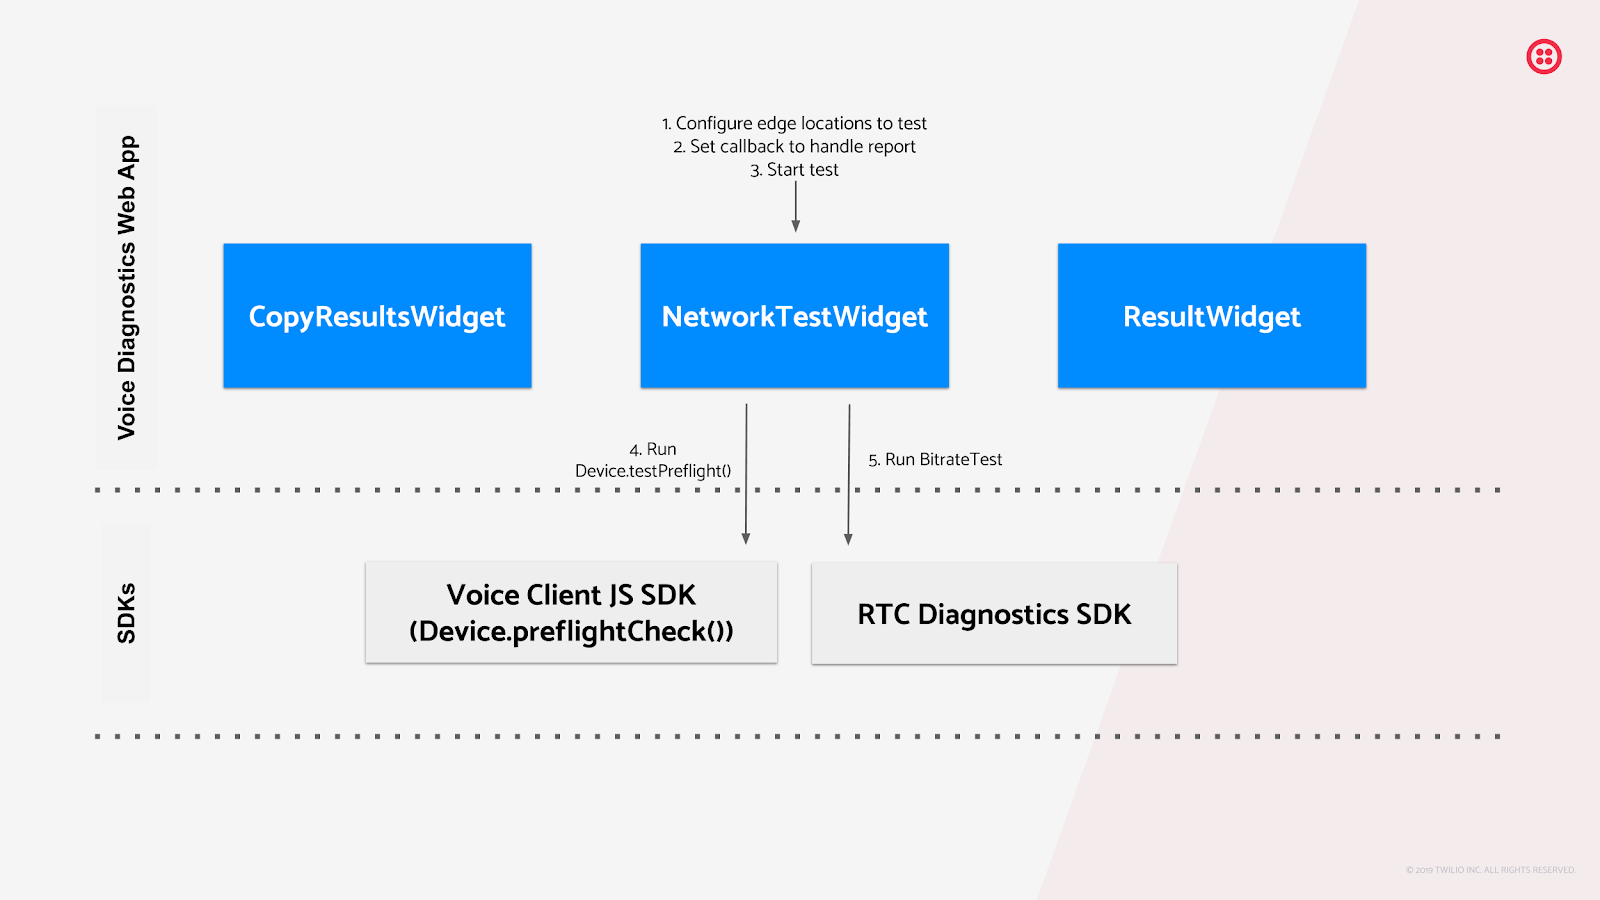
NetworkTestWidget
This widget is responsible for orchestrating the network and connectivity tests as well as aggregating the results in a test report. It makes use of the BitrateTest class in RTC Diagnostics SDK and the preflight test included in Voice Client JS SDK.
This widget is initialized with an array of edge locations to test, a Promise that will resolve with the NTS token, another Promise that will resolve with an AccessToken to connect to Programmable Voice, and a completion handler that can process or display the results.
For example, to test Roaming and Tokyo edge locations:
The completion handler (setResults) will receive a JSON formatted report that includes the connection test results to all tested regions.
The Voice Diagnostics Web App sets a completion handler which will initialize and display the ResultWidget and the CopyResultsWidget.
Customising Voice Diagnostics Web App
The Voice Diagnostics Web App uses Material UI framework for rendering all widgets. Material UI makes it easy to theme the widgets. See Material UI Theming for more details.
Device.testPreflight
The new Device.testPreflight is available in Twilio Voice Client JS SDK. This method places a loopback call which allows it to analyse network connectivity and audio quality. This method could be used to build bespoke test flows. For example, since it does not require user input, it can be used to perform passive tests by placing and analysing short duration calls.
This report generated by this method includes network timing, VoIP packet related statistics e.g., jitter, MOS, latency, and packet loss, the edge location that was used, and includes the same warnings that are logged to Voice Insights dashboard.
Furthermore, the call SID that is included in the test report can be used to extract data from Voice Insights.
See the Device.testPreflight documentation for more in-depth information.
RTC Diagnostics SDK
The RTC Diagnostics SDK provides BitrateTest, InputTest, and OutputTest classes to test the bitrate, microphone, and speakers respectively. The tests generate JSON formatted reports that can be logged or rendered.
The BitrateTest class is used by NetworkTestWidget to determine the approximate bandwidth between the browser and Twilio. This test is performed using Twilio’s TURN server by setting up a loopback connection: The data that is sent to the TURN server is echoed back. In general, upload speeds are slower than download speed. This means, when running this test, the maximum bandwidth will be limited by the upload speed. For more information, see the API documentation.
The InputTest class exposes mic testing functionality and the OutputTest class tests the selected speakers. These test classes can be used to test the local hardware. This is useful to ensure the correct mic and speakers are selected and are working as expected. The Voice Diagnostics Web App will add a test widget for each in an upcoming release.
To get started with the RTC Diagnostics SDK see more here.
Looking ahead
We are very excited about this release and look forward to your feedback. We can’t wait to see what you build next!

Related Resources
Twilio Docs
From APIs to SDKs to sample apps
API reference documentation, SDKs, helper libraries, quickstarts, and tutorials for your language and platform.
Resource Center
The latest ebooks, industry reports, and webinars
Learn from customer engagement experts to improve your own communication.
Ahoy
Twilio's developer community hub
Best practices, code samples, and inspiration to build communications and digital engagement experiences.