Voice Insights for Chrome gets a facelift
Time to read:
March 22, 2017
Written by
This post is part of Twilio’s archive and may contain outdated information. We’re always building something new, so be sure to check out our latest posts for the most up-to-date insights.

Voice Insights is an analytics tool that provides you with actionable insights into metrics that affect call quality in real time, even when a call is in progress. We are excited to announce the latest updates to Voice Insights based on your fantastic feedback. We enhanced our Voice Insights dashboards to let you easily track and understand your end users’ experience with Twilio. Sitting behind these new dashboards are significant improvements we have made in accurately capturing and analyzing call quality metrics.
If you’re new to Voice Insights, you can get started with a single flip of a switch here. Using Voice Insights requires no code changes if you’re using Twilio JS 1.3 or 1.4. If you already know about Voice Insights, you can skip ahead to enhancements or read on for some more background.
Background – What is Voice Insights?
You’re working hard to deliver a great calling experience to your users. Rapidly diagnosing call quality problems caused by unstable networks or unreliable devices is essential. You need the right tools to do it.
We launched Insights last September to help you get visibility into factors affecting Twilio Client calls and proactively manage your end user’s experience. We enabled features such as on-device network monitors, audio device selection APIs, and in-call feedback reporting, with the release of Twilio Client 1.4. Voice Insights provides you with analytics on these on-device events from your Client app. With Insights you are able to:
- Rapidly address call quality problems: Through on-device alerts and in-console dashboards monitoring metrics such as jitter, packet loss, audio stream level and Mean Opinion Score for each call, you can know which users are having problems. Using the Client APIs, you can alert users on their devices of deteriorating network conditions or audio device faults to self-serve improvements in call quality.
- Track key metrics & proactively reach out to affected users: You can now track key metrics on calls that were dropped, calls that failed to connect, or calls that were affected by network conditions. Using the filters for client ID and IP address, you’ll be able to proactively reach out to your affected users affected by call quality.
Enhancements with the Latest Release
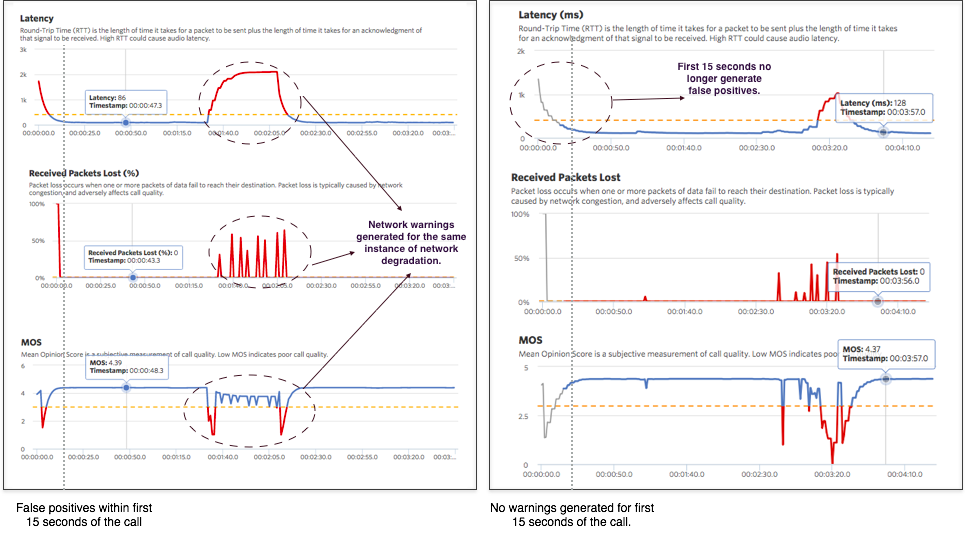
Eliminate False Positives at the Beginning of the Call
Prior to this release, every call started with warnings of high latency, low Mean Opinion Score (MOS) and high packet loss. These warnings were generated during setup-time due to the default network metrics reported by the WebRTC getstats APIs, which do not reflect the actual network conditions. For instance, we found that the first sample in every call has 100% packet loss and a latency greater than 1 second and as a result an unacceptably low MOS. (See image below) This resulted in at least 3 warning events to be fired at the beginning of every call, resulting in a large number of events that were false positives.
We fixed this by avoiding firing any warnings within the first 15 seconds of the call, while the metrics are still being normalized. After 15 seconds, you’ll continue to see any network anomalies highlighted through warnings and on metrics graphs. These changes are reflected in the events log, and through the grayed portion of the charts on the call metrics tab.
Twilio Client JS 1.3 and 1.4 SDKs are constantly sampling jitter, packet loss, latency, and calculate a running MOS. When these metrics drop below a certain threshold for a period of 5 seconds, a network warning event is generated.
During our analysis, we came across case where despite slightly deteriorated network, the perception of the user wasn’t affected. We found that a much more accurate indicator of choppy audio was the “ICE Liveness check failed” event, that resulted in a breakdown of information-exchange required to keep the media session active.
When this event is logged, the call continues, but in most cases, the quality is perceivably degraded. Read more on WebRTC and ICE events here. We eliminated the false positives on aggregates dashboards by replacing the raw warnings on network statistics with the section – “Calls affected by network”. This section provides a count of the number of calls where there was at least one occurrence where ICE connectivity was lost or Low MOS was recorded.
Fix Over-counting the Number of Warnings
We found that each blip in the network could generate at least 4 warnings that represent the same instance of the problem. As these warnings were aggregated across the account, the dashboards showed an inflated number of warnings making it hard to estimate the actual impact on the account.
For example, in the call metrics image above, a blip in the network at 15 seconds into the call resulted in 5 warnings, all of which represented the same instance of the problem. An aggregation of 50 such warnings over a day would still not tell you how many calls had the problem. It could be a single call with 50 warnings, or 10 calls with 5 warnings each. The inability to know the distinction between these cases was limiting in quickly identifying and addressing the root cause.
With the latest release, account dashboards now reflect the number of calls that had quality problems rather than a raw number of warnings and errors. This helps in accurately understanding the calls that were actually affected by a bad network. You will still see the breakdown of the warnings under the “Calls affected by networks” section of the aggregates dashboard.
Breaking Down the Calls By Issues
Instead of reporting the raw number of errors and warnings for the entire call, we have now broken down the affected calls by categories of issues:
- Failed to connect: These are calls that failed to setup. This could be due to authentication problems, due to device setup failures, because of exceeding rate limit, or because the user denied permission to access audio devices.
- Terminated with error: These are calls which were disconnected because of an error. These present a subset of the calls that were dropped. Most often, client calls terminate with errors because of severe network degradation.
- Affected by network: These are calls where ICE liveness check failed, and ICE connectivity was lost, or the MOS dipped below the threshold. These calls did not necessarily drop because of the network, but the user experience was significantly degraded by a poor network.
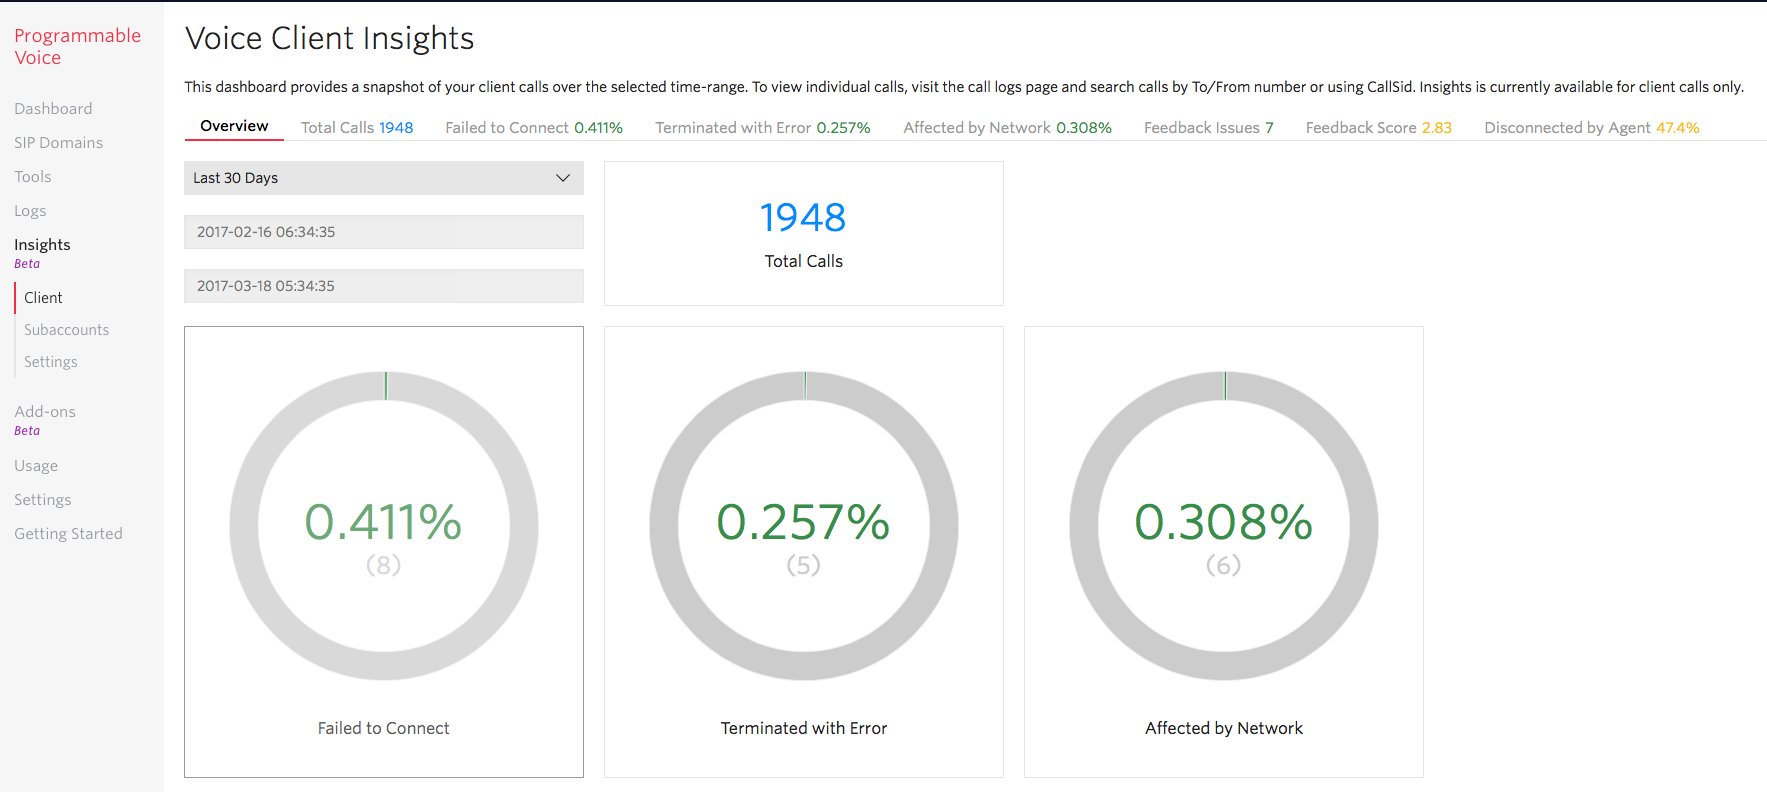
Detailed Dashboard to Drill Into KPIs
Customers reported that despite the data aggregation at an account level, it was hard to track KPIs that accurately reflected the health of the Twilio app. We received feedback on the key metrics that are important to customers – total number of calls, call duration, end-user feedback, the number of bad calls, and who disconnected the call. We redesigned the dashboards to help you easily keep track of these KPIs with an overview page, and then drill into the metrics by each user, and IP address where necessary.
Overall, we have focused on ensuring that you can easily understand and proactively address the call quality problems that are affecting your users. We are working hard to enhance Voice Insights and appreciate your feedback. Our mission is to ensure that you spend zero minutes worrying about call quality as we enhance our Voice SDKs, and provide tools such as Voice Insights to enable proactive actions to manage your users.
Related Posts
Related Resources
Twilio Docs
From APIs to SDKs to sample apps
API reference documentation, SDKs, helper libraries, quickstarts, and tutorials for your language and platform.
Resource Center
The latest ebooks, industry reports, and webinars
Learn from customer engagement experts to improve your own communication.
Ahoy
Twilio's developer community hub
Best practices, code samples, and inspiration to build communications and digital engagement experiences.