A Guide to Node.js Logging
Time to read:
May 06, 2019
Written by

When you start developing in JavaScript one of the first things you'll probably learn is how to log things to the console using console.log. If you search on how to debug JavaScript you'll find hundreds of blog posts and StackOverflow articles pointing you to "simply" console.log it. And because it's such a common practice we even started having linter rules like no-console to make sure we don't leave accidental log statements in our production code. But what if we actually want to log something intentionally to provide more information?
In this blog post we'll look at various situations where you want to log info, what the difference between console.log and console.error in Node.js is, and how you can ship logging in your libraries without cluttering the users console.
Theory First: Important Details for Node.js
While you are able to use console.log or console.error in the browser as well as Node.js, there's an important thing to keep in mind when using Node.js. When you write the following code in Node.js in a file called index.js:
And execute it in the terminal using node index.js you'll see the output of the two directly under each other:
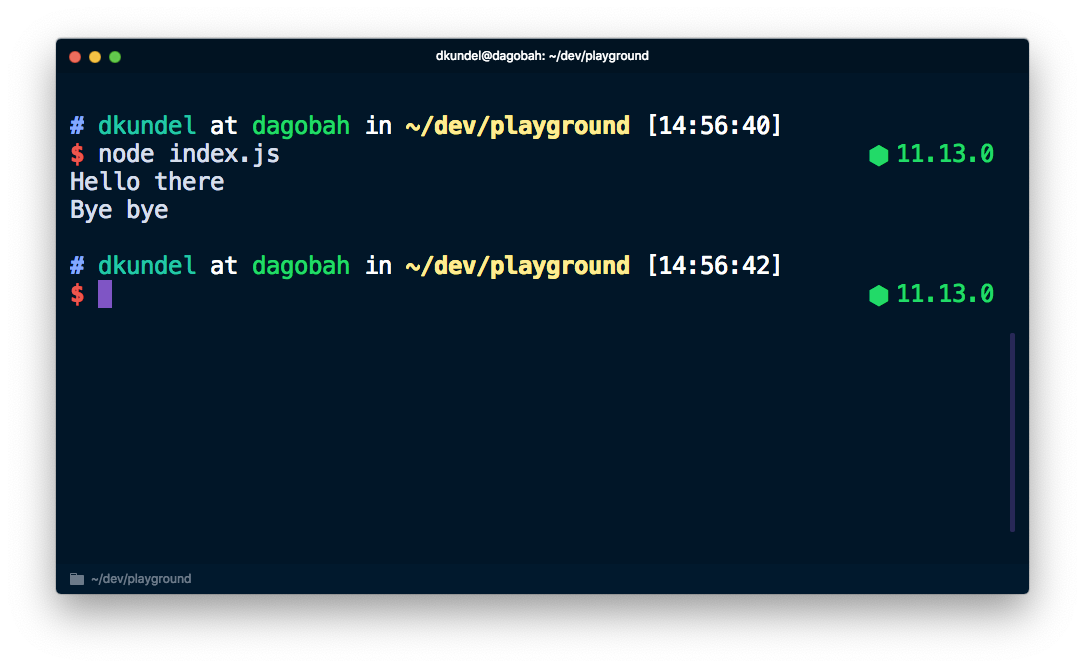
However, while those two might look the same, they are actually treated by the system differently. If you check the console section of the Node.js documentation you'll see that console.log is printing to stdout while console.error uses stderr.
Every process has three default streams that it can work with. Those are stdin, stdout and stderr. The stdin stream is handling the input that comes to your process. For example button presses or a redirected output (we'll get to that in a second). The stdout stream is meant for your application’s output. Lastly stderr is meant for error messages. If you want to understand why stderr exists and when to use it, check out this article.
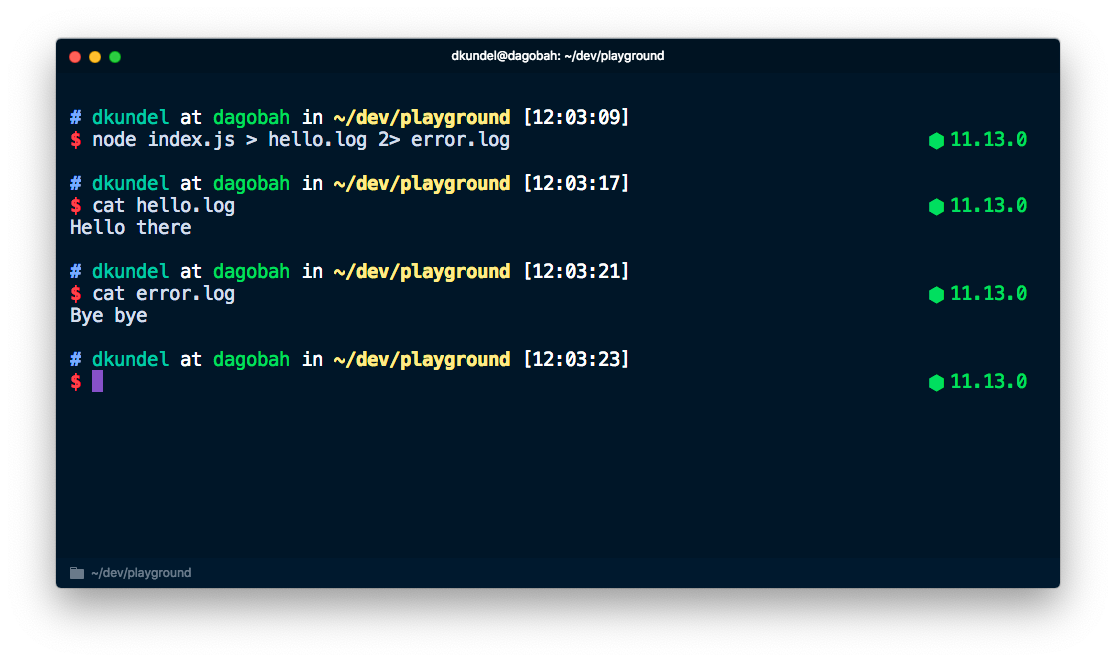
In a nutshell, this allows us to use the redirect (>) and pipe (|) operators to work with error and diagnostic information separate from the actual outcome of an application. While > allows us to redirect the output of a command into a file, 2> allows us to redirect the output of stderr into a file. For example, this command would pipe "Hello there" into a file called hello.log and "Bye bye" into a file called error.log.
When Do You Want to Log?
Now that we've learned a bit about the underlying tech aspect of logging, let's talk a bit about different use cases where you might want to log something. Typically these use cases fall into one of the following categories:
- Quick debugging of unexpected behavior during development
- Browser-based logging for analytics or diagnostics
to log incoming requests, as well as any failures that might have happened
to assist the user with issues
to print progress, confirmation messages or errors
We'll skip the first two in this blog post and will focus on the three Node.js based ones.
Your Server Application Logs
There's a variety of reasons why you might want to log things on your server. Logging incoming requests for example allows you to extract things like statistics out of it, such as how many 404s users are hitting, what those might be or what User-Agent is being used. And you also want to know when stuff went wrong and why.
If you want to try out the things following in this part of the post, make sure to create a new project directory. Create an index.js in the project directory for the code we'll use and run the following to initialize a project and install express:
Let's set up a server with a middleware that just console.log every request for you. Place the following into the index.js file:
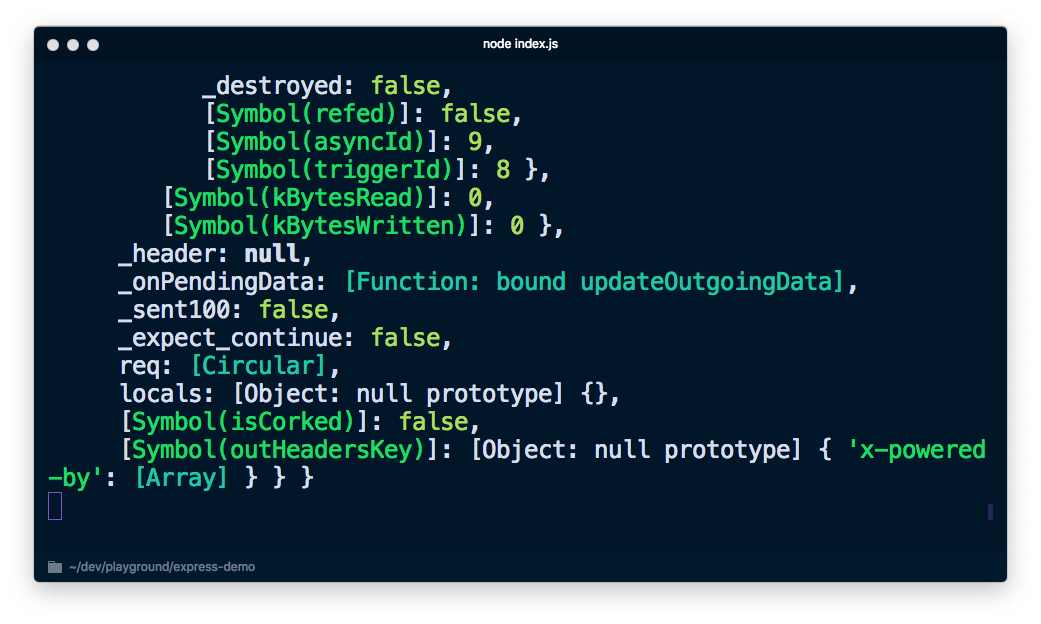
We are using console.log('%O', req) here to log the entire object. console.log uses util.format under the hood that supports additionally to %O other placeholders. You can read about them in the Node.js documentation.
When you run node index.js to execute your server and navigate to http://localhost:3000 you'll notice that it will print a lot of information that we don't really need.
If you change it to console.log('%s', req) to not print the entire object we'll not get much information either.
![Screenshot of terminal printing "[object Object]" multiple times](/content/dam/twilio-com/global/en/blog/legacy/2019/guide-node-js-logging/HhQKjPGMiOT52G3-X53cPGTQmbR3zPoLb5LgKSwrMrK5MYtPfzsHSAyfcqpac_MHWEmfajikg22Chu.png)
We could write our own log function that only prints the things we care about, but let's first take a step back and talk about what we typically care about. While the message often stands in the center of our attention, in reality there's often additional info that we might need. Information such as:
- Timestamp - to know when things happened
- Computer/Server Name - in case you are running a distributed system
- Process ID - in case you are running multiple Node processes using something like
pm2 - Message - an actual message with some content
- Stack Trace - in case we are logging an error
- Maybe some additional variables/info
Additionally, now that we know that everything goes to stdout and stderr anyways, we would probably want different log levels and the ability to configure and filter our logs by them.
We can get all of that through accessing various parts of process and writing a bunch of JavaScript but the best thing about Node.js is that we got the npm ecosystem and there are a variety of libraries already out there for us to use. A few of those are:
I personally like pino because it's fast and has a nice ecosystem. Let's see how using pino can help us with logging. The neat thing is that there's already a express-pino-logger package that we can use to log the requests.
Install both pino and express-pino-logger:
Afterwards update your index.js file to use the logger and middleware:
In this snippet we created a logger instance of pino and passed it into the express-pino-logger to create a new logger middleware to call app.use with. Additionally we replaced the console.log on server start-up with logger.info and added an additional logger.debug to our route to show different log-levels.
If you restart your server by running again node index.js, you see a quite different output that prints a JSON for every line. Navigate to http://localhost:3000 again and you see another line of JSON added.
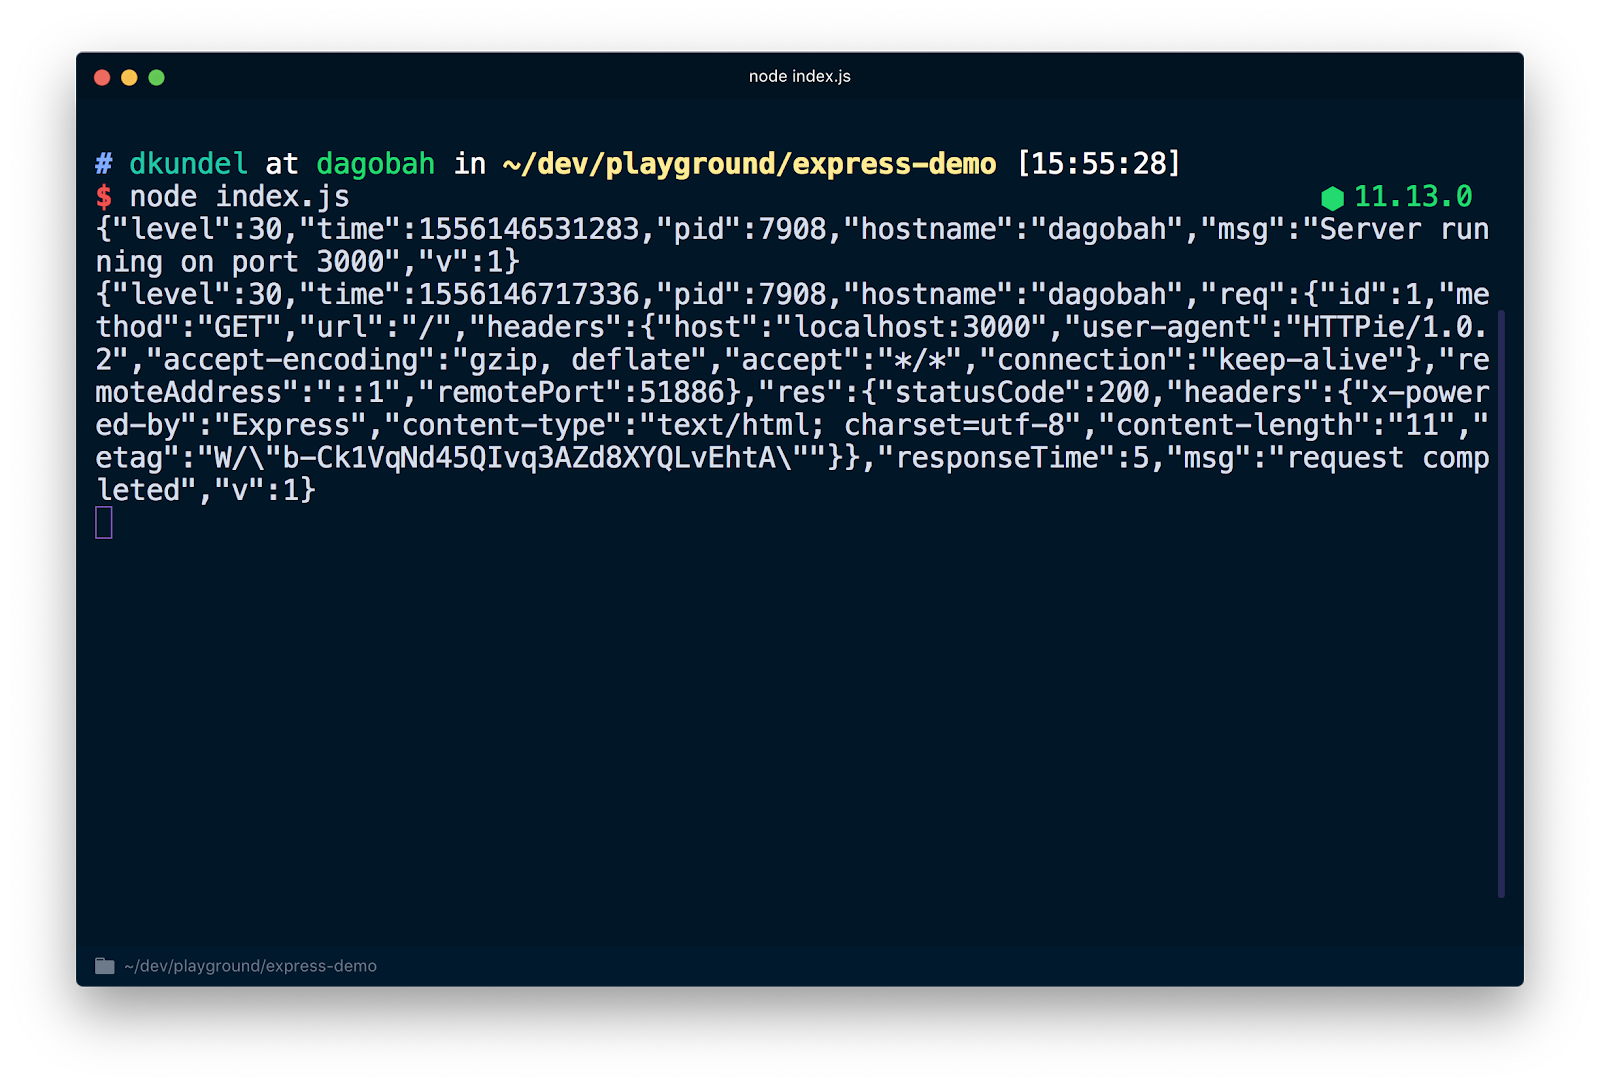
If you inspect this JSON you'll see that it holds all the previously mentioned information like e.g. a timestamp. You might also notice that our logger.debug statement is not printed. That's because we have to change our default log-level to make it visible. When we created our logger instance we set the value to process.env.LOG_LEVEL which means that we can change the value through that, or accept the default of info. By running LOG_LEVEL=debug node index.js we can adjust the log level.
Before we do that, let's address the fact that the output right now is not really human readable right now. That's intentional. pino follows a philosophy that for the sake of performance, you should move any processing of the logs into a separate process by piping (using |) the output. This includes making it human readable or uploading it to a cloud host. These are called transports. Check out the documentation on transports to also learn about why errors in pino are not written to stderr.
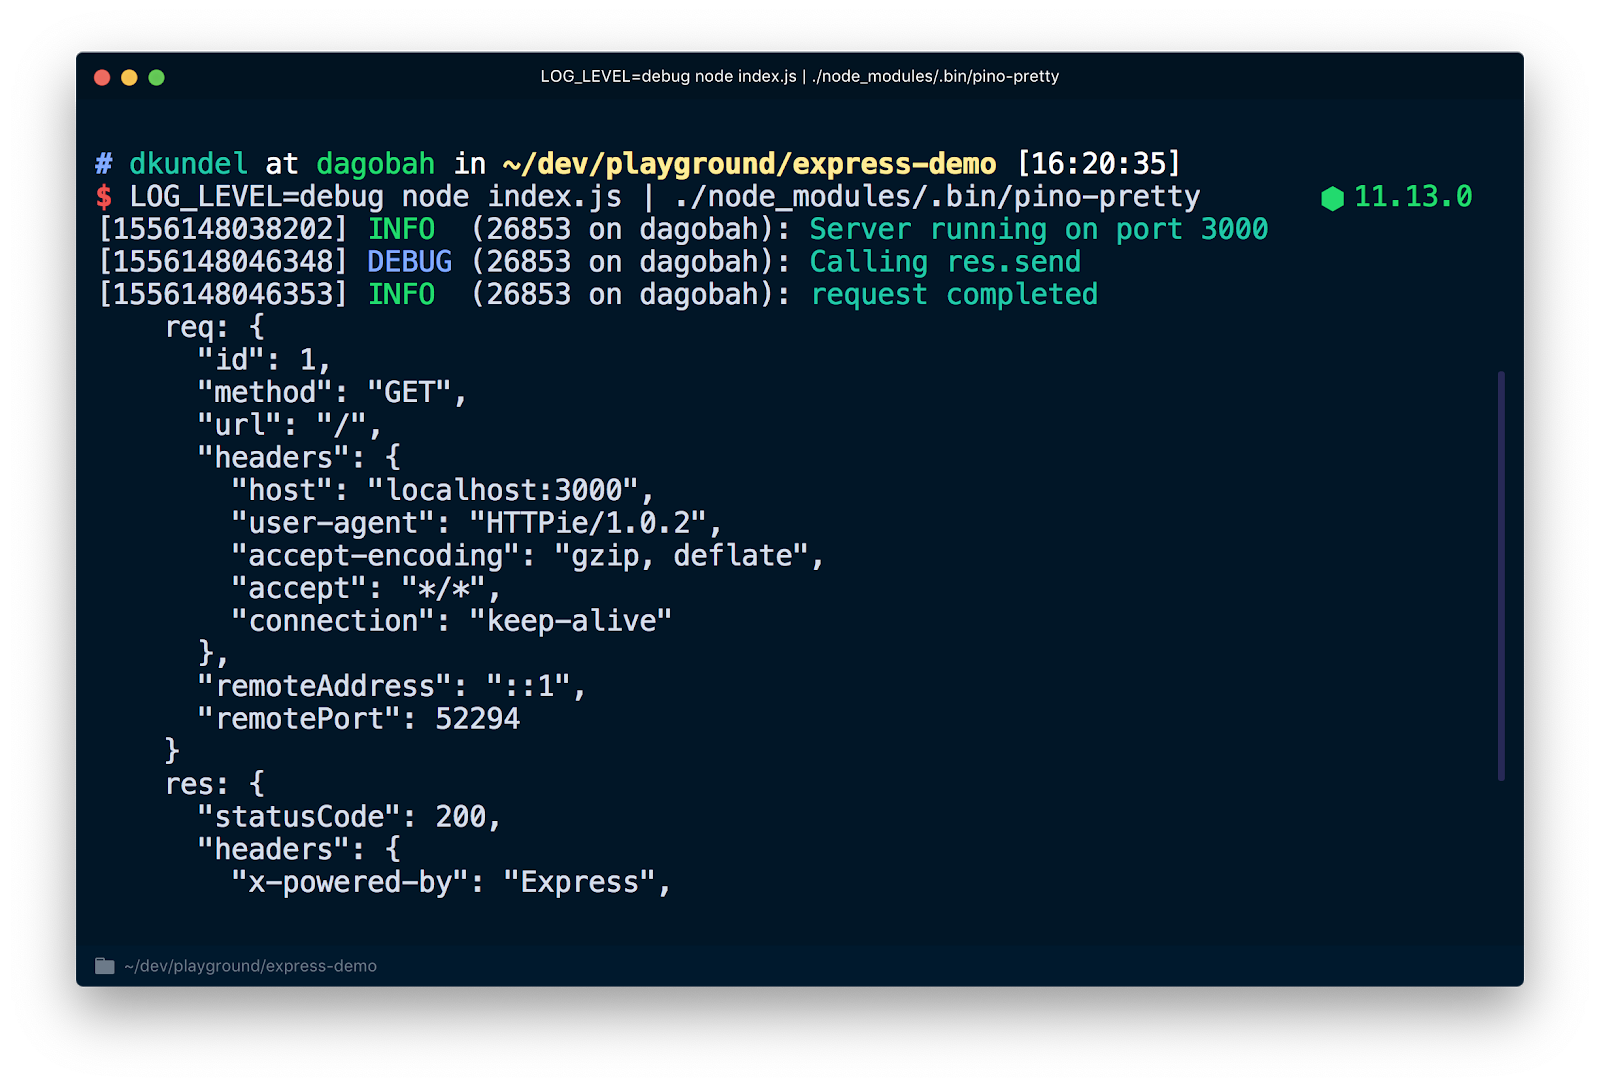
Let's use the tool pino-pretty to look at a more readable version of the logs. Run in your terminal:
All your logs will now be piped using the | operator into the pino-pretty command and your output should be cleaned up to contain crucial info and should be colored. If you request http://localhost:3000 again you should also see your debug message.
There's a variety of existing transports to prettify or transform your logs. You could even display them with emojis using pino-colada. These will be useful for your local development. Once you are running your server in production you might want to pipe your logs into another transport , write them to disk using > to process them later or do both using a command like tee.
The documentation will also contain info on things such as rotating log files, filtering and writing logs to different files.
Your Library Logs
Now that we looked at how we can write logs efficiently for our server applications, why not use the same technology for the libraries that we author?
The problem is that your library might want to log things for debugging purposes but really shouldn't clutter the application of the consumer. Instead the consumer should be able to enable the logs if they need to debug something. Your library should be silent by default and leave writing output to the user.
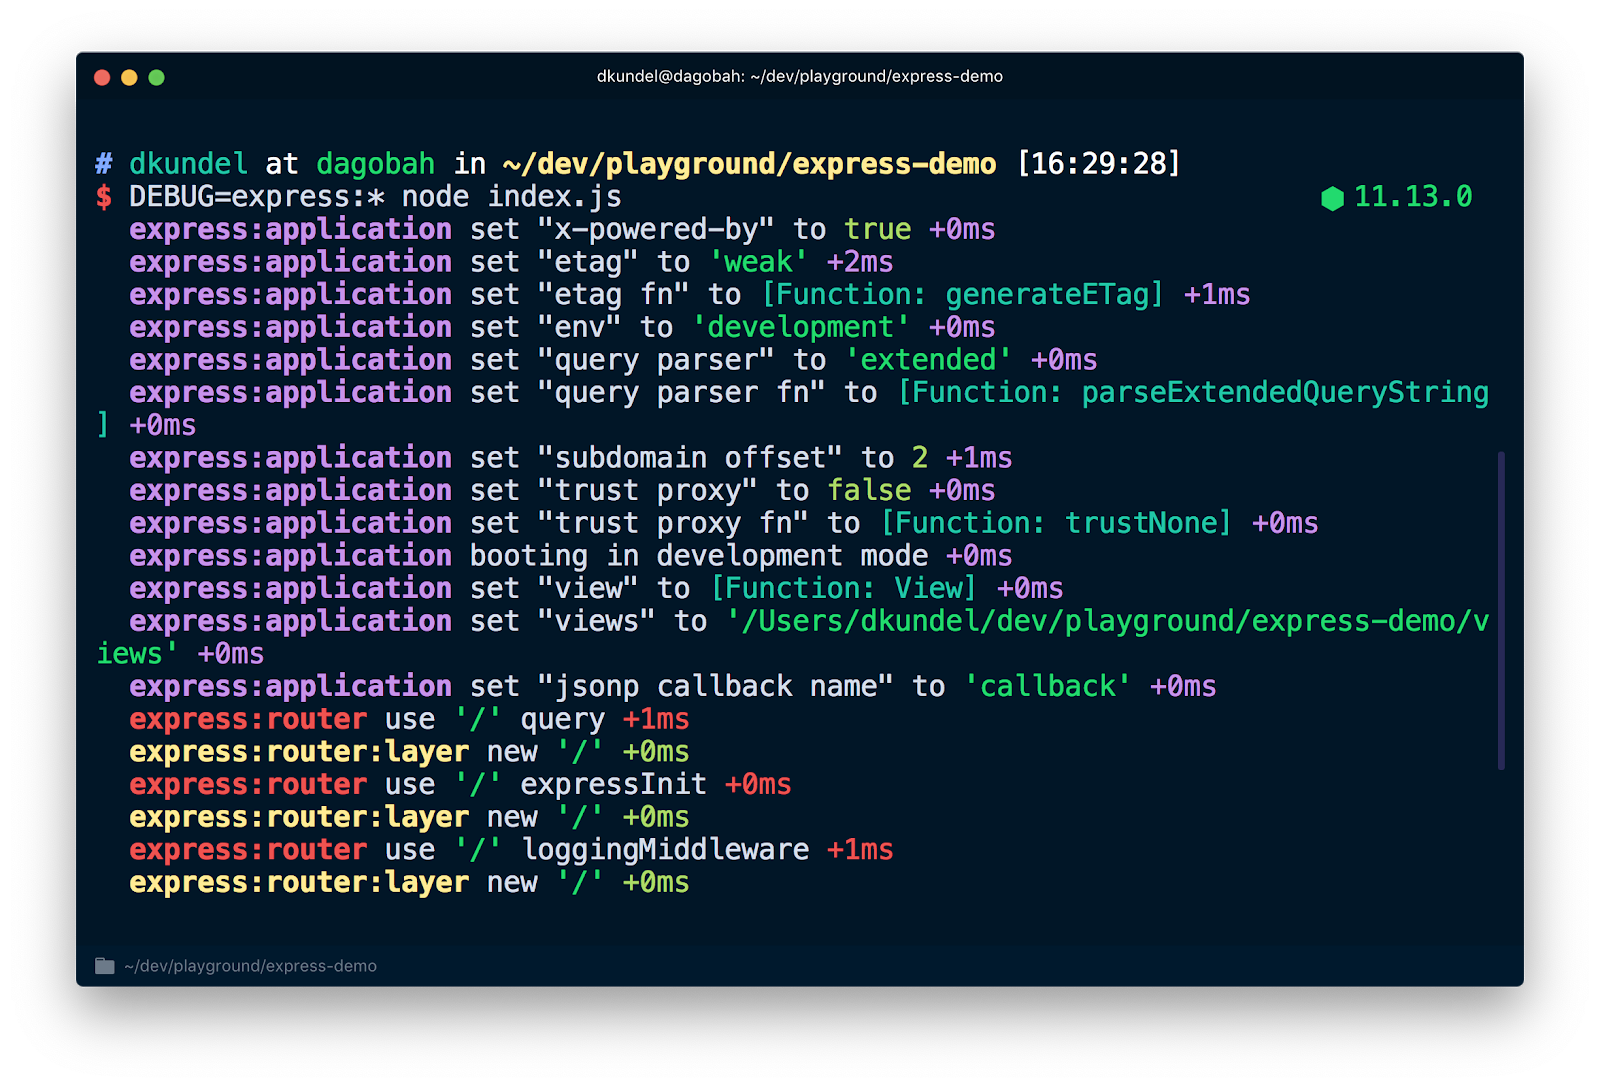
A good example for this is express. There's lots of things going on under the hood of express and you might want to take a peek under the hood when you debug your application. If we consult the express documentation you'll notice that you can prepend a DEBUG=express:* to your command like so:
If you run the command with an existing app you'll see lots of additional output that will help you debug your issue.
If you didn’t enable debug logging, you'll not see any of this. This is done through a package fittingly called debug. It allows us to write messages under a "namespace" and if the user of the library includes the namespace or a wildcard that matches it in their DEBUG environment variable, it will output these. To use the debug library, first install it:
Let's try it by creating a new file that will simulate our library called random-id.js and place the following code in it:
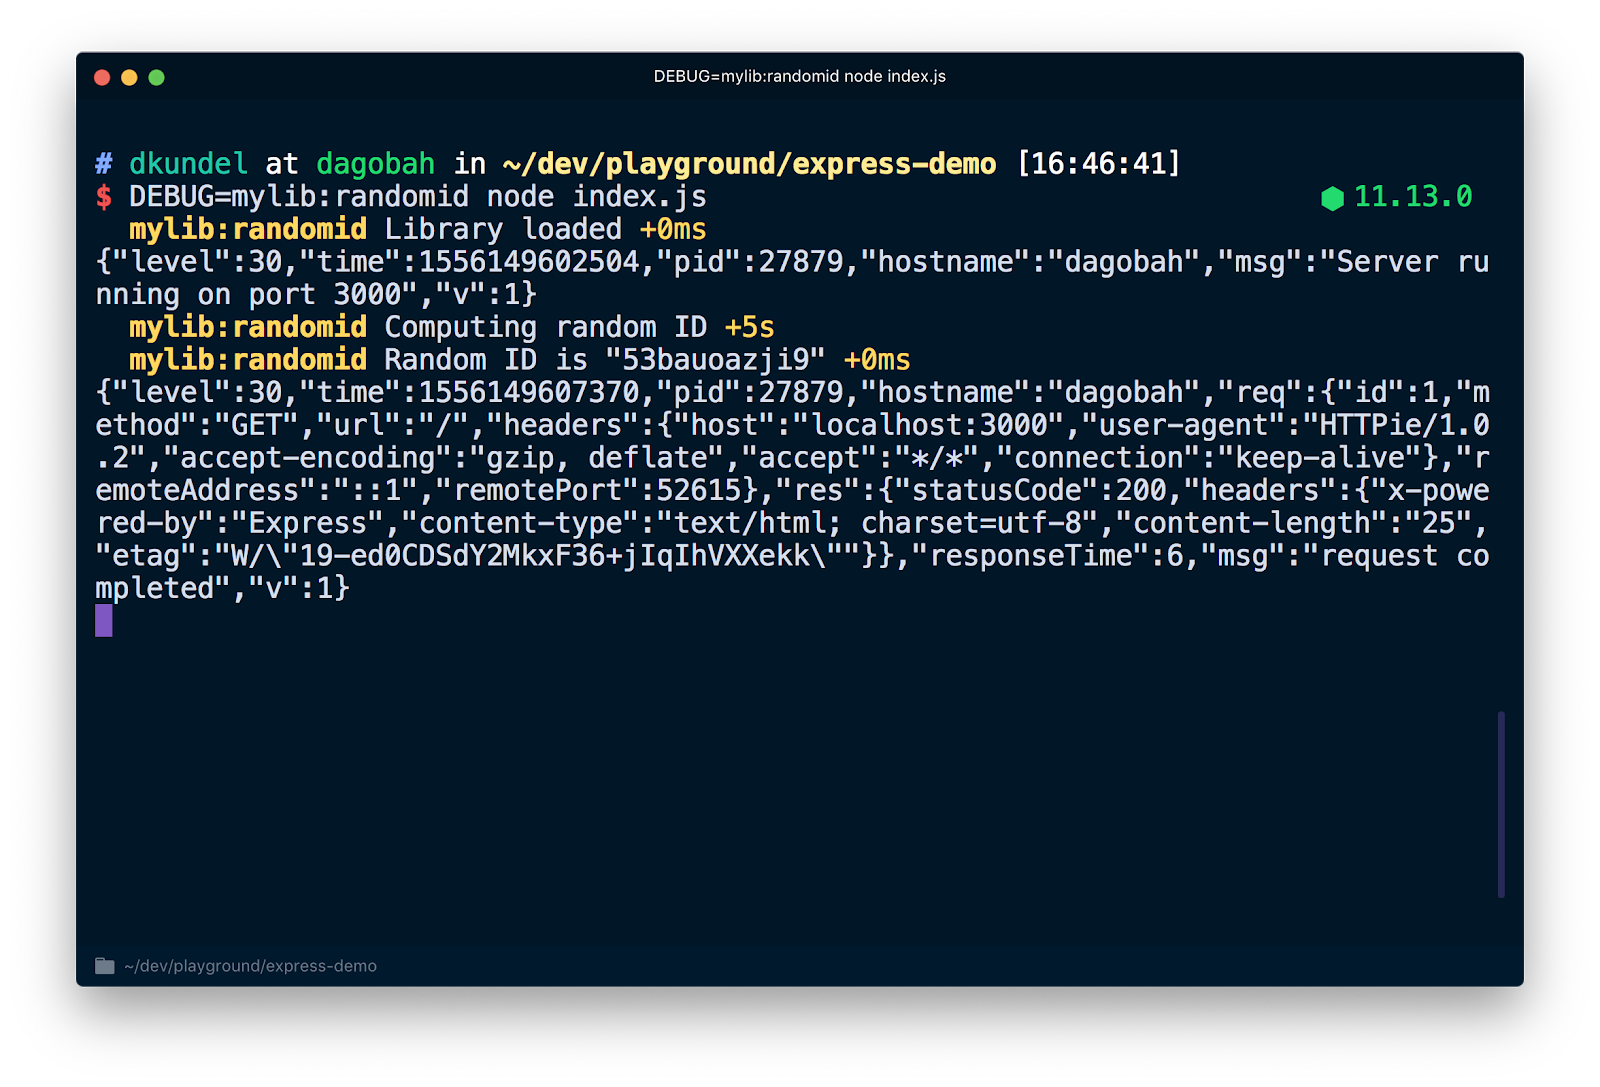
This creates a new debug logger with the namespace mylib:randomid and then logs two messages to it. Let's use it in our index.js from the previous chapter:
If you re-run the server but this time with DEBUG=mylib:randomid node index.js it prints the debug logs for our 'library".
The neat thing is that if the users of your library want to place this debug info into their pino logs, they can use a library called pino-debug by the pino team to properly format those logs.
Install the library using:
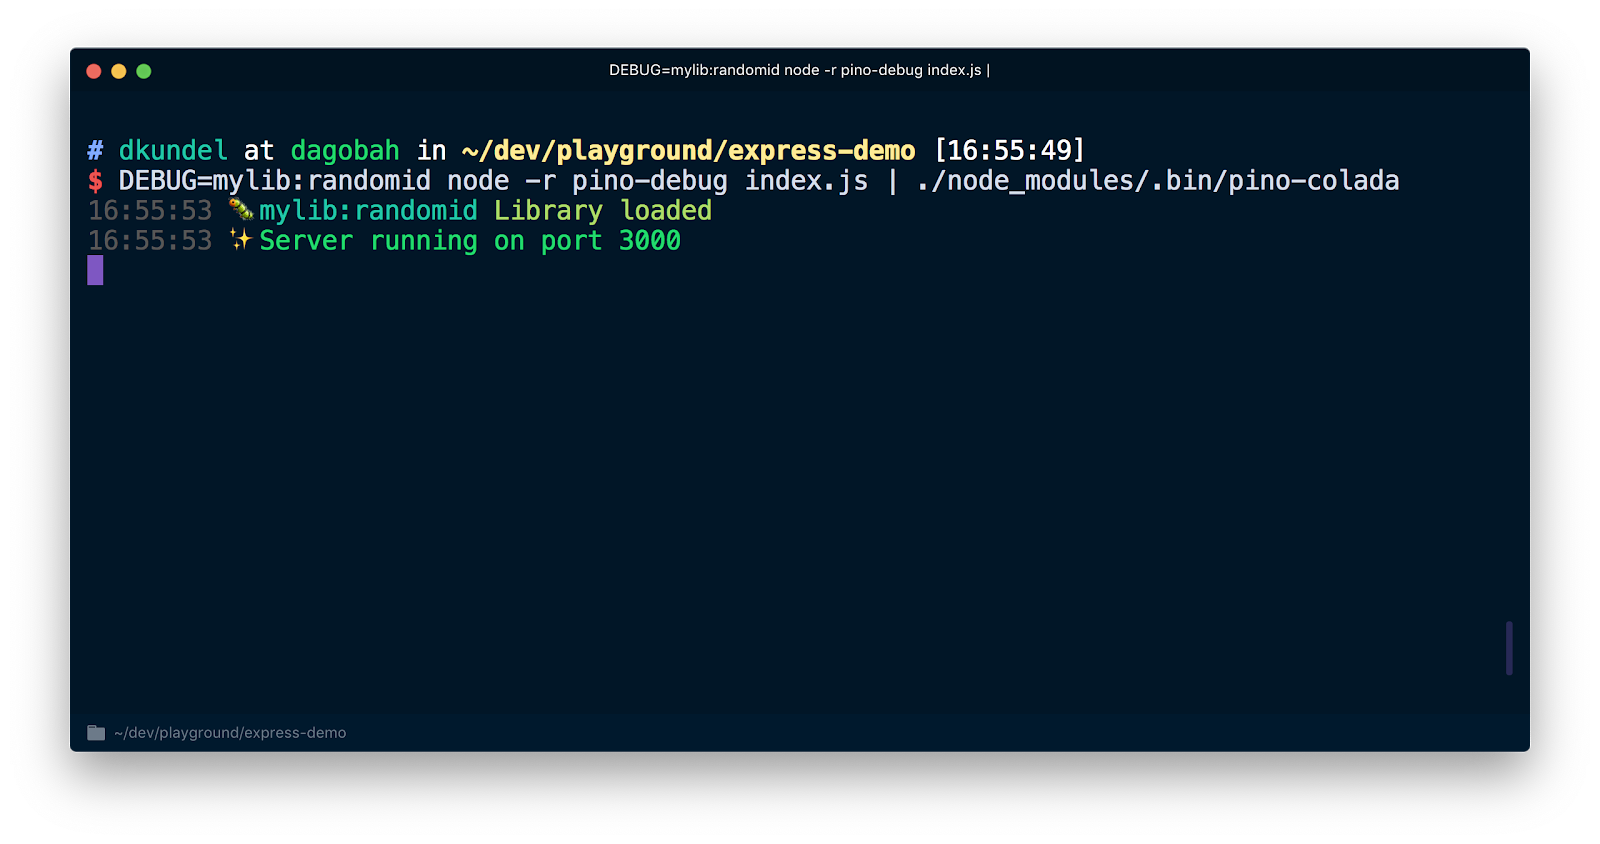
pino-debug needs to be initialized before our first use of debug. The easiest way to do this is to use the -r or --require flag of Node.js to require the module before starting our script. Re-run your server with a command like the following (assuming you installed pino-colada) :
You'll now see your debug logs of the library in the same format as your application logs.
Your CLI Output
The last case we'll cover in this blog post is the special case of logging for CLIs rather than libraries. My philosophy here is to keep the logic-logs separate from your CLI output "logs". For any logic logs, you should use a library like debug. That way you or others can re-use the logic without being bound by the specific use-case of your CLI.
When you build a CLI with Node.js you might want to make things look pretty by adding colors, spinners or formatting things in a particular visually-appealing way. However, when you build your CLI, there are a few scenarios you should keep in mind.
One scenario is that your CLI might be used in the context of a Continuous Integration (CI) system and therefore you might want to drop the colors or any fancy decorative output. Some CI systems set an environment flag called CI. If you want to be more on the safe side to check if you are in a CI is by using a package like is-ci that already has support for a bunch of CI systems.
Some libraries like chalk already detect CIs for you and drop the colors for you. Let's take a look at how this looks like.
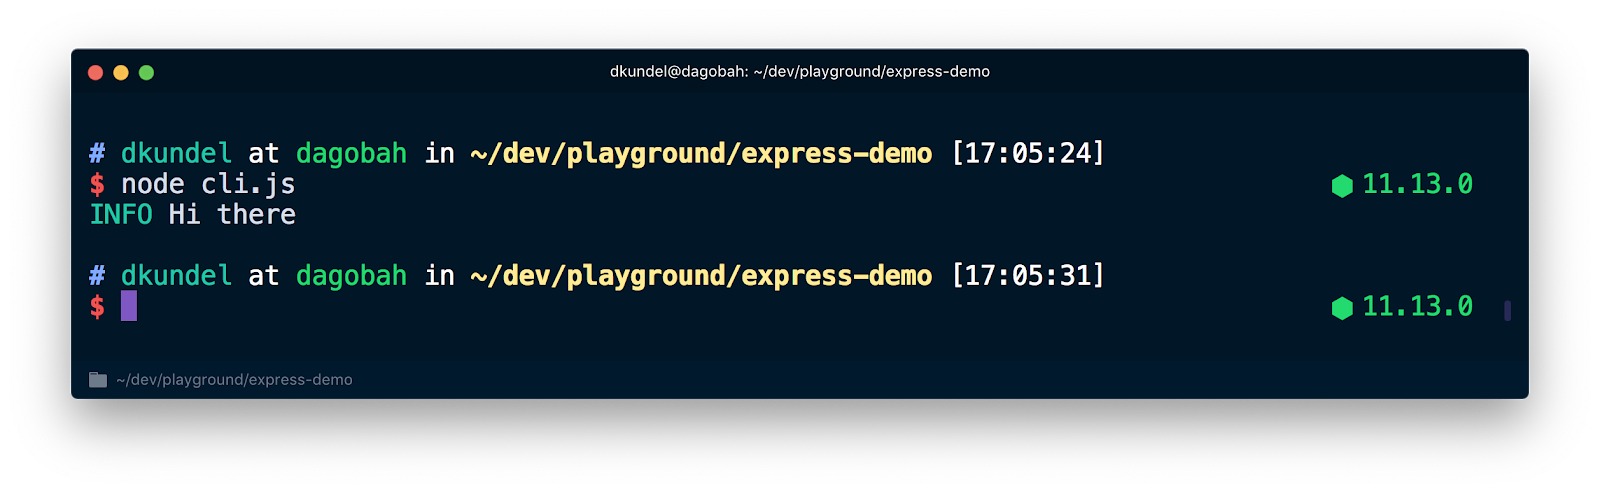
Install chalk using npm install chalk and create a file called cli.js. Place the following into it:
Now if you would run this script using node cli.js you'll see colored output.
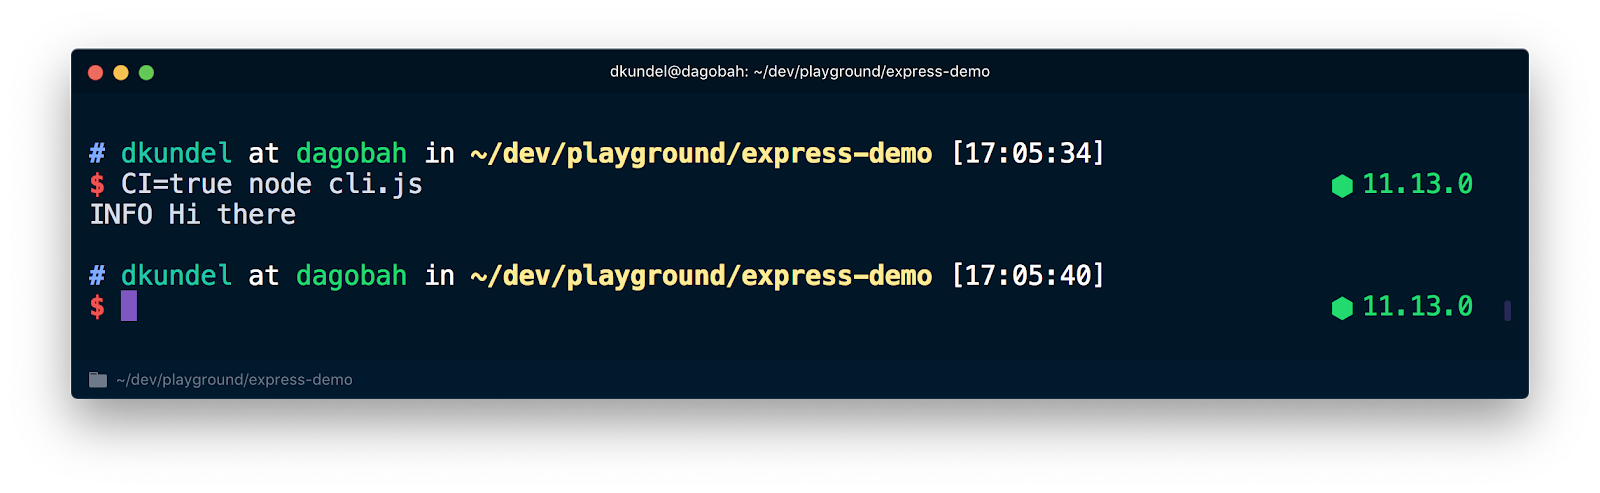
But if you run it with CI=true node cli.js you'll see that the color is suppressed:
The other scenario you want to keep in mind is if your stdout is running in a terminal mode. Meaning the content written to a terminal. If that's the case we can show all the pretty output using things like boxen. If it's not, it's likely that the output is being redirected into a file or piped somewhere.
You can check ifstdin, stdout or stderr are in terminal mode by checking the isTTY attribute on the respective stream. For example: process.stdout.isTTY. TTY stands for "teletypewriter" and in this case specifically for Terminal.
The values can differ for each of the three streams depending on how the Node.js process has been started. You can read more about it in the "process I/O" section of the Node.js documentation.
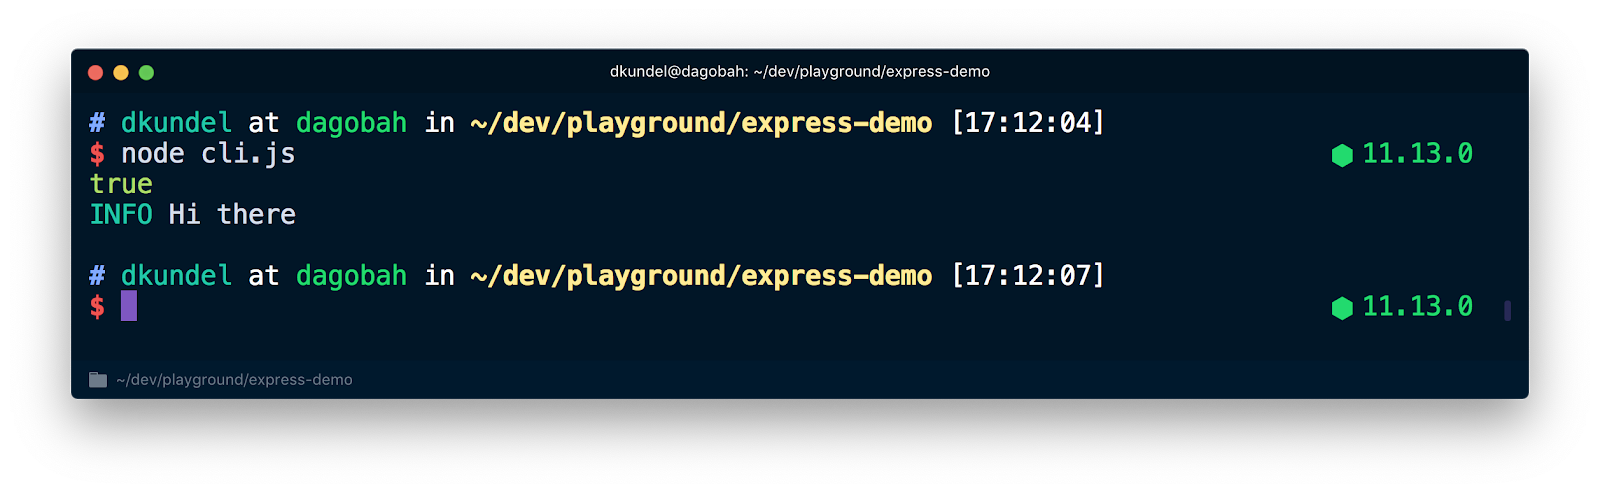
Let's see how the value of process.stdout.isTTY varies in different situations. Update your cli.js file to check for it:
Now run node cli.js in your terminal and you see true printed followed by our colored message.
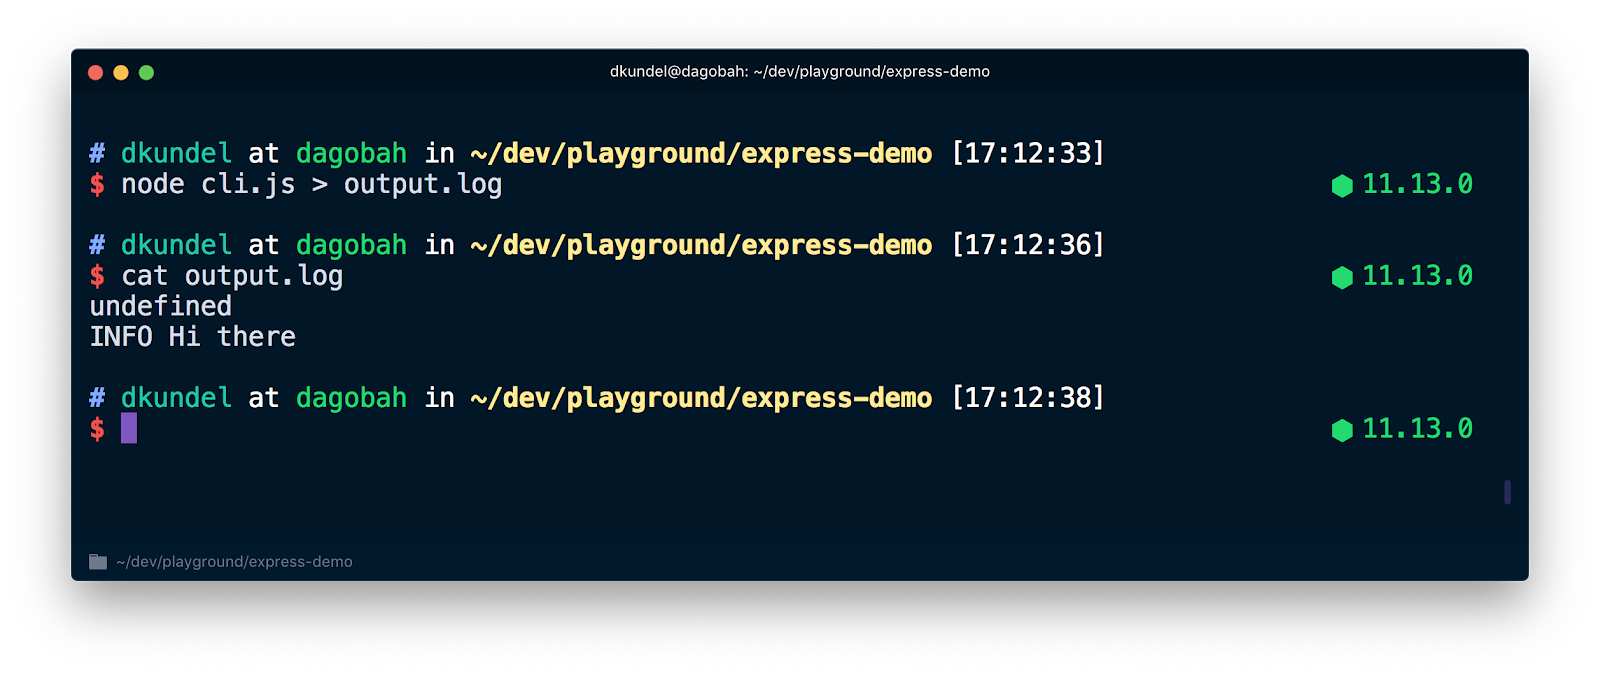
Afterwards run the same thing but redirect the output to a file and inspect the content afterwards by running:
You'll see that this time it printed undefined followed by a plain uncolored message because the redirect of the stdout turned off the terminal mode of stdout. Since chalk uses supports-color which under the hood checks among other things for isTTY on the respective stream.
Tools like
chalk take care of this behavior for you already, however, when you develop a CLI you should always be aware of situations where your CLI might run in CI mode or where the output is redirected. It can also help you take the experience of your CLI one step further. For example you can arrange your data in a pretty fashion in the terminal and if isTTY is undefined you switch to a way that is easier to parse.
In Summary
Getting started with JavaScript and logging your first line using console.log is quick, but when you take your code to production, there's much more you should consider about logging. This post is purely an introduction into the various ways and available logging solutions. It doesn't contain everything you need to know. I recommend you to check out some of your favorite open source projects to see how they solve the logging problems and which tools they use. Now go and log all the things and just don't print your logs 😉

If you know or find any tools that I should definitely mention or if you have any questions, feel free to drop me a line. I can't wait to see what you build.
- Twitter: @dkundel
- Email: dkundel@twilio.com
- GitHub: dkundel
- dkundel.com


Related Resources
Twilio Docs
From APIs to SDKs to sample apps
API reference documentation, SDKs, helper libraries, quickstarts, and tutorials for your language and platform.
Resource Center
The latest ebooks, industry reports, and webinars
Learn from customer engagement experts to improve your own communication.
Ahoy
Twilio's developer community hub
Best practices, code samples, and inspiration to build communications and digital engagement experiences.