Troubleshooting Your Twilio Video App
Time to read: 8 minutes
April 28, 2021
Written by
Reviewed by

When milliseconds matter, low-latency WebRTC is the go-to protocol for real-time communication. It is being used by billions to communicate via video, distribute live content, and even to control remote vehicles and other objects. However, it wasn’t until this year that the World Wide Web Consortium (W3C) and the Internet Engineering Task Force (IETF) announced that WebRTC is an official standard. WebRTC is still evolving.
Improvements to WebRTC continue, which will help solve problems like convergence among browsers and devices as they move towards performing similar tasks and being used to interact with some of the same kinds of content. Developers love Twilio Programmable Video because it simplifies WebRTC usage, but differences between browsers and operating systems can still be challenging.
For this reason (and many others), when you are building WebRTC applications in production, your best friends are testing and troubleshooting. This post will focus on troubleshooting. I will discuss methods and tools you can use to troubleshoot any video application, as well as some of the particularly important concepts to understand in order to properly troubleshoot a production-ready application that uses Twilio Video APIs.
In general, the first step to troubleshooting an application is identifying the problem.
So, how can you identify a problem in your Twilio Video app?
The diagram below shows a basic media publishing initialization with Twilio:
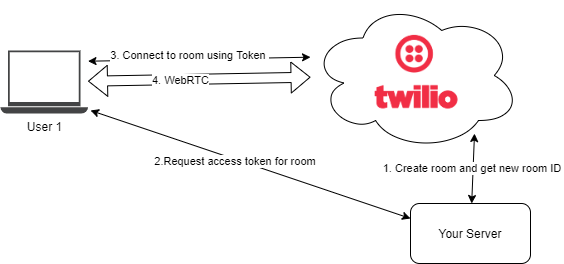
Flow diagram with main steps to initialize a Twilio media connection
Generic issues like network connectivity problems, poorly written code, or lack of load balancing can affect many kinds of applications. However, in the case of an app using Twilio Video, you have an additional service that not only returns values but also captures, processes, and distributes media between users. As such, it is not enough to know that Twilio servers are working. You also need to know that the user’s hardware is working correctly, that they are using a supported browser, and that the user’s network supports the required protocols and minimum bandwidth between the user and Twilio servers.
The first tool you can use to diagnose issues if the application is in production is the Video Log Analyzer tool provided in the Twilio Console. If you know the Room SID of the video call in question, you can get a lot of data about what happened in the call. In the image below, you can see a list of recent video rooms:
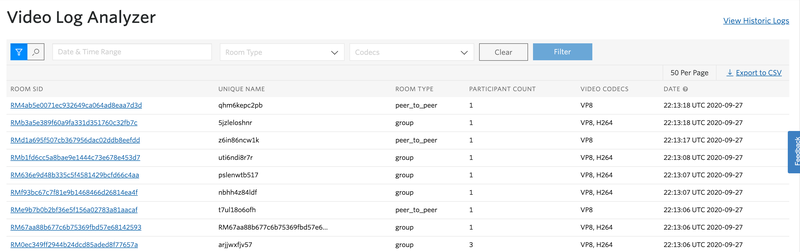
Video Log Analyzer with list of recently created rooms
Clicking on the Room SID for a select video room will take you to a page with more information, as shown in the image below:
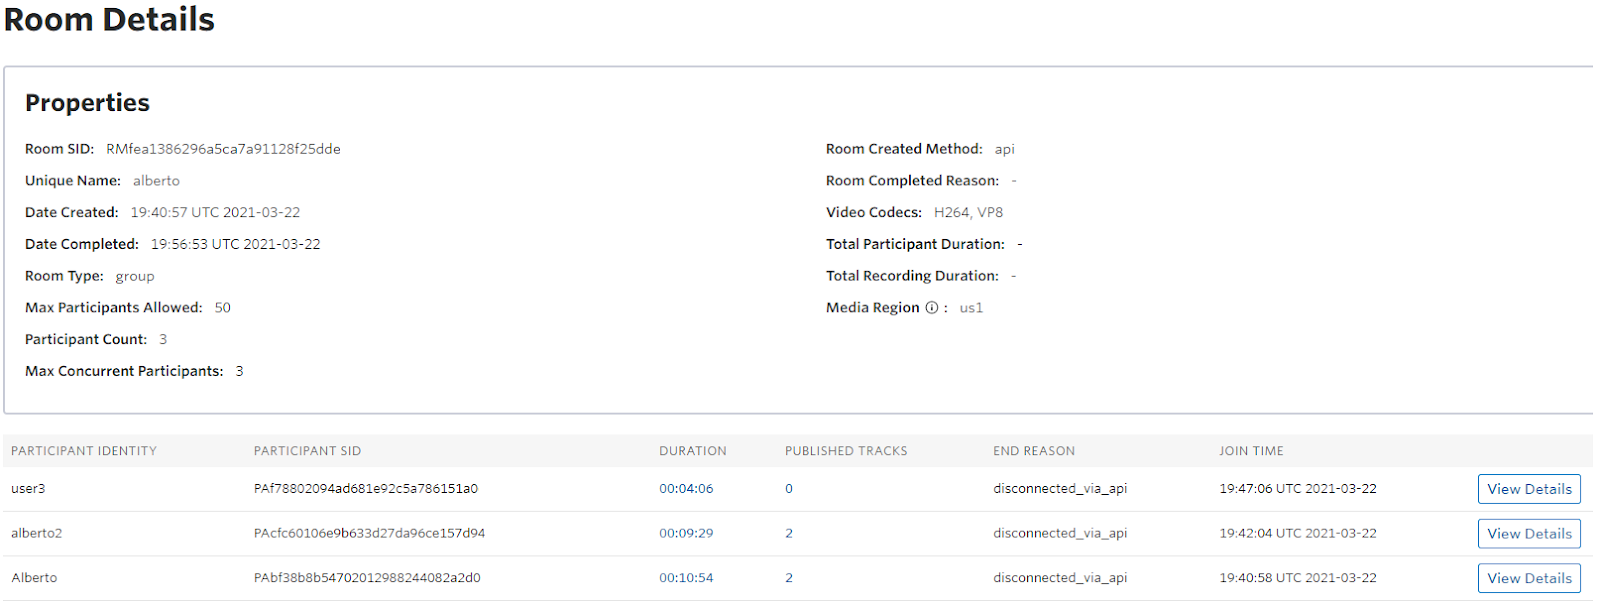
Details of a specific room in the Video Log Analyzer. You can see information about room creation, participants, published streams, why a participant’s connection ended, the used codecs, and the media region.
This is a great tool to help you find details you may want to investigate further. You may be able to discover patterns, such as that users on a certain operating system are running into the same types of error codes, or that participants in certain regions are getting disconnected more than others. Once you have some hints about what might be going on, you can start to ponder solutions.
To learn more about the Video Log Analyzer, check out the documentation here.
Additionally, you can use the RTC Diagnostics SDK to detect audio/video input issues, audio output issues, or the state of the media connection. Although this is not built into the Twilio Video SDK, it is easy to use. You just need to decide what information you want to capture and then handle the corresponding events.
For example, you could capture the maximum receiving bitrate with the following code:
Another useful troubleshooting tool for Twilio Video rooms is the Preflight API (currently in beta). This diagnostics API can be used to detect connectivity and media quality issues prior to joining a video room or as part of a troubleshooting page. It first checks the websocket connection to the Twilio Cloud and then the media path. The API auto-publishes media and subscribes to itself in a loop, then produces a report at the end of the test. Some of that information will include jitter, packet loss, network quality, and round trip time (RTT). To learn how to use the Preflight API, take a look at the following example:
In this part above, you create a testing room with one publisher and one subscriber. And then in the code below, you call the testPreflight() method. From there, you can listen for the completed event and pass along the report object.
Moreover, if a problem is reproducible locally and you are using the Chrome browser, you can type chrome://webrtc-internals in the search bar, and that will give you information about the stages of each call, codecs, bitrate, and other useful WebRTC information about your ongoing call. If you are using Firefox, you can get the equivalent information by navigating to about:webrtc.
Data collection tools for troubleshooting
While you can visualize some information with the Twilio Video Log Analyzer or just display the information in the console, you might not have access to the logs of another user. Or you might need more information to help you troubleshoot and monitor issues. For this, you will need to capture information and store it somewhere.
With twilio-video.js v2.10.0 or above, you can intercept logs using the loglevel module. This allows for real-time processing of the logs which can include, but is not limited to, inspecting the log data and sending it to your own server. For example, you can listen for signaling events by intercepting the logger's messages as shown in the example below:
As you can see in the code above, you are filtering for the event messages that come from the signaling group (data.group === 'signaling'). After that, you then need to set the log level to info (or debug) in order to intercept signaling events:
Another great tool you can use for data collection is the Network Quality API. This is an API that monitors the video room participant’s network connection and uses an algorithm to rate the quality of that connection on a scale from 0 (network broken) to 5 (very good network).
As an example, with the Network Quality API, you could track call quality by defining a network quality verbosity and handling the networkQualityLevelChanged event. This is shown in the code below, where printNetworkQualityStats would be a function that posts these statistics periodically or on demand to a logging system:
Data visualization and storage
All of the debugging tools and APIs mentioned so far should be combined with an events logging and visualization system. While the data can be directly posted to a JSON or text file, you could also configure a debugging events webhook or send the logs to an ELK stack system (open source) or other third-party service.
Whichever service you end up choosing, consider what kinds of information you would like to log and store to best help you with troubleshooting your Twilio Video application.
The first things to store would be the errors or warnings thrown by Twilio. Typically, these might include issues arising when a participant initially connects to or starts the call, or when a new participant is joining. Additionally, any relevant data coming from the RTC Diagnostics SDK, Video SDK Preflight API, and/or the Network Quality API will help you monitor the Participants’ experience and store those quality metrics to review later.
You also may want to log and store the user’s browser, browser version, operating system, or location. This information, if associated with specific Twilio errors, warnings, or other quality metrics, will help you track and replicate bugs.
Twilio’s networking and bandwidth requirements
Since you are exchanging media in real time in a video application, you depend on the network to a greater extent than you might in other kinds of apps. In Figure 1 below, you can see an official table of bandwidth requirements from Twilio for audio and video.
|
Bandwidth (Uplink/Downlink) |
32-100kbps (audio only) > 150kbps (video only) |
|
Latency (RTT) |
< 200ms |
|
Jitter |
< 30ms |
|
Packet Loss |
< 3% |
Figure 1. Table of bandwidth requirements from Twilio
The user should be notified if the bandwidth is below these requirements. For example, you could show a modal at the top of the page warning the user that their camera has been turned off due to low bandwidth, or you could even offer them the option to dial in via phone.
Figure 2 below shows the minimal user requirements for a successful video call.
|
Video Room Type |
Minimal Available Bandwidth required (on the client side) |
|
9 participants video room with Lo-res VP8 Video (240x180) + HD Audio |
~2 Mbps |
|
9 participants video room with SD VP8 Video (640x480) + HD Audio |
~4 Mbps |
|
9 participants video room with HD VP8 Video (1280x720) + HD Audio |
~6 Mbps |
Figure 2. Bandwidth video requirements estimate assuming a user is receiving all the participants’ audio and video (except their own) at 30fps.The bandwidth requirement will vary depending on the codec, resolution, and frame rate.
Thanks to WebRTC, the video call will adapt to network conditions, so you just need to make sure you reach the lo-res minimum video quality. If the user is unable to meet the minimum requirements for video, they will need to switch to audio only mode.
Also, WebRTC uses ports and protocols beyond the standard TCP communication on ports 80 and 443 that are common for HTTP requests. For that reason, it is recommended to review your network infrastructure to ensure that your servers can send outgoing TCP and UDP traffic to the public internet and receive incoming requests from clients. Your application will need to initiate requests to and receive traffic from Twilio’s media and signalling servers.
Learn more about troubleshooting your Twilio Video app
Now that you have all of these great troubleshooting tools in your toolbelt, you are ready to start using them in your own video application.
In summary, here is a minimal troubleshooting checklist:
- Test your connectivity and identify other issues using the diagnostic tools discussed above.
- Collect and store logs for monitoring and future reference.
- Ensure you meet the bandwidth requirements.
- Allow connection between your application and Twilio's media and signalling servers.
- Check the Twilio Video recommendations and best practices for giving the best experience to your users.
Twilio Programmable Video keeps improving its technology and providing developers with new ways to analyze and troubleshoot their calls. If you would like to learn even more about troubleshooting, check out the Video Log Analyser REST API. If you are curious about debugging in general, take a look at these general recommendations for debugging a Twilio application. Or, to learn even more about best practices with Programmable Video, you can review the Twilio Programmable Video documentation here.
Alberto Gonzalez Trastoy is a Senior Engineer at WebRTC.ventures. His telecom engineering background and interest in tech have led him to build many VoIP and WebRTC based projects for small and large enterprises—projects including telepresence remote control, live broadcasting games, video call centers, speech analytics, and many other real-time applications.
He can be reached on Twitter at @lbertogon.
Related Resources
Twilio Docs
From APIs to SDKs to sample apps
API reference documentation, SDKs, helper libraries, quickstarts, and tutorials for your language and platform.
Resource Center
The latest ebooks, industry reports, and webinars
Learn from customer engagement experts to improve your own communication.
Ahoy
Twilio's developer community hub
Best practices, code samples, and inspiration to build communications and digital engagement experiences.