Real-time Visibility Into Application Errors with the Debugger Webhook
Time to read:
February 23, 2017
Written by
This post is part of Twilio’s archive and may contain outdated information. We’re always building something new, so be sure to check out our latest posts for the most up-to-date insights.

Today we’re happy to announce the Beta of a new Debugger Webhook. The webhook enables customers to receive an HTTP request from Twilio every time an application errors occurs. Customers can use this data in several interesting ways, including publishing it to industry standard monitoring services like New Relic or Rollbar.
This past May at Signal we launched a brand-new Console Debugger for Twilio developers that helped them more quickly diagnose and resolve issues with their Twilio applications. The Debugger was integrated throughout the Console and provided customers with a high-level overview of error rates, as well as the ability to drill down into an individual error or category of errors. The feedback from customers has been very positive and Twilio has seen aggregate error rates decline significantly as customers are better able to troubleshoot their apps.
However, we have heard from developers that they also want a programmatic way to get notified when errors take place in their Twilio-based apps. The method of doing this today involves continually polling the REST API which isn’t timely and it takes up more resources than necessary. Developers wanted a way for debugging events to get pushed to their software as they happened.
Getting Started with the Debugger Webhook
Configuring the webhook is easy, just go the Debugger and click on Settings.
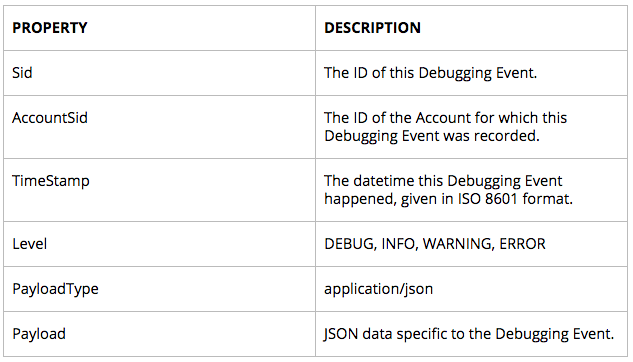
When a debugging event occurs on your Twilio account, an HTTP POST will be made to the webhook URL that you configured and the following parameters will be passed:
To illustrate how easy it is to pipe this error information into a monitoring system, let’s write some Node.js code to send debugging events to Rollbar. You can use any web framework you like, we’ll use Express in our example. Here’s the code you’d add to the route you’ve created to handle these HTTP requests:
We can then deploy this new code and configure the Debugger Webhook to point at the new endpoint. The next step would be to intentionally trigger an error on your Twilio account. An easy way to do this is to create an invalid TwiML Bin and wire it up to a phone number.
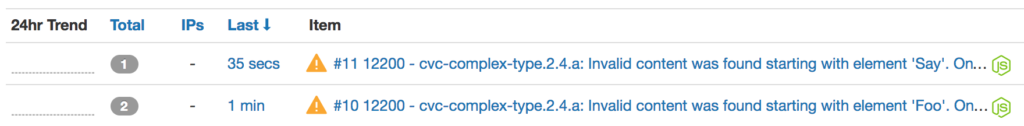
As you can see, the information about the error including the log level and error code has been published to Rollbar. From here, it’s easy to use Rollbar to create a rich set of rules that govern notifications, including setting error and error rate thresholds, and firing pager alerts when appropriate.
If you have any any questions about the Debugger Webhook don’t hesitate to reach out to me at @crtr0 on Twitter or carter@twilio.com.
Related Posts
Related Resources
Twilio Docs
From APIs to SDKs to sample apps
API reference documentation, SDKs, helper libraries, quickstarts, and tutorials for your language and platform.
Resource Center
The latest ebooks, industry reports, and webinars
Learn from customer engagement experts to improve your own communication.
Ahoy
Twilio's developer community hub
Best practices, code samples, and inspiration to build communications and digital engagement experiences.