Introducing Voice Insights Connectivity Dashboards
Time to read:
December 05, 2017
Written by
This post is part of Twilio’s archive and may contain outdated information. We’re always building something new, so be sure to check out our latest posts for the most up-to-date insights.

- Track trends in metrics like call completion rate, who-hung-up, and time-to-connect.
- Analyze data by phone numbers, carrier names, area codes, and country codes.
- Zoom into calls with specific SIP errors and connection states within seconds.
In May, we extended Voice Insights to support carrier calls, giving you access to quality metrics on your Twilio powered carrier calls. Insights makes it easy for you to know which carriers your users are connecting over, which participant hung up the call, and how long it takes for your calls to connect. This data was useful on a per-call basis, but analyzing metrics for all calls from specific phone numbers, area codes, countries, and carriers could be a tedious process taking days of manual effort.
Today, we are excited to launch all-new Voice Insights connectivity dashboards that enable account-level analytics on connectivity metrics. These new dashboards aggregate data on call completion rates, show trends on call hangups and isolate calls that took a long time to connect with your users. In one place, you have a clear view of the experience your customers are getting, and where you might look to make it better. These dashboards eliminate the time-consuming effort of laborious logging and manual analysis by providing simple dashboards that give you deep analytics in seconds.
This level of insight is unique to Twilio – there is currently no better way for you to quickly and accurately measure call connectivity, and rapidly identify connectivity issues and pinpoint their source. With Voice Insights connectivity dashboards, you can drill down to the problematic calls within seconds and find users with specific carriers, phone numbers, area codes, or countries that are affected.

Voice Insights Connectivity Analytics
The user experience of voice communication is measured by two key components – call connectivity and audio quality. Connectivity issues can originate from the user’s handset, the last mile link between their phones and the cell tower, their carrier network, or from within Twilio’s network. These issues are exacerbated by international calls as coverage offered from carrier networks worldwide isn’t uniform.
Congestion, spotty coverage, handoff failures, and numerous other issues could prevent you from reaching your users, or cause connected calls to drop. Identifying when these problems occur and uncovering their root cause is difficult and time-consuming.
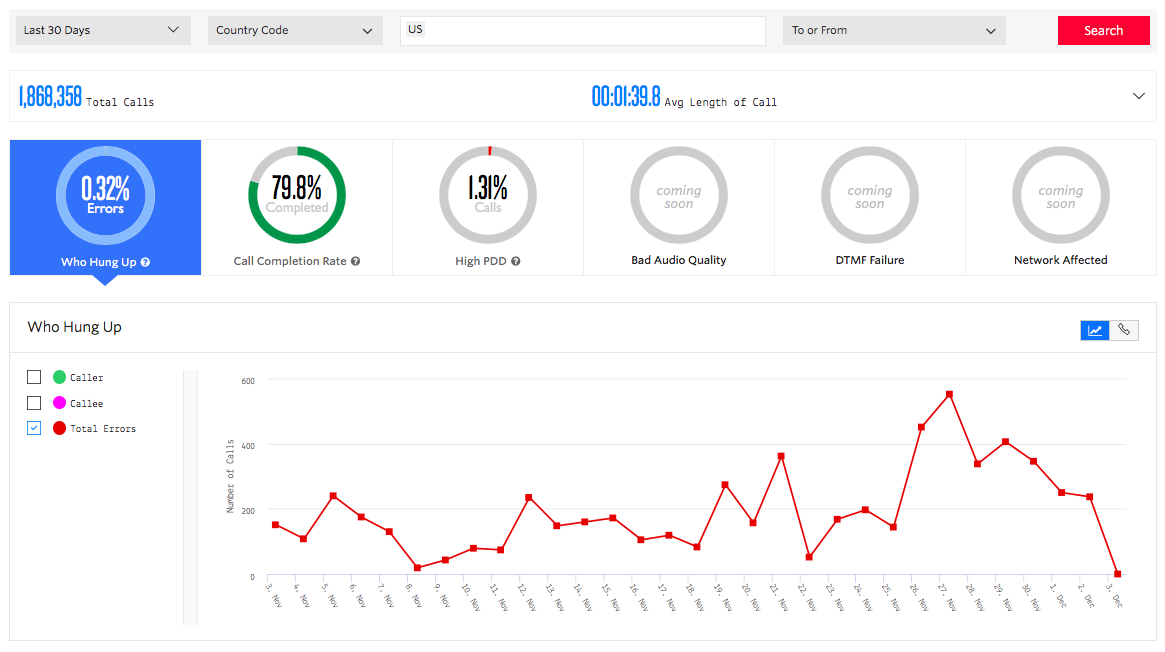
Voice Insights Connectivity dashboards enable you to rapidly identify connectivity problems by giving you real-time visibility into three key metrics:
- Call completion rate: The percent of total calls that were answered.
- Post Dial Delay: Post Dial Delay (PDD), experienced by the originating customer, is the time from sending the final dialed digit to the point at which they hear the ringtone.
- Who Hung Up: Breakdown of calls in which the SIP BYE message was received from the caller or callee. The BYE message signals the termination of the call.
The dashboards have built-in analytics for these metrics that enable you to rapidly uncover connectivity issues affecting your users. On a single dashboard, you can monitor trends, track the overall health of your Twilio calls, and drill down into specific calls with problems.
Analyze metrics by countries, area codes, and phone numbers
Voice Insights aggregates the connectivity metrics for all carrier calls on your account within the last 30 days. You can analyze the data by phone numbers, area codes (US only), countries, and device types. You’ll be able to identify any changes in trends over the selected time range for total calls, average-length-of-call (ALOC), call disconnect patterns, connect-time, and call completion rate,
Drill down into calls with connectivity issues
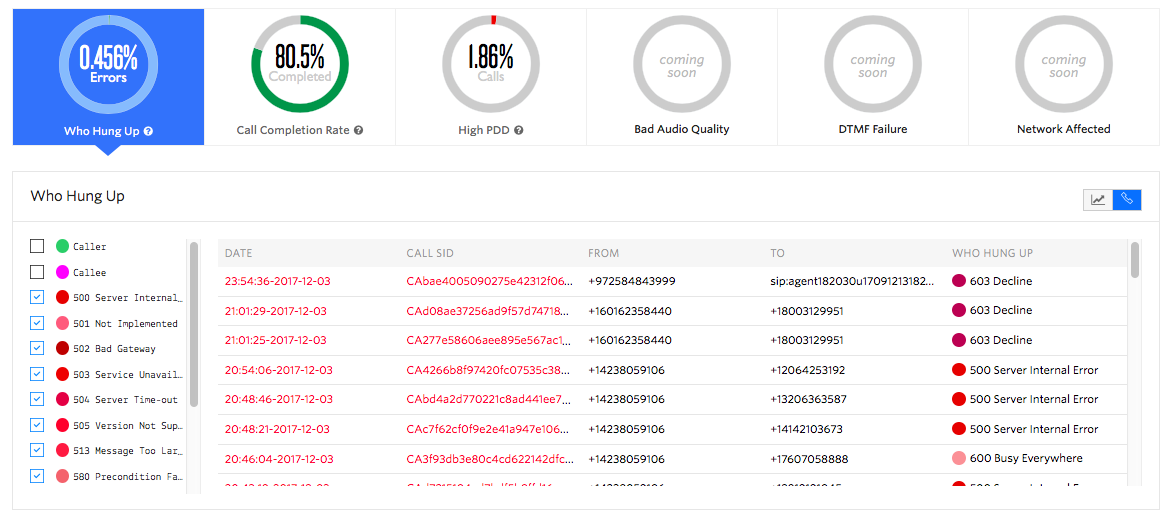
Once you identify any anomalies in the trends, you’ll need to know the exact set of calls that failed for a certain phone number, or for users in an area code. You can easily do this with the related calls tab. Going even deeper, the related call logs let you quickly drill down into the calls that failed for a given phone number, had a high connect time, or were disconnected due to specific error codes from the carriers.
Track trends on call volume, average call duration and Carriers’ SIP responses
Average Length of Call (ALOC) is a proxy metric that carriers use to measure the quality of their infrastructure. Variability in this metric over time for your use case will correlate with the quality of your users’ experience. If a call fails to connect or disconnects with an error, SIP response codes help you understand what went wrong. Voice Insights dashboards enable you to slice and dice these metrics to observe granular trends on error rates, rapidly uncovering deteriorating user experience.
Analytics on calls affected by network and audio quality metrics (coming soon)
The second key component in the user experience of voice communication will be obtained by measuring audio fidelity, which is affected by network and device conditions. Today, Voice Insights provides the real-time network metrics impacting audio quality for browser-based calls. In the future, we will expand our Insights offering to include network and audio quality analytics for SIP and PSTN calls. As we continue to build Voice Insights capabilities, we will extend the dashboards to include metrics on audio fidelity accounting for anomalies such as one-way audio, echo, and background noise.
Getting Started With Voice Insights
Voice Insights enable you to leverage real-time data analytics for managing call quality to improve communication experience of your users. You can switch on Voice Insights for both Twilio Client and Carrier Calls using the Insights settings in Twilio Console. Voice Insights for Carrier Calls starts at $0.0025/min, and volume discounts are available. Below are some resources to help you get started:
We can’t wait to see what you build.
Related Posts
Related Resources
Twilio Docs
From APIs to SDKs to sample apps
API reference documentation, SDKs, helper libraries, quickstarts, and tutorials for your language and platform.
Resource Center
The latest ebooks, industry reports, and webinars
Learn from customer engagement experts to improve your own communication.
Ahoy
Twilio's developer community hub
Best practices, code samples, and inspiration to build communications and digital engagement experiences.