A Simple Solution for Viewing Super SIM Connection Events During Device Testing
Time to read:
February 14, 2023
Written by

When testing an IoT device that is using Twilio Super SIM it is often desirable to see how the modem is interacting with the cellular network. The modem itself can provide a great deal of information if queried using AT Commands, or looking at URCs (Unsolicited Response Codes) generated by the modem, however it is also valuable to see what is occurring from the perspective of the Twilio Mobile Core and cellular network. Twilio Super SIM provides Connection Events on Event Streams for exactly this purpose. This article provides a step-by-step tutorial on how to set up a simple viewer to examine this event stream of connection events at low volumes.
Twilio Event Streams
Twilio introduced Event Streams across almost all of the Twilio products to provide a way for customers to subscribe to events that are generated by the various Twilio platform products. This eliminates the need for customer software to constantly poll Twilio APIs in order to obtain status information. Instead, a customer application can subscribe to events and they will be sent almost as quickly as they are generated.
Super SIM Connection Events
Twilio Super SIM Connection Events are generated by the Twilio Mobile Core in near real time as the devices containing Super SIMs interact with cellular networks, and utilize data through the Mobile Core.
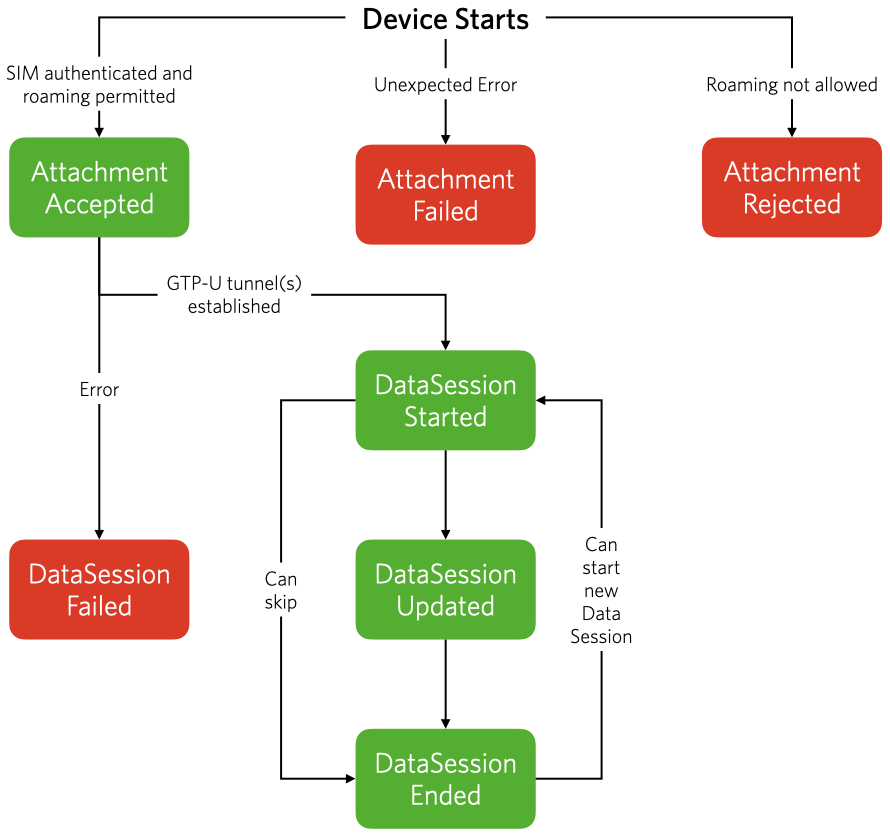
When a modem first powers on, or is reset, it will search for visible cellular networks and then, using the credentials from the Super SIM, it will begin to make attempts to register on a cellular network. If the network is one supported by Super SIM, that carrier will relay this registration request to the Twilio Mobile Core. The Mobile Core will then check the customer configuration of the Network Access Profiles (NAPs), fleet data limits, and SIM activation status, and respond accordingly, either allowing or denying access to that network. If the SIM settings allow access and the device is registered on the carrier network, the modem will then create a data session, using the Super SIM “super” APN, to the Mobile Core to begin to exchange data over the cellular network. When the modem is done exchanging data, it might then end the data session. Many of these operations are all logged and generated as Connection Events that you are able to subscribe to in your own software.
A simple solution to view connection events
If you are operating a fleet of devices, there are many reasons that you might want to gather and store all of these Connection Events. You could use this data for generating alerts or alarms, opening trouble tickets, or creating various reports. All of this would require setting up infrastructure to subscribe and capture all of the events, evaluate them, and store them into a database for later analysis. But what if you simply want to use them to monitor and debug a single device while doing development or testing?
Twilio Event Streams support sending the events to Amazon Kinesis, or to any Webhook endpoint. A Webhook is a simple HTTP POST of data to some arbitrary endpoint. With Twilio Event Streams you provide the URL of your HTTP endpoint where you want Twilio to POST the event. It is this Webhook endpoint support that can be leveraged in a very simple way to capture and view the Super SIM Connection Events.
There are several different solutions on the Internet to assist in debugging HTTP POSTed Webhooks. A couple of the popular ones are PostBin and RequestBin. There are many others, and if you operate your own servers you can create your own HTTP endpoint with logging, or even run an open source version of one of these platforms. There are many options available to you. In the case of this example we’re going to use RequestBin as it provides some powerful capabilities that we can leverage.
Getting started with RequestBin
To use RequestBin they require that you create an account, and give you a limited number of handled requests each 24 hours. If your account has many SIMs, they could be generating large numbers of events, and exceed the “free” limits before you can complete your testing. You will have to determine if the free RequestBin account will meet your needs. For my small batch of SIMs and early testing, this method works for me.
Create your RequestBin account
When you first visit RequestBin you’ll be presented with their home page:
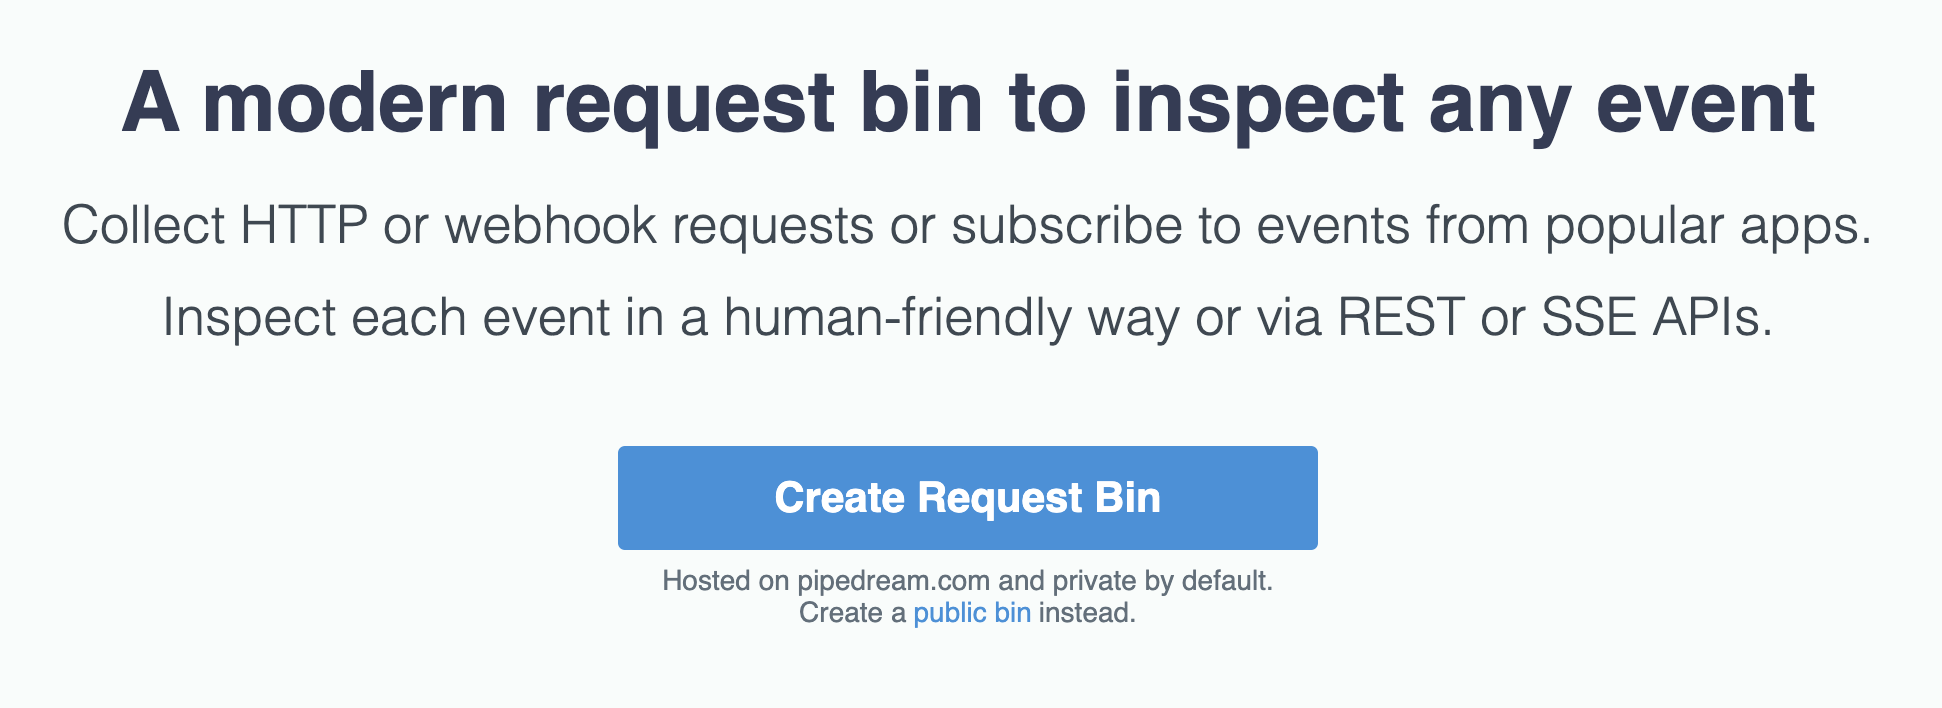
If you click the Create Request Bin button, you’ll be presented with the login page where you can create your account.
Once you are logged in, you will see a page that looks something like this:
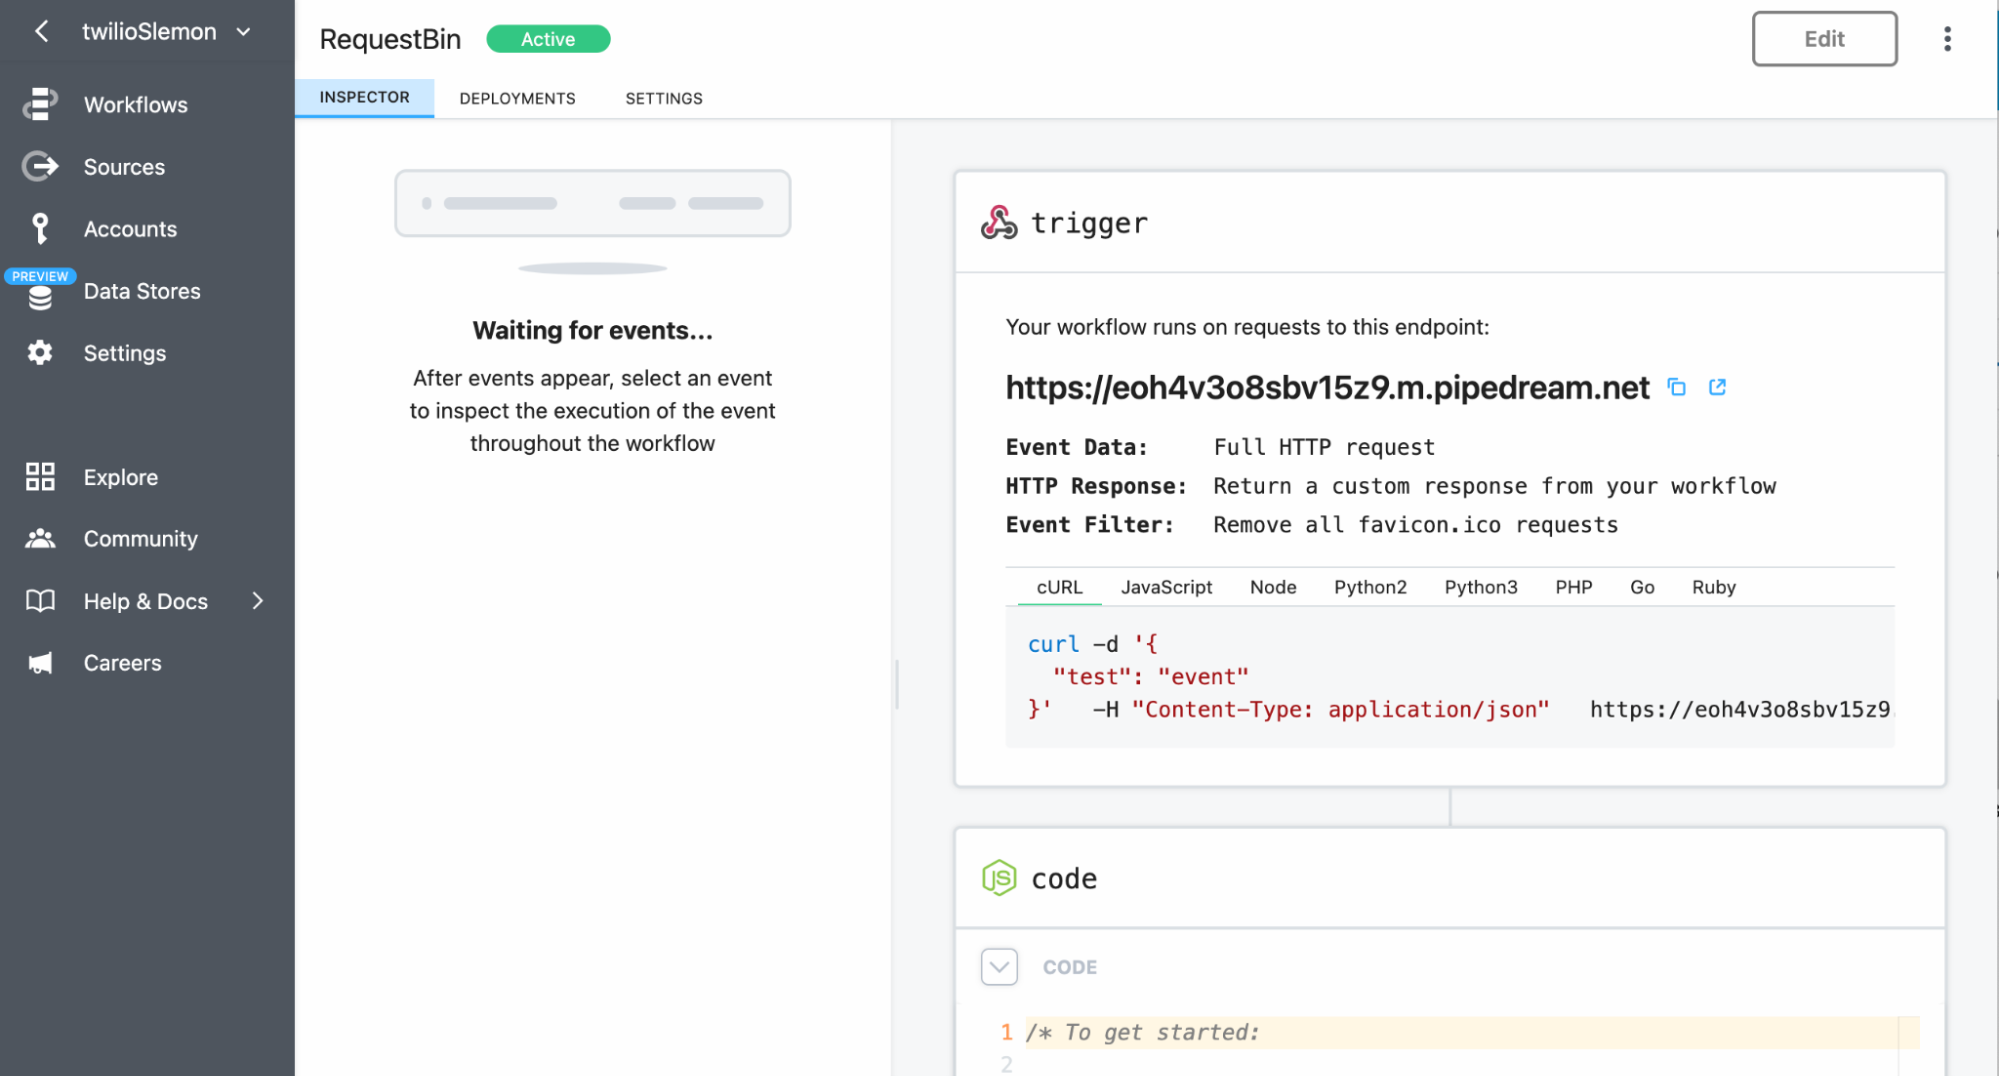
To create the custom endpoint and add some filtering capability, you’ll need to Create a New Source.
Create a new Source
On the left nav of the page, you’ll click on the Sources menu item. This will open a page listing your currently defined Sources, which should be blank at this point.
Click the New + button at the top left of the page, and you’ll be prompted to select the type of Source that you want to create. Select HTTP/Webhook. You’ll now be prompted to select the type, and select New Requests (Payload Only). You can now provide a name for this Source (for example, “Event Streams - Filtered”). Click Create Source.
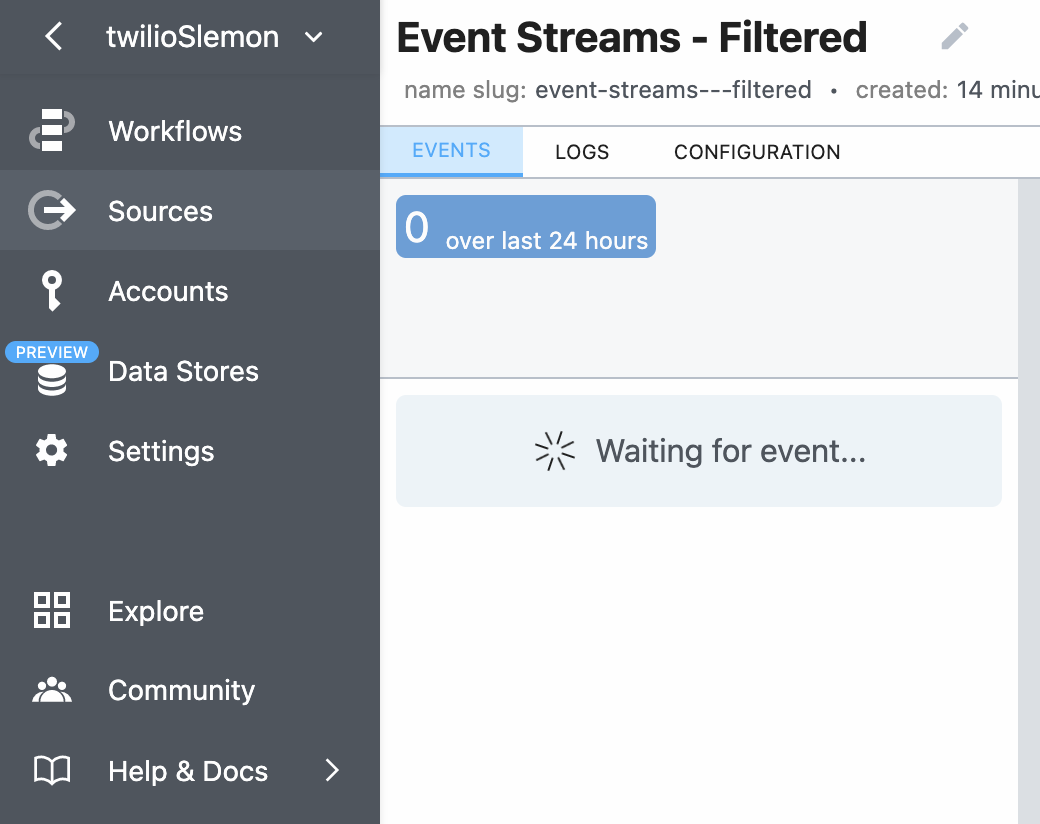
A new Source page will come up that looks like this:
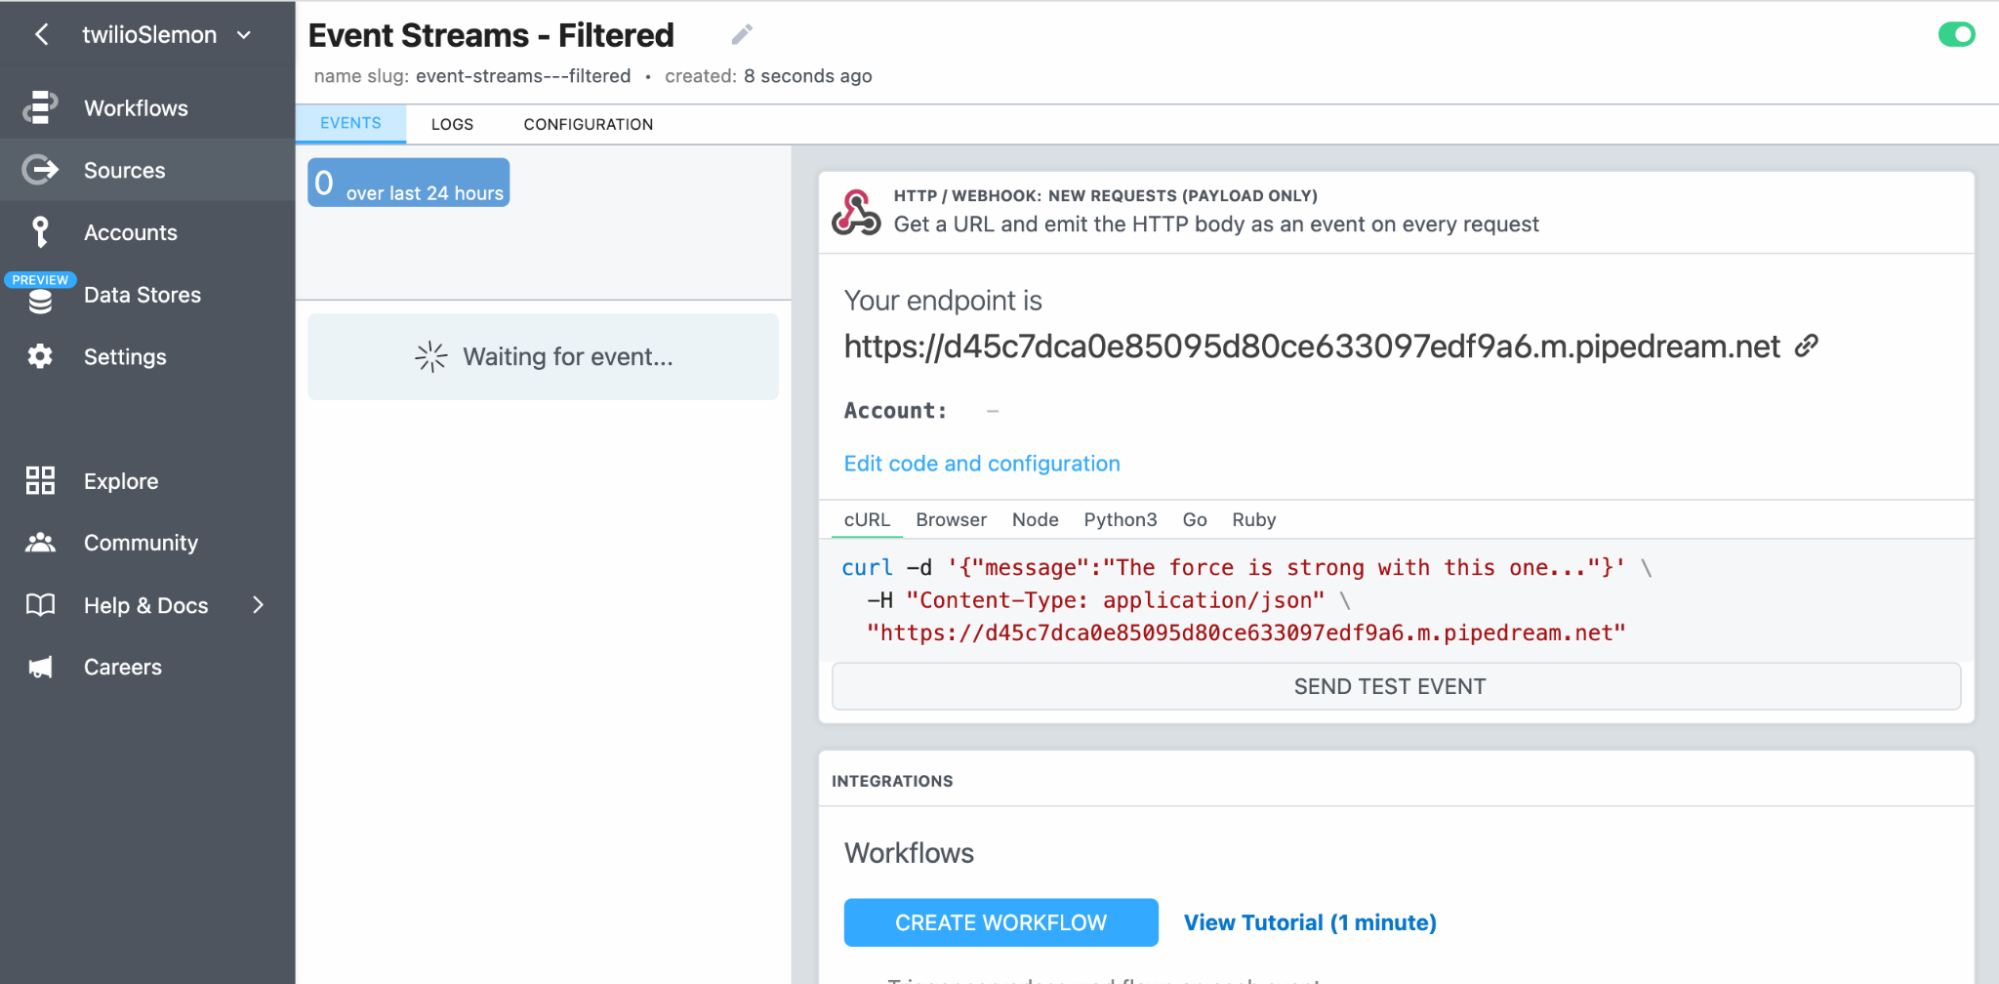
Your source is now up and running as an endpoint, and we want to take one more step to implement some filtering on the events that will be arriving.
Edit the configuration of the Source
A Source can be “configured” by editing the code that runs on this Source. If you click the Configuration tab near the top of the page, you will see the default code that was created for you.
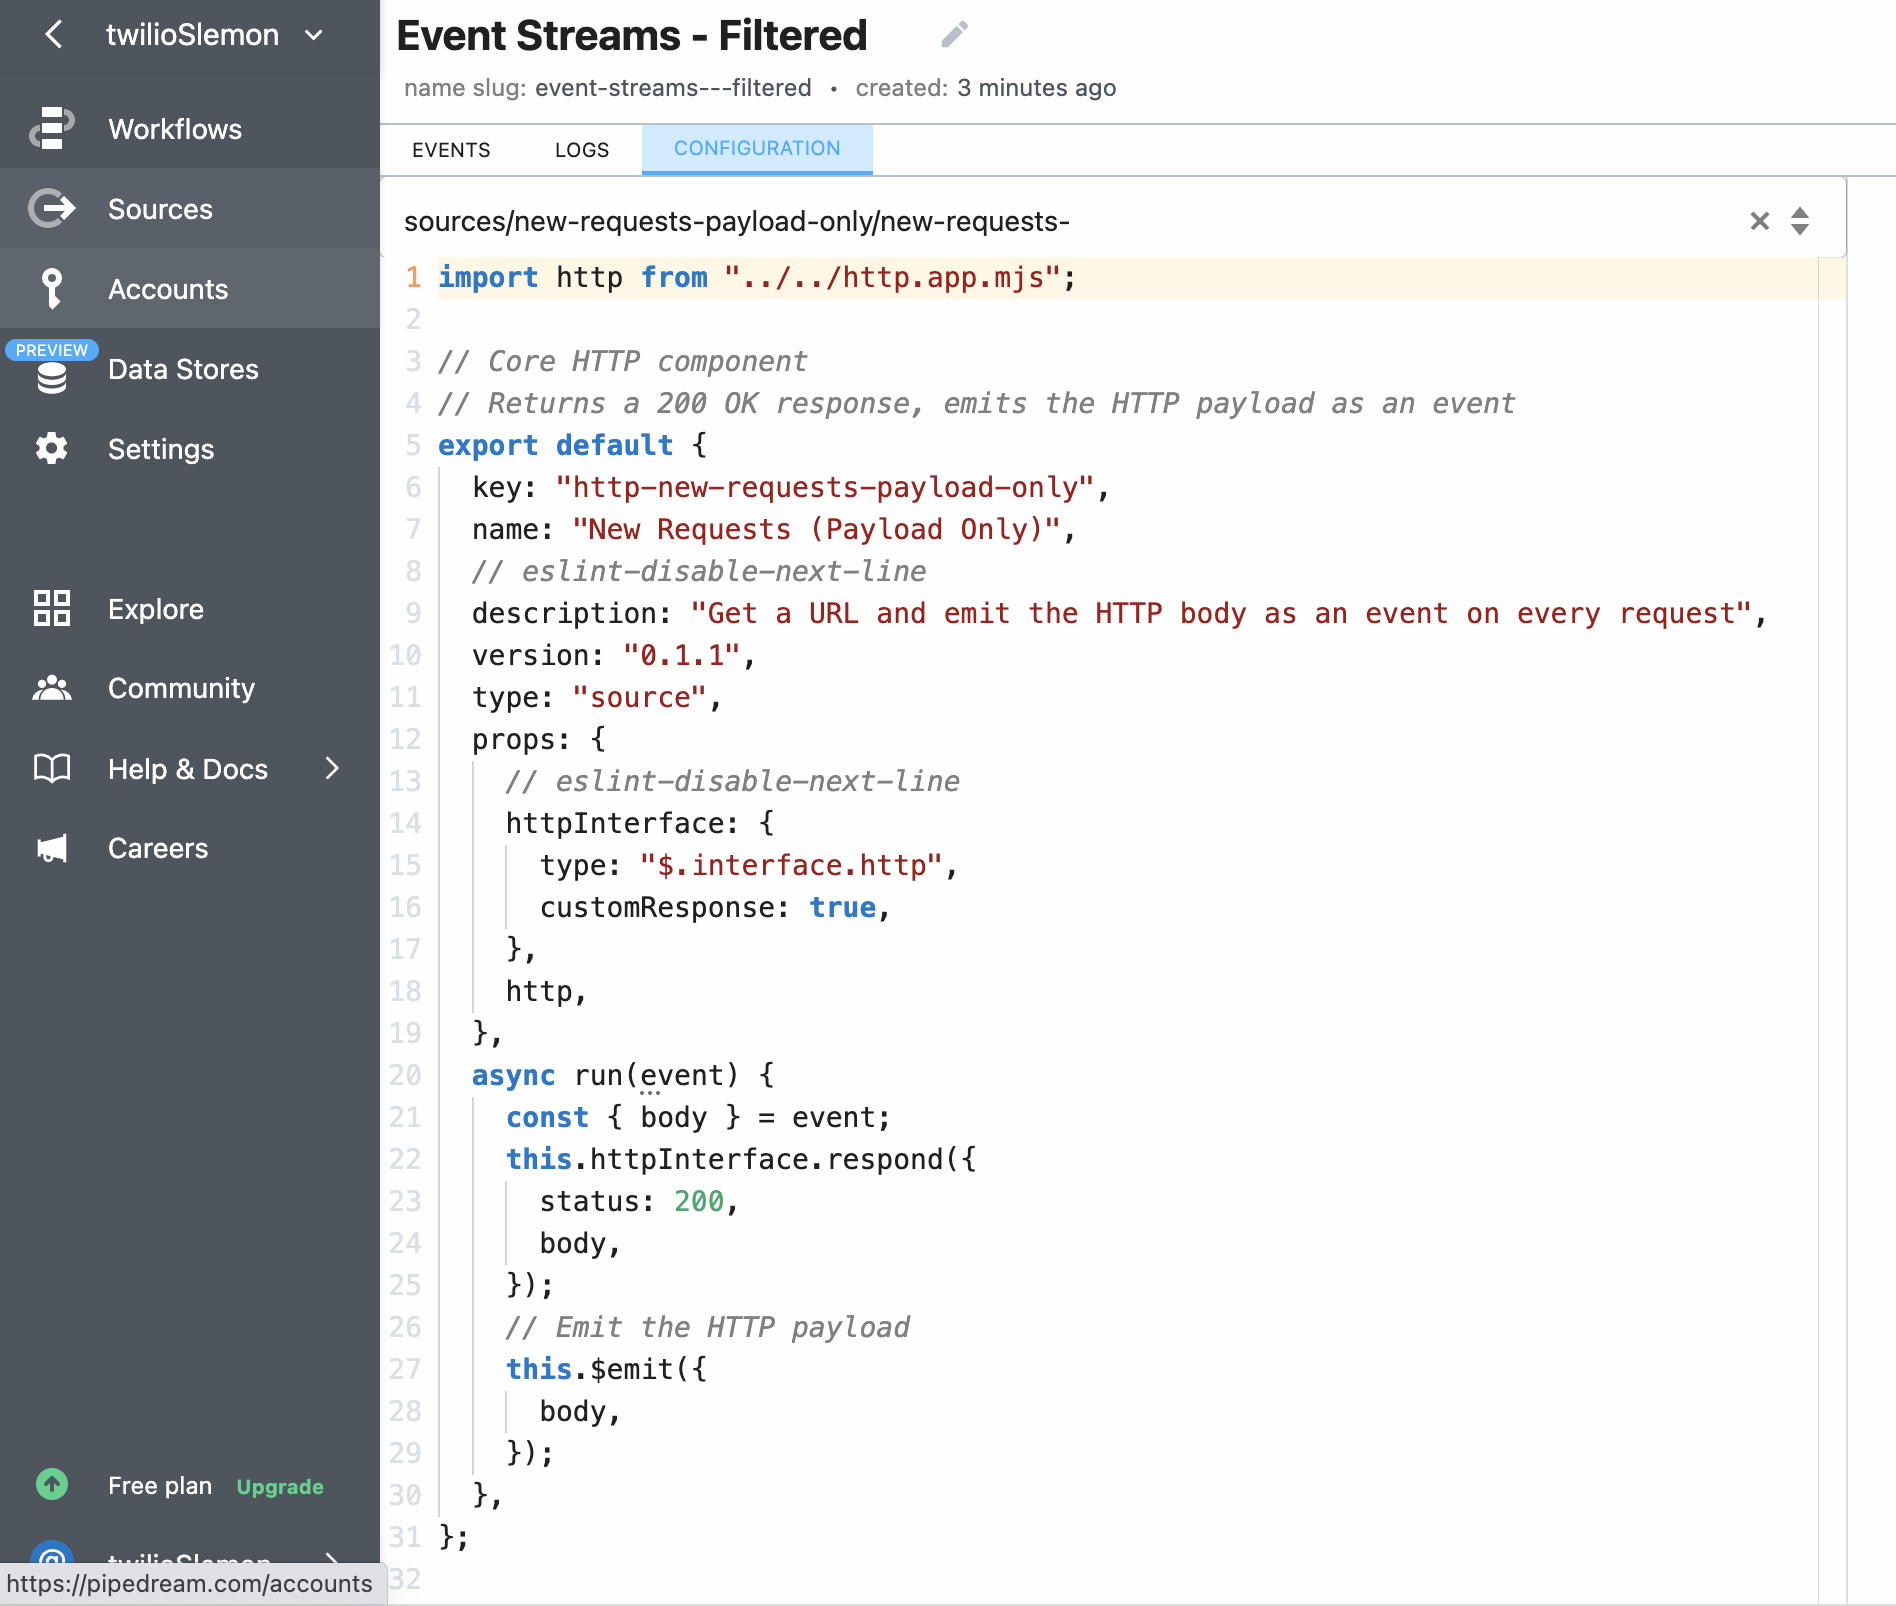
There are two key things we’ll want to change in this code:
- We want to add the ability to filter for a specific SIM that we will be testing with.
- We want to change the output that will be displayed in the Inspector tab.
This will be done by changing this code:
...to be this:
In this modified code there are three key parts to notice:
- First, we added an “if” statement that allows us to filter based on the SIM ICCID. This is so that we only see events in the Inspector that are related to the SIM we are working with. Make sure that you put your ICCID in this code where my test ICCID is.
- Second, the “emit” content was changed to be
body[0].data. This will cause only the body of the event to be displayed in the Inspector, instead of the headers and wrapper layers of the event. - The “summary” was specified. This value is displayed as the title of the event in the event panel list of events. You can actually make the summary anything you like, and it could have been set to be the event type or any other field from the event itself.
Click the green Update Code button on the right to save your changes. You can now click the Events tab at the top and you are ready to begin receiving events. The next step is to direct the events to your new Source endpoint.
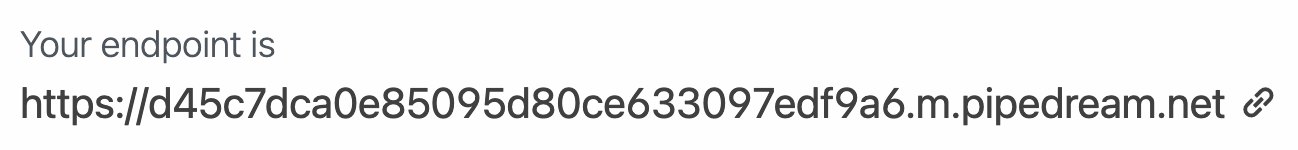
Copy Source URL and create a New Event Streams Sink
On the Events tab on the RequestBin page, on the right side where it says “Your endpoint is:”, click the link icon at the end of your endpoint URL and it will be copied to your clipboard.
Now, open another tab in your browser and login to the Twilio Console.
If you have neer looked at Event Streams it will not yet be visible in the left nav of the Twilio Console. You’ll have to click the “Explore Products” link lower in the left nav, and then select “Developer tools” or scroll down on the page and look for “Event Streams.” You might want to click the pin icon to pin this to your left nav to make it easier to get to later. Select "Event Streams and Manage".
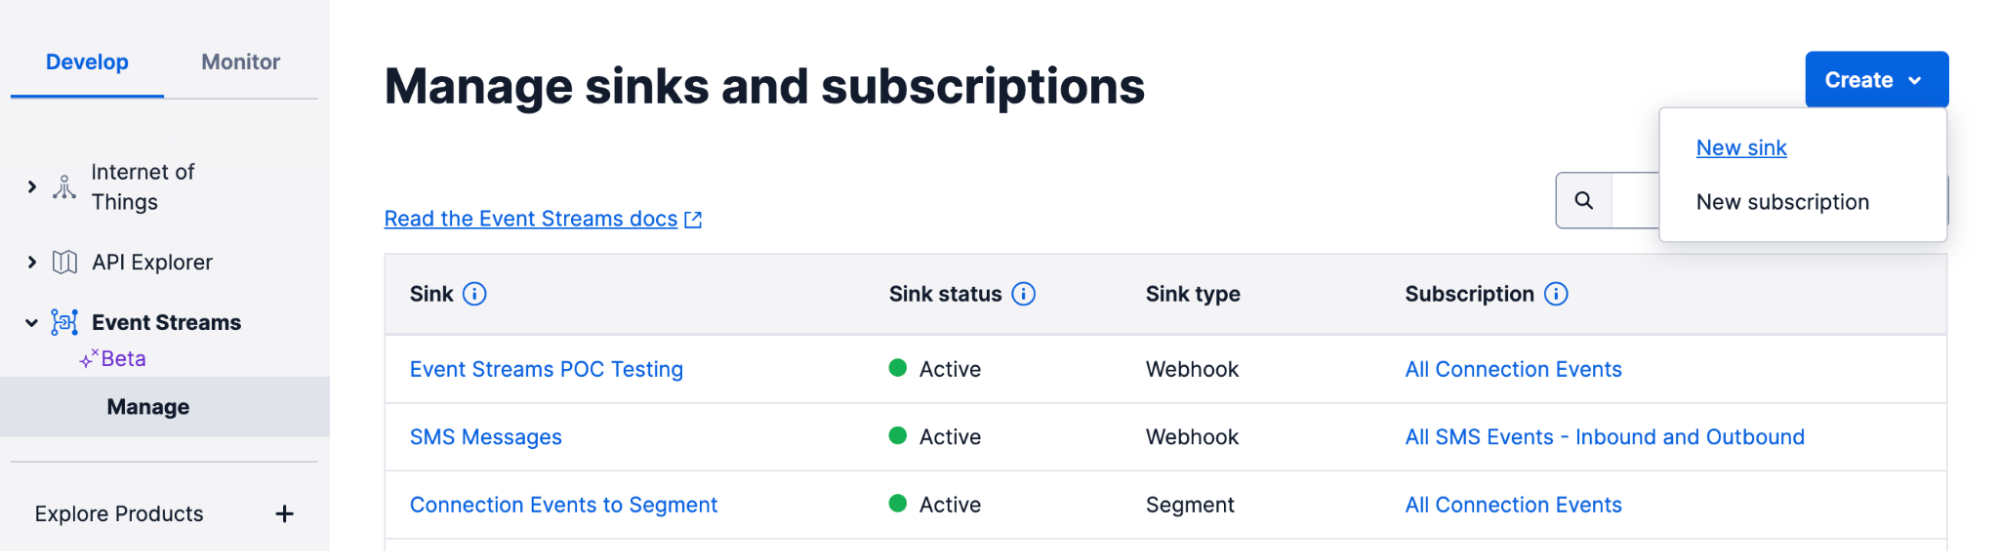
On the “Manage sinks and subscriptions” page click the "Create" button in the upper right, and then "New sink".
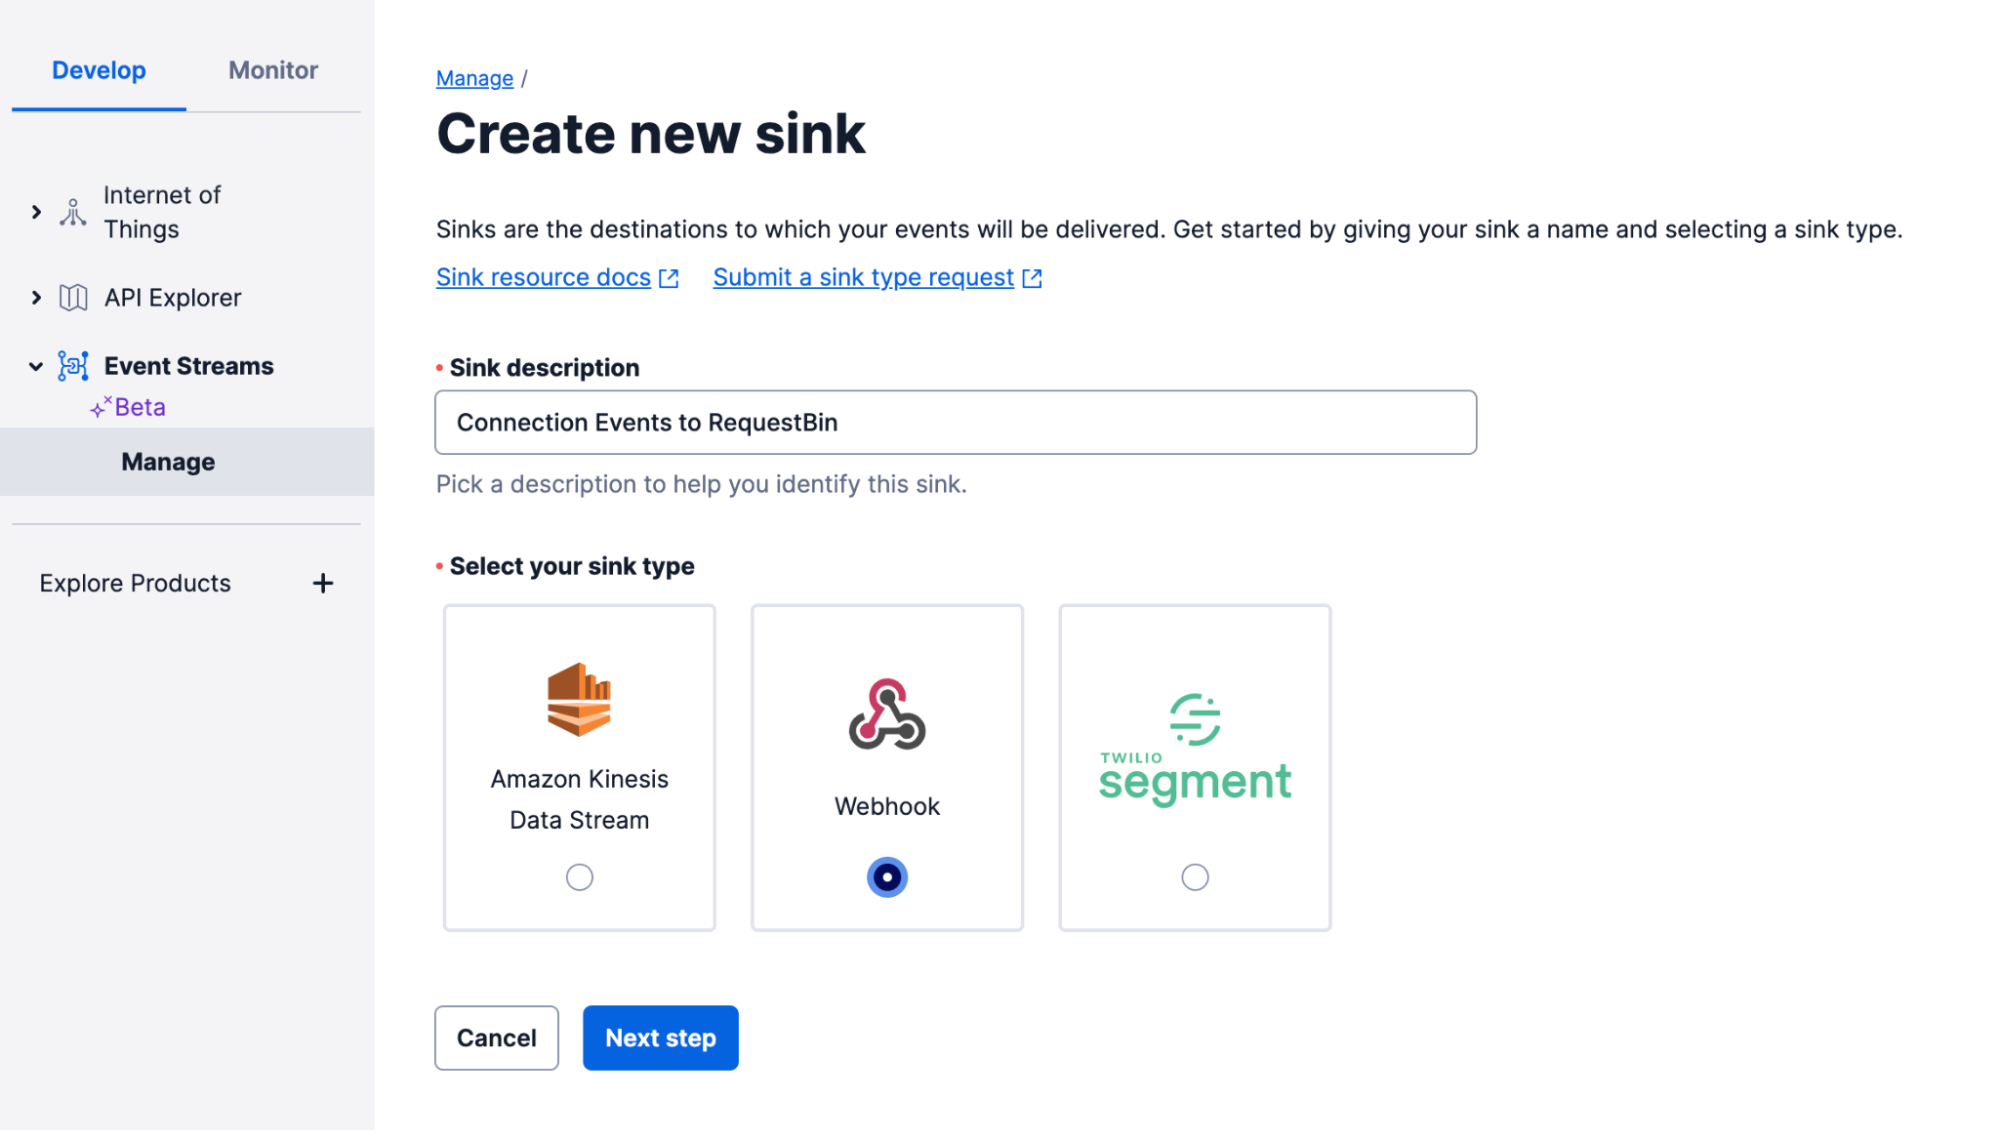
On the “Create new sink” page that appears you can now provide a description (e.g. Connection Events to RequestBin”) and then select “Webhook” and “Next Step”.
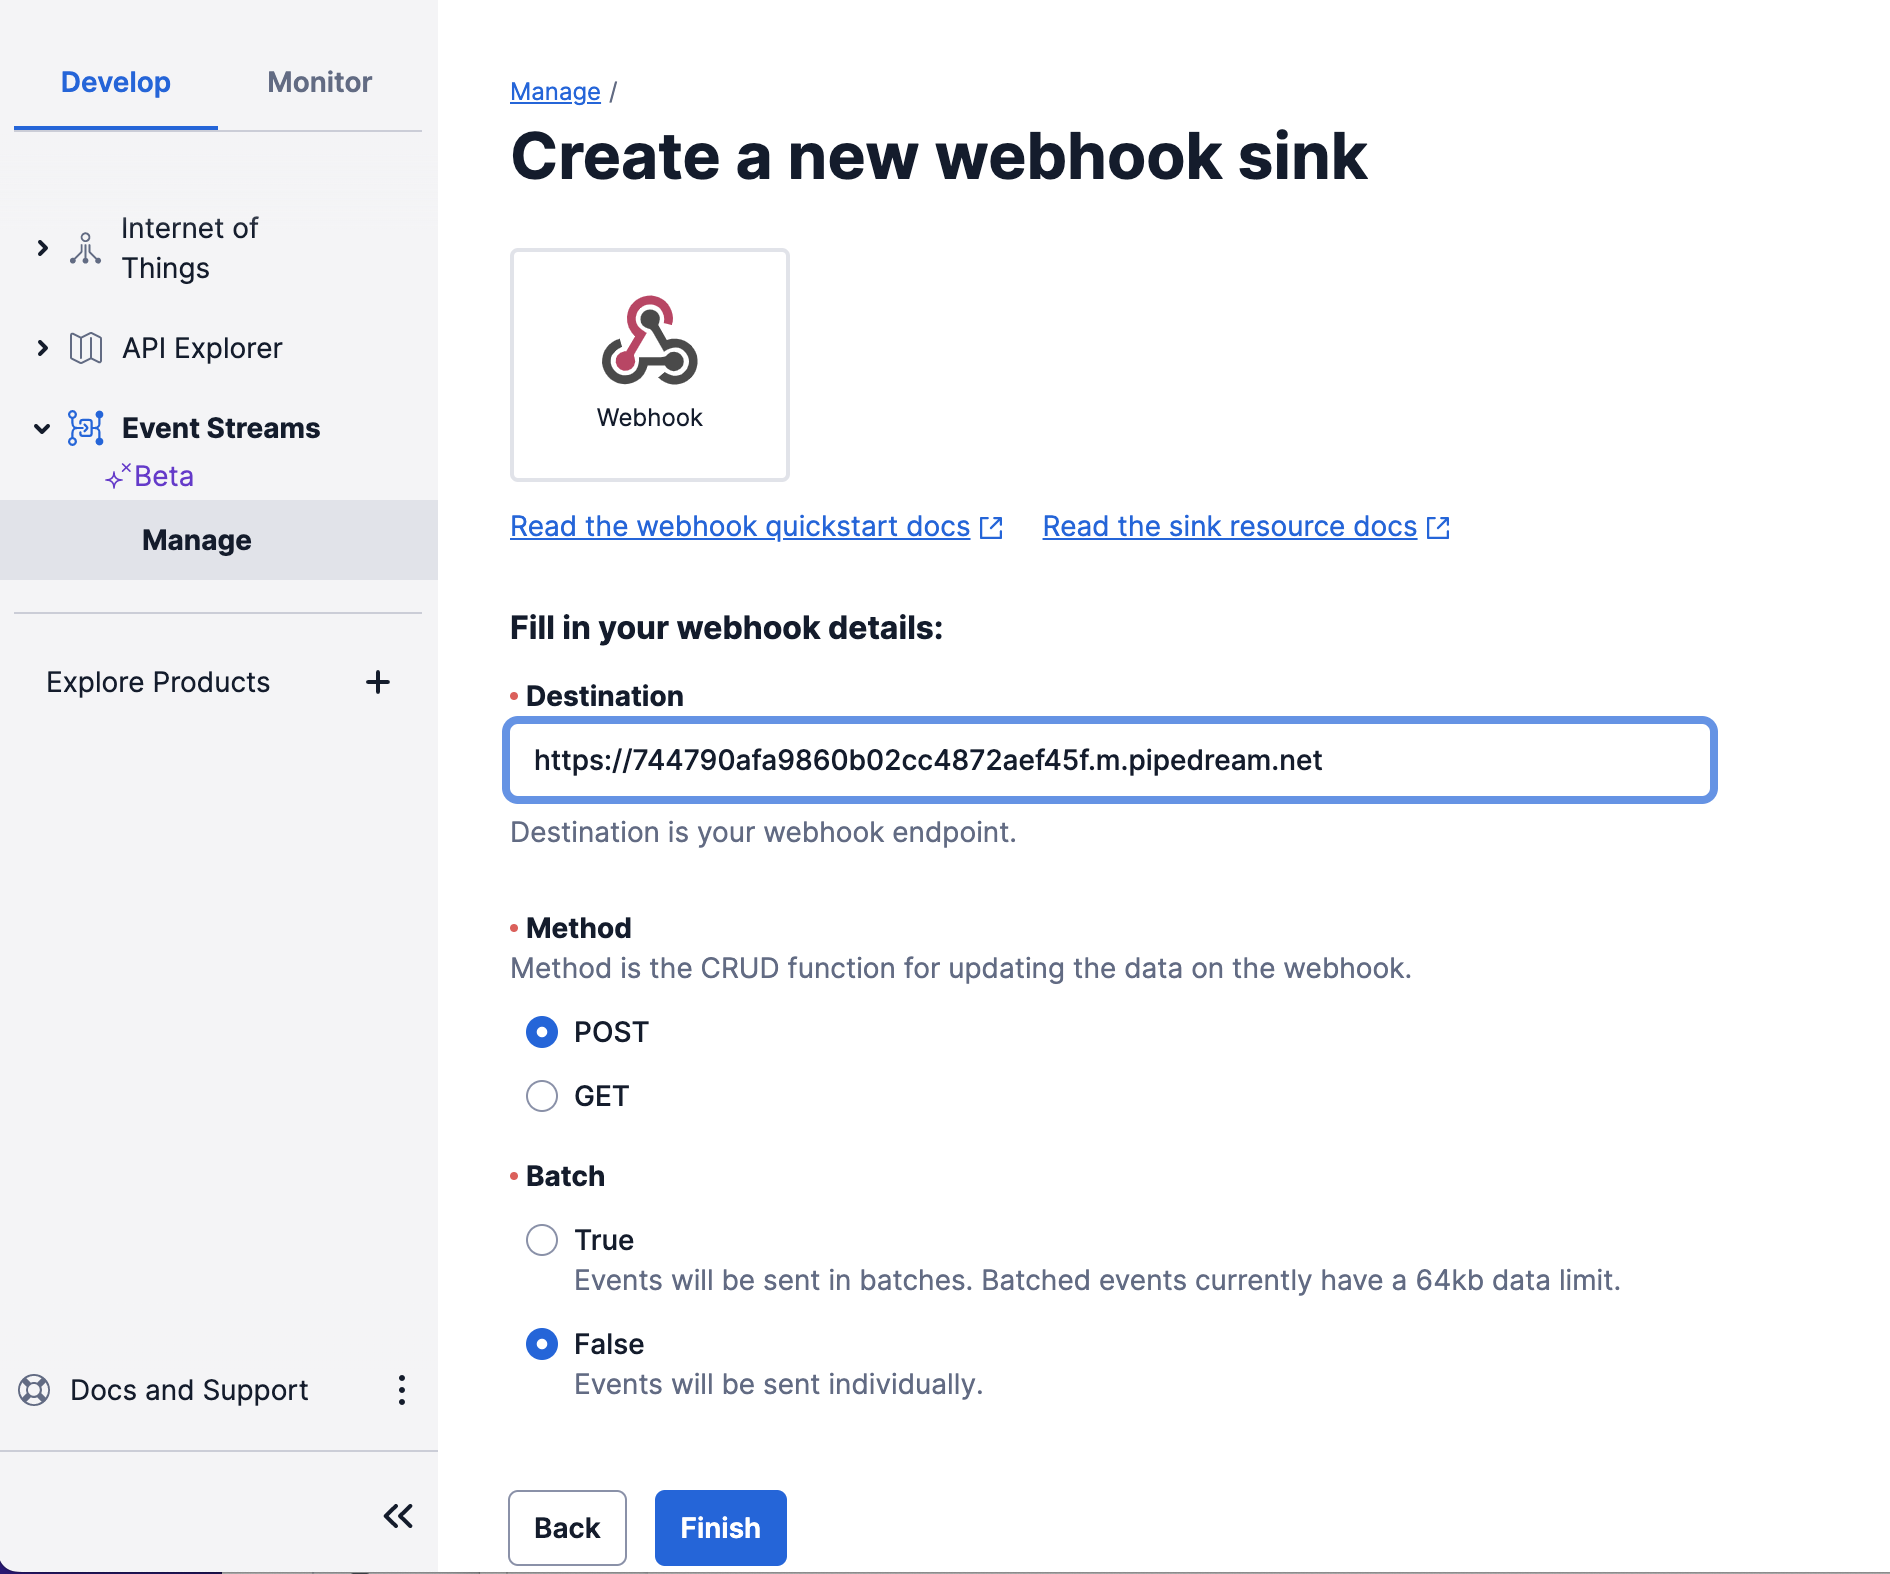
At this point you will be prompted for the “Destination” where you paste the link you copied from your Source on RequestBin. Select “POST” as the “Method”, and then set the “Batch” option to be “False”. Click the “Finish” button. A pop-up window will appear:
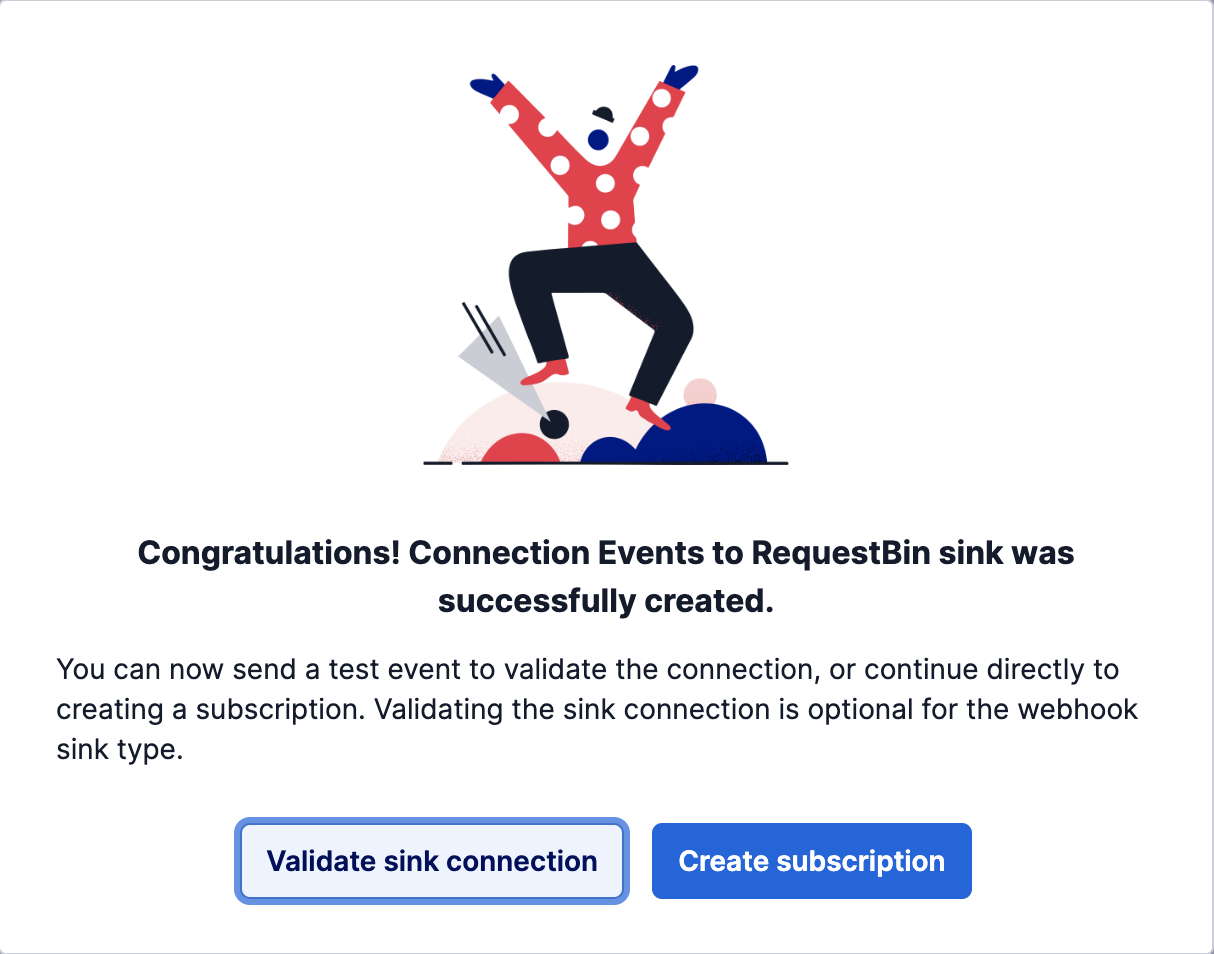
You have the option to validate the sink, however this is optional for Webhook sinks and so we’ll skip that. Click the “Create subscription” button.
Create your Connection Events subscription
On the Create new subscription page that appears your Sink should already be selected in the Select sink field. Enter a name for your subscription (e.g., "All Connection Events”) in the Subscription description field.
As you scroll down the page, select the “Internet of Things” Product Group. At the top of the table that appears, on the right side, you can select the largest schema number that appears:
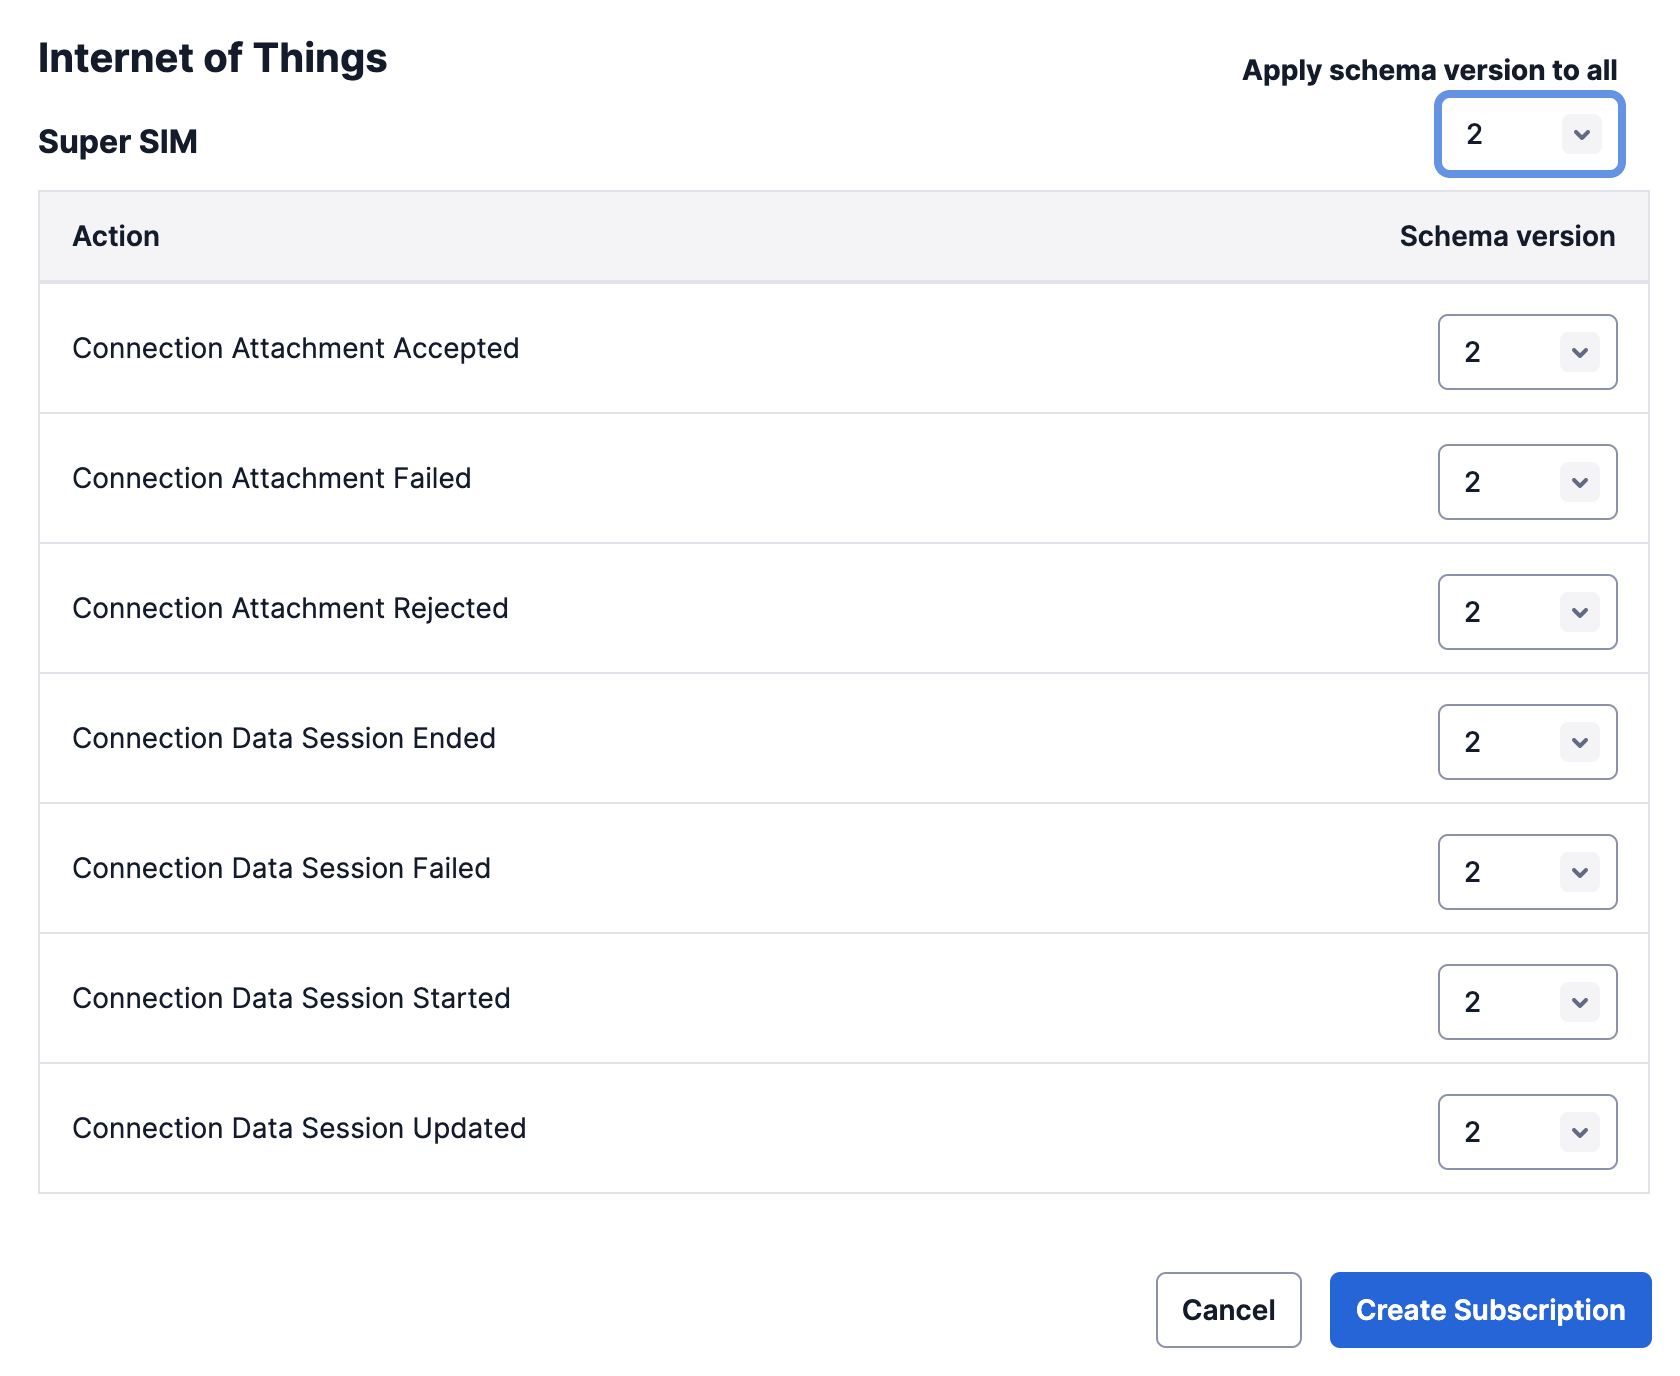
Then click the Create Subscription button. A pop-up window appears that indicates your subscription has been created.
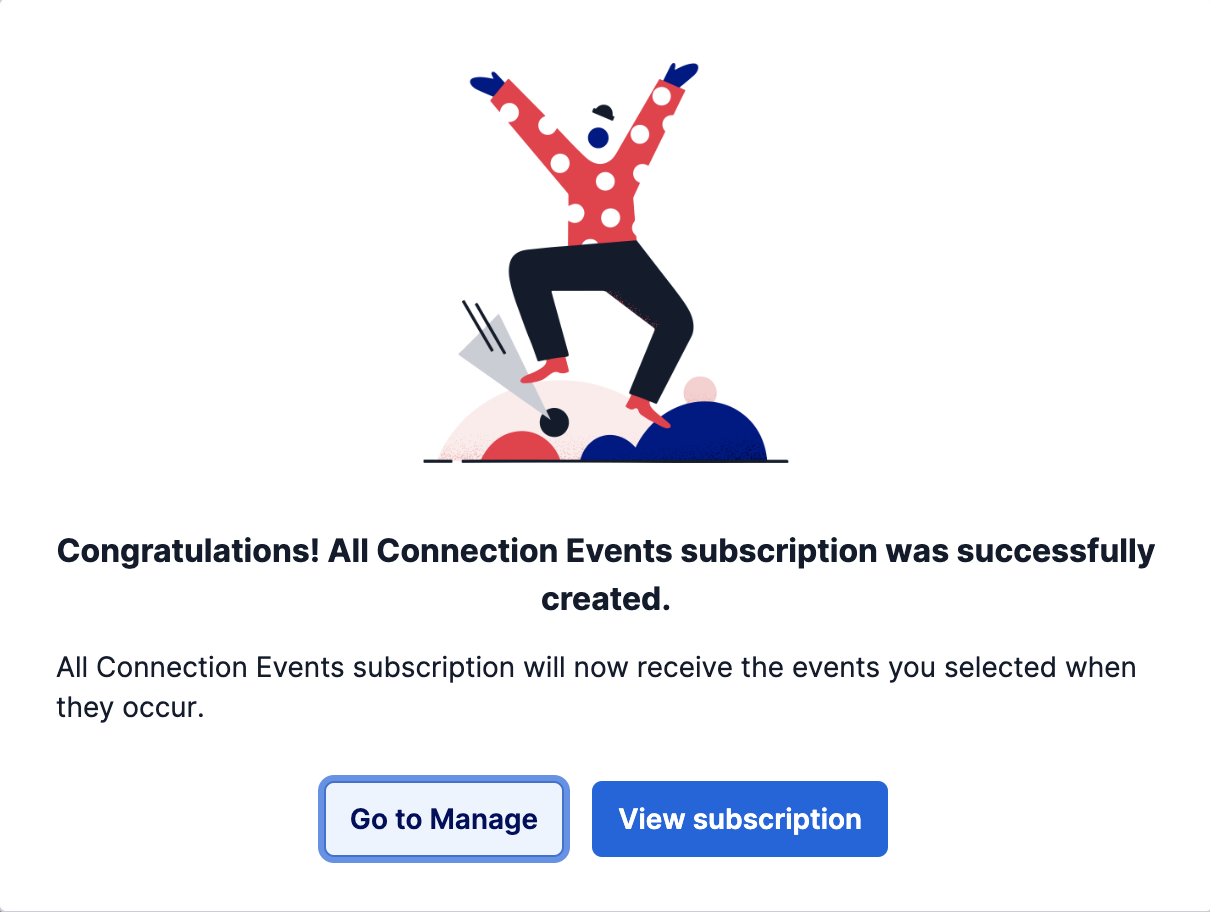
You can click either button if you want to review your Sink or Subscriptions, however Events should now be flowing to your RequestBin endpoint!
Inspect your Events
If you now return to your RequestBin tab, you should either see that your endpoint is waiting for Events, or you will see Events listed.
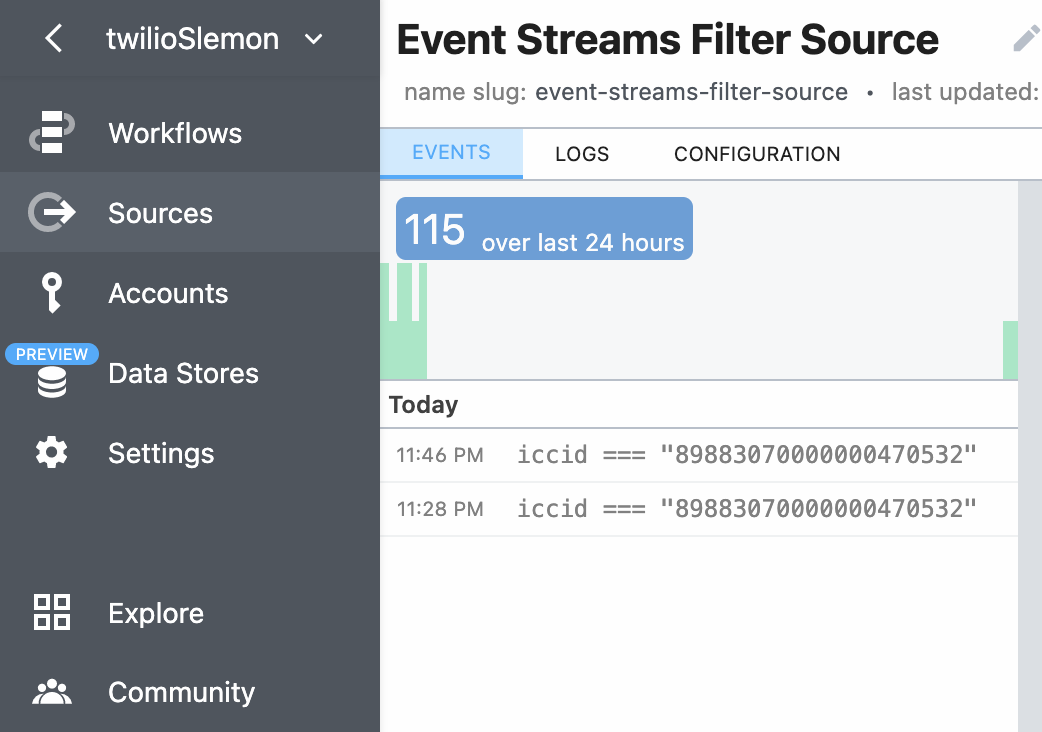
When Events arrive, the code we edited will filter them for the specific ICCID, and then be displayed as a list.
If you select a particular event, the contents of the Event will be displayed in a tree that you can expand to see the details of the Event.
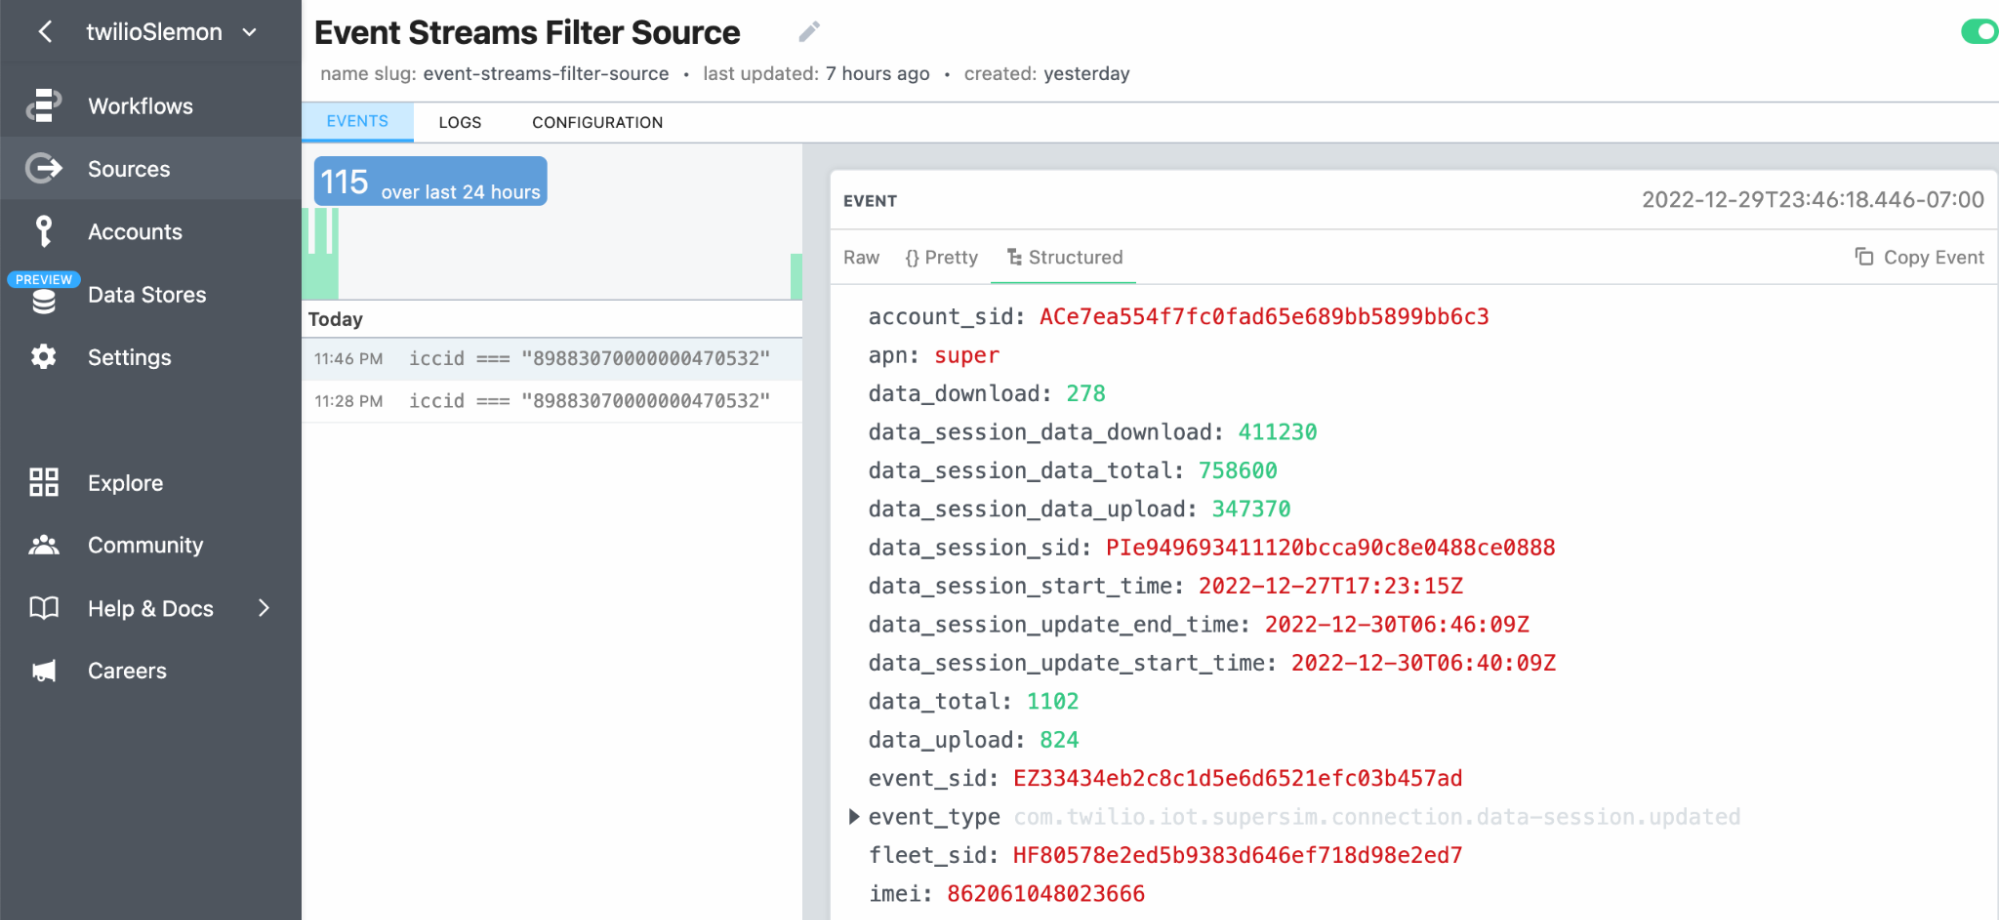
You can read here to learn more about the events and what they mean: https://www.twilio.com/docs/iot/supersim/connection-events-on-event-streams
When you are done with the testing or debugging, you can go back to the Twilio Console and delete the subscription to this Sink. That will stop the flow of events and any potential costs.
Using this method you can confirm that the modem is registering on the cellular network, determine which carrier it is utilizing, see the amount of data that is flowing up and down from the modem, and other valuable information during your testing and debugging.

Related Resources
Twilio Docs
From APIs to SDKs to sample apps
API reference documentation, SDKs, helper libraries, quickstarts, and tutorials for your language and platform.
Resource Center
The latest ebooks, industry reports, and webinars
Learn from customer engagement experts to improve your own communication.
Ahoy
Twilio's developer community hub
Best practices, code samples, and inspiration to build communications and digital engagement experiences.