How to Receive Notifications with Prometheus, Spring Boot, and Twilio SMS
Time to read:
In the world of computing, it is known that no system is 100% error-free. However, minimising the errors is crucial to enhance the system's performance and effectiveness. This means ensuring the system is fully tested before it goes to production.
As a result, other aspects of ensuring the system's performance and effectiveness are required. One such aspect is application monitoring which helps to identify the type of error that causes an application to fail.
In addition, monitoring detects potential errors that might cause an application to fail early on. As a result, an alert can be triggered to notify the developers about the error.
In this tutorial, you will learn how to receive notifications for Prometheus alerts with Spring Boot and Twilio SMS .
Prerequisites
- Knowledge of Java programming.
- Java development kit (JDK)11 or above.
- Twilio account - Create a Twilio account to leverage their free credits for testing purposes. For this tutorial, you will test the application using Twilio SMS, so ensure you create a Twilio phone number.
- Prometheus precompiled binaries - Download Prometheus precompiled binaries using the link provided. As a result, this will give you access to the Prometheus monitoring system and time series database.
- Alertmanager precompiled binaries - Download Alertmanager precompiled binaries using the link provided. The Alertmanager will be used to handle the alerts sent by the Prometheus server.
- IntelliJ IDEA community edition - However, you can use any development environment that supports Java.
Set up the Prometheus Spring Boot application
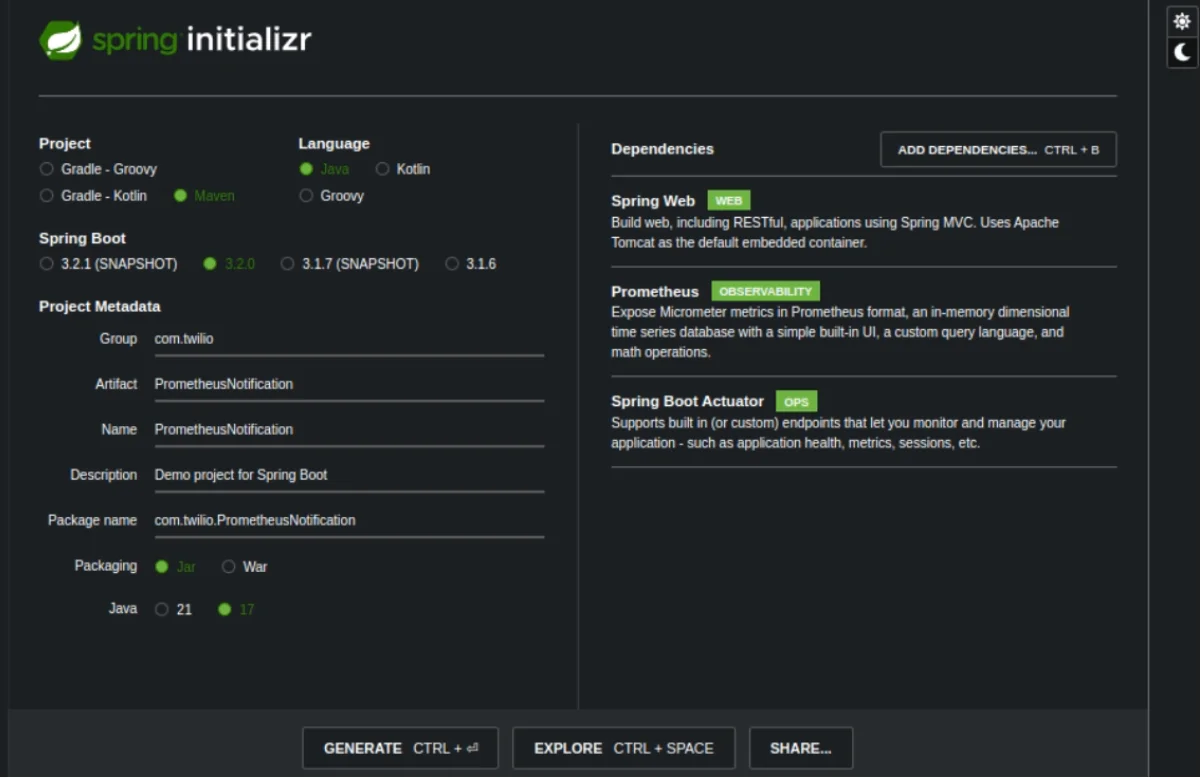
To create a Spring Boot project, go to Spring Initializr and select Maven on the Project section. Next, select Java in the Language section and 3.2.x in the Spring Boot section where the x represents the latest version.
In the Project Metadata section, enter the Group as com.twilio and PrometheusNotification in the Artifact section. As a result, the Package name should read as com.twilio.PrometheusNotification. The package name is filled for you automatically.
You can fill in an arbitrary name and description for the Name and Description sections. Next, select Jar in the Packaging section and 17 in the Java section.
To add dependencies to your project, click on the ADD DEPENDENCIES button and select the following dependencies.
- Spring Web - This helps to build web and RESTful applications using Spring MVC. Apache Tomcat is the default embedded container.
- Prometheus - Exposes several services including Micrometer metrics in Prometheus format, an in-memory dimensional time series database with a simple built-in UI, a custom query language, and maths operations.
- Spring Boot Actuator - This adds support for built-in or custom endpoints that let you monitor and manage your application’s health, metrics, sessions, etc.
If you have followed these instructions to the latter, your project structure, and dependencies should be as shown in the following image:

Click on the GENERATE button to download a zipped file for your project. Unzip this file on your computer and import it into IntelliJ.
Since you will use Twilio to send notifications, you also need to add the Twilio dependency to the project. As a result, copy and paste the following dependency into the pom.xml file.
To get the latest version of the Twilio SDK, go to Maven Repository and copy the latest version.
Next, use the keyboard shortcut CTRL+SHIFT+O to reload the Maven changes. The shortcut will download the Twilio dependency and add it to the project’s classpath.
Configure properties file
Rename the application.properties file to application.yml to use YAML syntax. Next, copy and paste the following configurations into the file.
The Micrometer dependency exposes an endpoint that returns metrics about the application. Since the endpoint is not exposed by default, the first property helps you to access the endpoint by enabling all the actuator endpoints.
The properties that follow provide the information that will allow you to send a Twilio notification. Replace YOUR_ACCOUNT_SID, YOUR_ACCOUNT_AUTH_TOKEN, YOUR_TWILIO_PHONE_NUMBER, and YOUR_PHONE_NUMBER with the details provided on your Twilio dashboard.
Note that if any of these properties are not provided exactly as on the Twilio dashboard, the functionality for sending an SMS will not work.
To view the details of the exception in IntelliJ, open the console window by navigating to View > Tool Windows > Run. Scroll through the error logs to find a descriptive message about the exception. For instance, an authenticate exception indicates the token is not correct and invalid username indicates Twilio SID is not correct.
Configure Prometheus in your Spring Boot application
Prometheus is a tool used to monitor applications and it can be used on both local and containerized environments. For this tutorial, you will run the Prometheus server locally.
After downloading and extracting the precompiled binaries of Prometheus on your computer, open the file named prometheus.yml. Copy and paste the following configurations into the file.
Use the comments provided in the configuration file to understand how the Prometheus server will operate. In summary, the Prometheus server will run on port 9090 and it will scrape metrics from the endpoint /actuator/prometheus endpoint running on port 8080.
In addition, any alerts in the alert.rules.yml file that will be fired will be processed by the Alertmanager running on port 9093. You will create the file later.
Note that since the endpoint /actuator/prometheus returns the metrics in a format that Prometheus will understand, exporters are not required in this case.
To test whether Prometheus is scraping data from the endpoint, use the shortcut SHIFT+ F10 to run the Spring Boot application. If you are using a Mac computer, the shortcut to run the application is control + R. Next, open a new terminal window and CD into the Prometheus directory where the prometheus.yml file is located. Use the following command to start the Prometheus server.
For example, if you unzipped the precompiled binaries of Prometheus on the Desktop, your command should be as shown below.
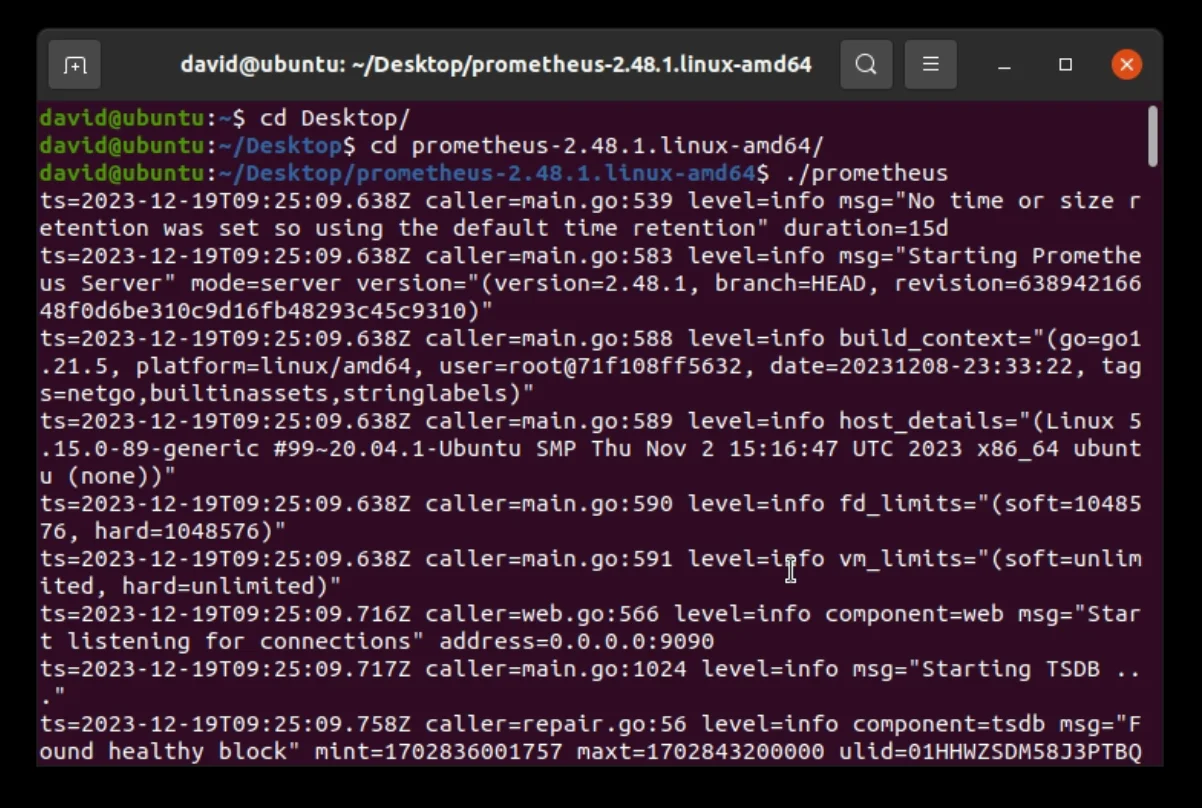

To access the Prometheus UI, go to localhost:9090 which returns a page where you can see the different values of the metrics. Since you want to see the status of the endpoint, toggle the Status dropdown and select the Targets option. This should open the page shown below.
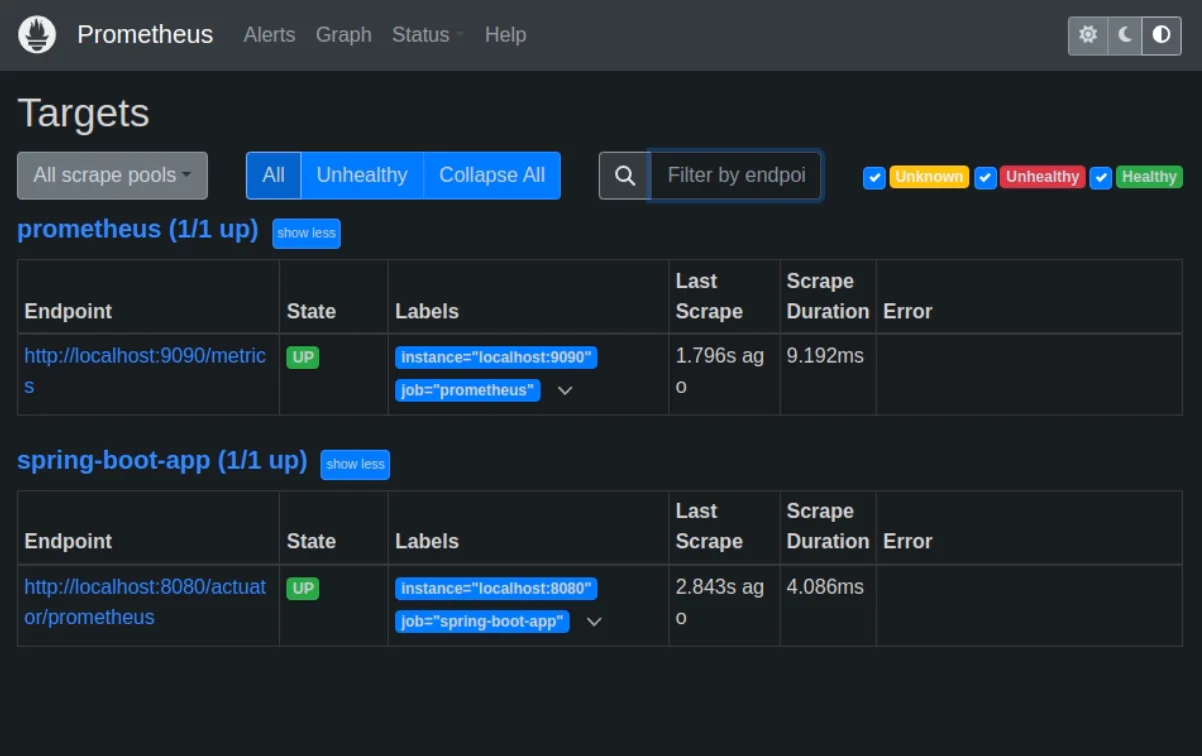

The endpoint should show a green button labelled UP to indicate that Prometheus is scraping data successfully. If you see a red button labelled DOWN then it means you have not configured Prometheus correctly.
Create a custom metric
In your Spring Boot project, create a package named controller under the package com/twilio/PrometheusNotification. Next, Create a file named CustomMetricsController.java in the new package. Copy and paste the following code into the file.
In this class, you have created a custom metric named custom_requests_total using a builder of the Counter class. This metric will be used to track the number of requests issued to the /hello endpoint. Go to the Prometheus documentation to learn more about the counter metric and other metric types .
The reason for using the builder of the Counter class is that you expect the value of the metric to be an increasing numeric value. The class named MeterRegistry holds the set of metrics for the application and to add the custom metric to the collection, call the register() method of the builder class and pass the registry reference.
Each time a request is made to the /hello endpoint, the counter is increased by 1. As a result, the custom_requests_total metric will hold the value of the current counter.
Create an alert rule
Inside the Prometheus folder containing the prometheus.yml file, create a new file named alert.rules.yml. Copy and paste the following configurations into the file:
Use the comments provided in the file to understand how the alert rule will trigger an alert. In summary, Prometheus will load this rule once and it will periodically evaluate it to check if the condition has been met.
In this case, Prometheus will trigger an alert to the AlertManager if the value of custom_requests_total is greater than 3. This is the maximum number of requests expected for this endpoint.
Note that the value is just for testing purposes so you can modify it as you like. The important thing to note here is that the alert will be triggered once the number of requests exceeds 3 and it should persist for at least 15 seconds to be considered valid.
To verify that Prometheus has loaded the alert rule, go back to the Prometheus UI and click on the text labelled Alerts. You should see the following page if you have configured Prometheus correctly.
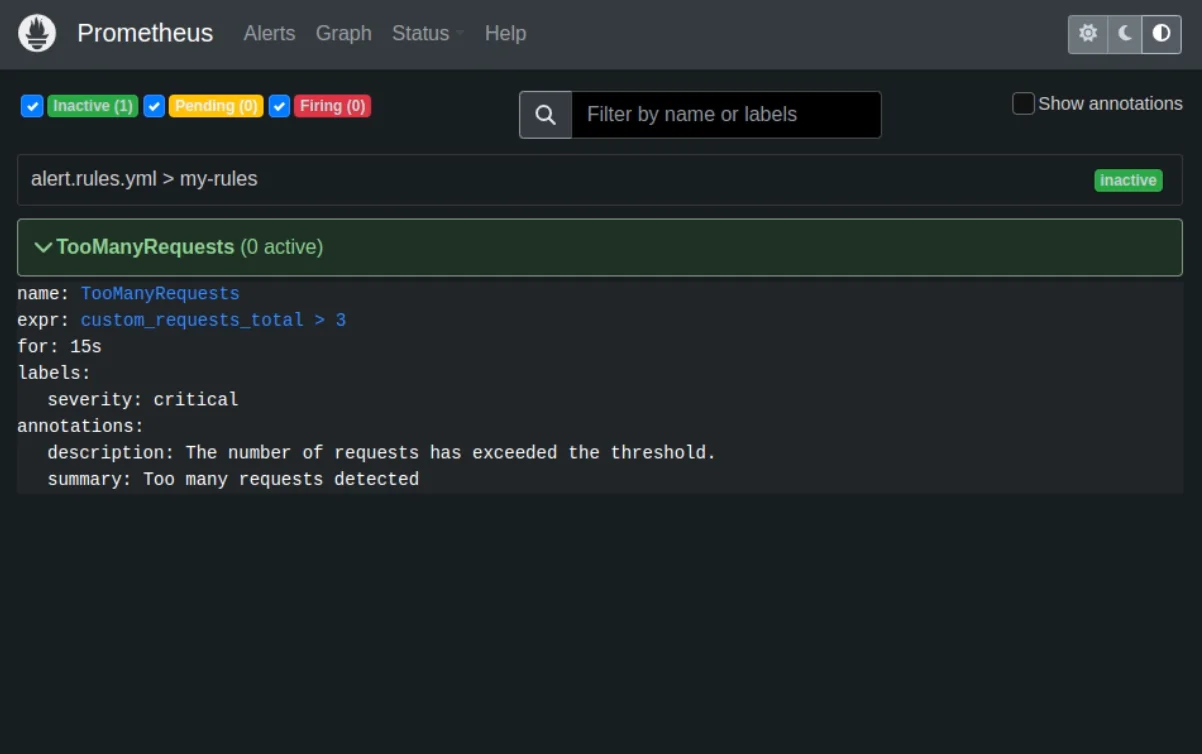

If you cannot see the above configuration, try re-running the Prometheus server and reload the page again. Prometheus should now be able to read the rules defined in the alert.rules.yml file.
Configure Alertmanager
Open the file named alertmanager.yml located in the folder containing the precompiled binaries of AlertManager. Copy and paste the following configurations into the file:
Use the comments provided in the file to understand how the Alertmanager will work. In summary, Alertmanager will group any incoming alert and route it to a webhook to send a Twilio SMS notification.
Note that the URL for the webhook is /send-sms and you must implement a controller in your application to handle the webhook. Since a POST request is issued by the webhook, ensure the appropriate mapping is used to handle the request.
To run the Alertmanager server, open a new terminal window and CD to the folder where the alertmanager.yml file is located. Use the following command to start the server.
For example, if you unzipped the prometheus precompiled binaries on the Desktop, your command should be as shown below:
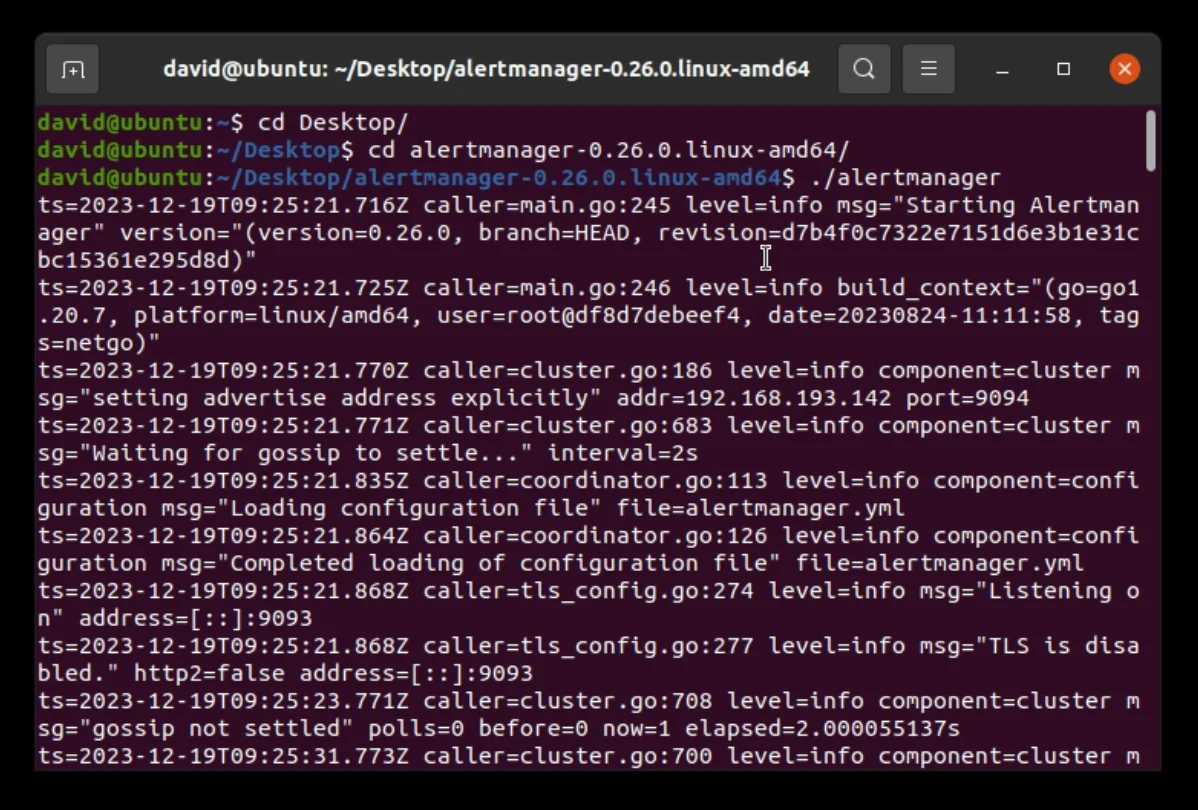

To verify that the Alertmanager server is up and running, go to localhost:9093 and this should return a page for the Alertmanager UI. When you first load the UI it should have the appearance shown below:
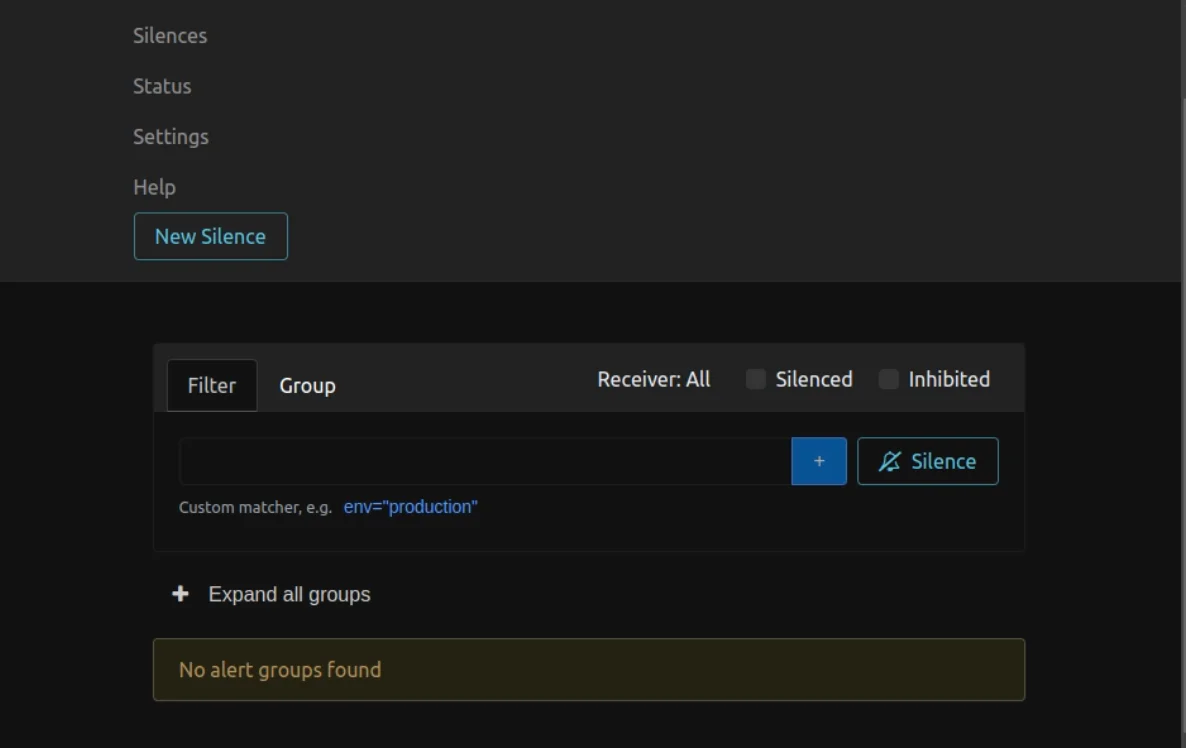

Note that since no alerts are being fired from Prometheus at the moment, AlertManager shows that there are no alert groups found.
Create a Twilio service
Create a package named service under the package com/twilio/PrometheusNotification. Next, create a file named TwilioService.java under the new package. Copy and paste the following code into the file:
This class will be responsible for sending a Twilio SMS to notify that the requests are too many. First, start by injecting the Account SID, Auth Token, and the Twilio phone number using @Value annotation.
Next, create a method named sendSMS() that expects your phone number and the message to be sent. These parameters will be passed inside the controller that defines the /send-sms endpoint.
To initialise the Twilio environment, call the init() method and pass the injected Account SID and Auth Token. Create a message using the creator() method by passing your phone number, Twilio phone number, and the message. Finally, calling the create() method will send a Twilio SMS containing the message to your phone number.
Create webhook handler
Create a file named SmsController.java under the package com/twilio/PrometheusNotification/controller. Copy and paste the following code into the file:
This class will be responsible for handling the webhook defined in the alertmanager.yml file. Since the webhook routes the Alert to send a Twilio SMS via the /send-sms endpoint, the class must define an appropriate mapping to handle the request.
As a result, the @RequestMapping annotation will process any request issued to the /send-sms endpoint. The sendSMS() method you defined in the previous section expects your phone number and the message, so start by injecting your phone number using @Value annotation.
To call the method, you also need to inject the TwilioService class using @Autowired annotation.
The final step in this class involves creating a method named sendSMS() and annotating it with the @PostMapping. Since the webhook sends out a POST request, any incoming request to /send-sms endpoint will be handled by this method.
In addition, the method also defines a custom message that will be sent to you indicating that there are too many requests. As a result, calling the sendSMS() method of TwilioService and passing your phone number and message will send a Twilio SMS to your phone number. The print statement added in the method helps to verify if a message was sent or not.
Run and test the application
Re-run the Spring Boot application by using the shortcut SHIFT+F10 and open a new terminal window to make requests to the /hello endpoint using Curl.
Note that an alert will be triggered if you make more than three requests to this endpoint. As a result make 4 Curl requests to ensure the alert is triggered. Your Curl commands should be as shown in the following image:
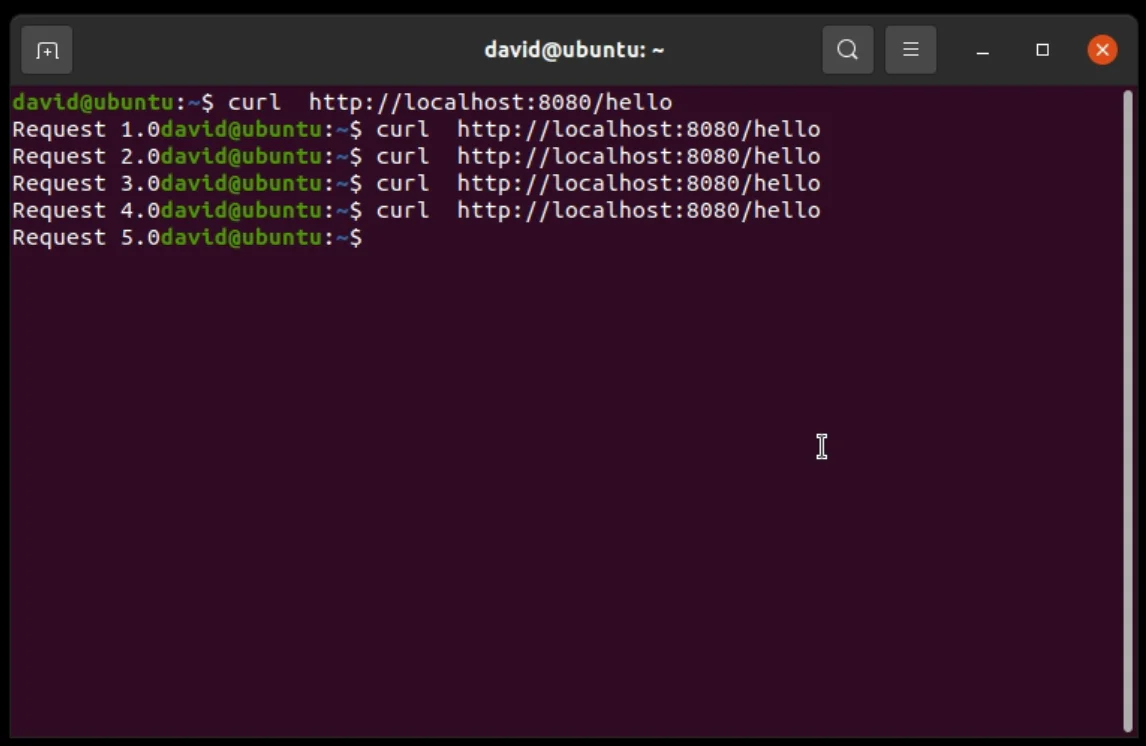

After making the requests wait for 15 seconds so that the alert rule can be considered valid. Note that the condition must persist for at least 15 seconds to be considered valid. After 15 seconds have erupted, Prometheus should have triggered an Alert to the Alertmanager.
To verify this, go to the Alertmanager UI and check whether there are any alerts. The Alertmanager is available at localhost:9093. If an alert has been received, the Alertmanager UI should be as shown below.
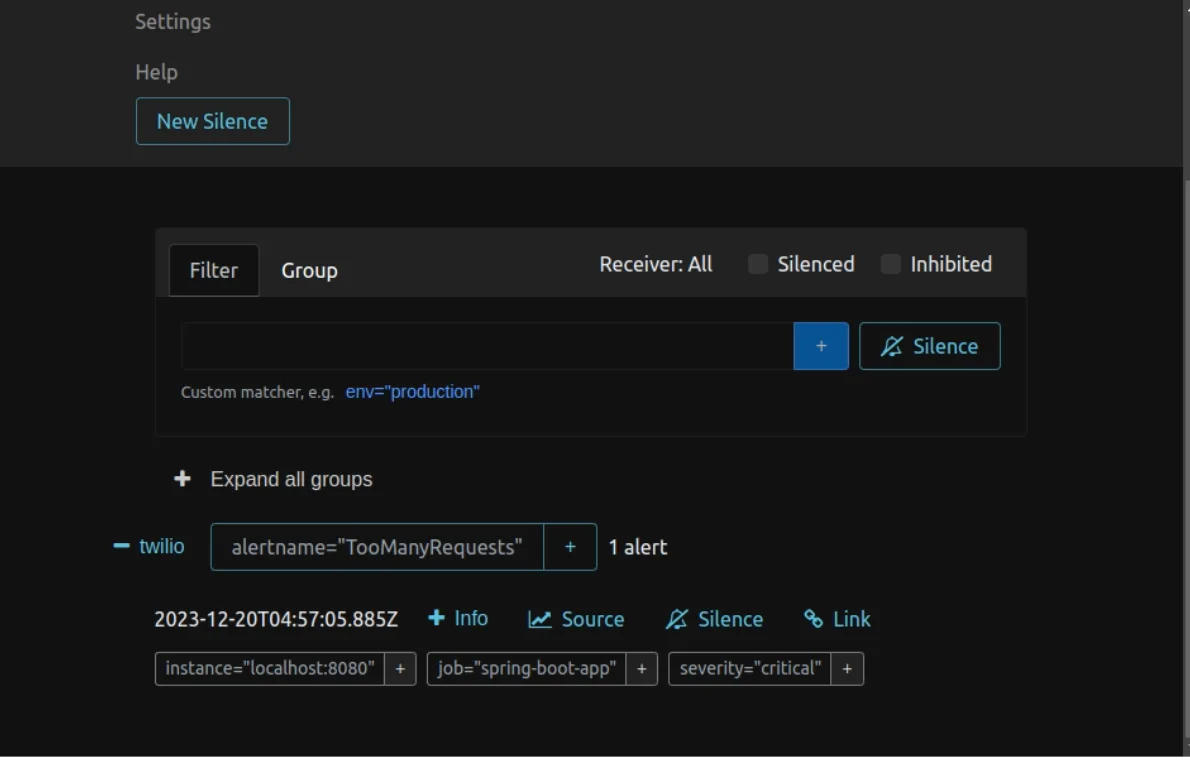

The status now shows that you have one alert group named “twilio”. This group has an alert with the name “TooManyRequests”. With this in place, it means that a Twilio SMS has already been sent to your phone number. As a result, you should have received a Twilio SMS message like the one shown below.
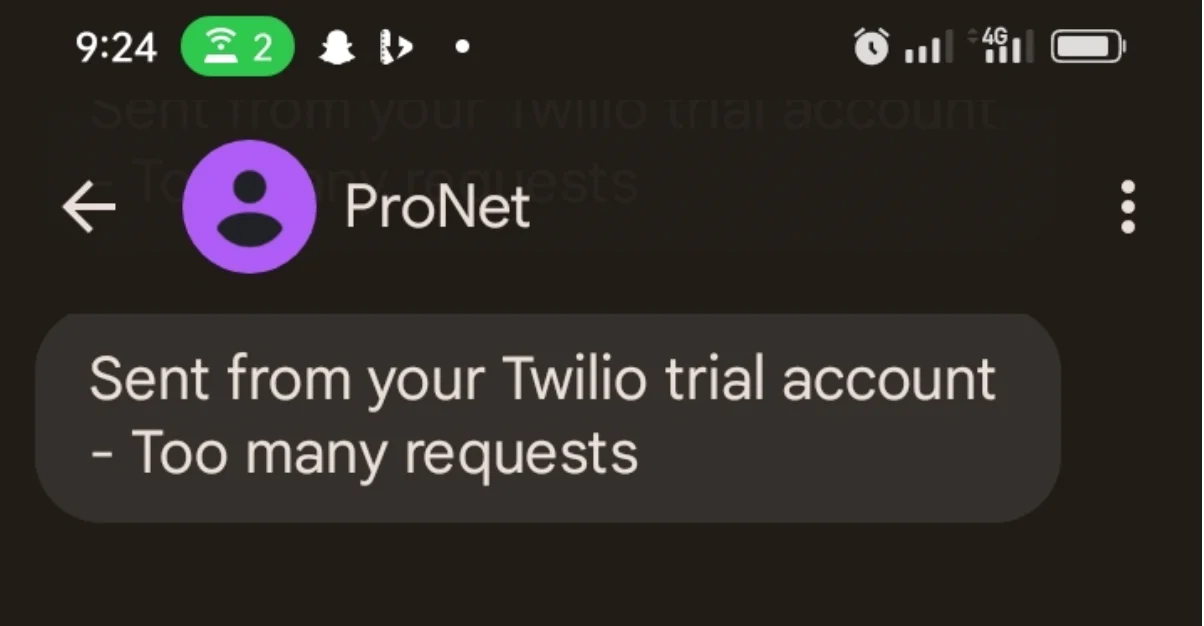

Note that the messages will be sent in an interval of 15 seconds so be careful as not to exhaust your remaining Twilio credits. Alternatively, you can edit the alertmanager.yml file and set the repeat_interval property to a high value such as 30000h. As a result, you will not receive a new message after every 15 seconds. In addition, you can upgrade your Twilio account to remove trial restrictions including the addition of “Sent from your Twilio trial account” to SMS.
What's next for receiving Prometheus alerts with Spring Boot?
In this tutorial, you learned how to receive notifications for Prometheus alerts with Spring Boot and Twilio SMS. Prometheus alerts can also be routed to other receivers including email, Slack, WeChat, PagerDuty, and Opsgenie.
As a result you can also leverage Twilio SendGrid to route Prometheus alerts as email notifications. Using this practice when monitoring applications will be a benefit to the company because the time spent by clients during downtime will be reduced significantly.
Getting immediate notifications regarding an error will ensure that an error is resolved on time and delays are avoided. For example, when working with microservices for a large application, it is very difficult to identify which service has failed if the applications are not being monitored.
In addition, some services are dependent on other services and when one service fails, it might lead to another service failing and so on. As a result, identifying the cause of the error becomes even harder.
By monitoring and configuring your application for alerts, you will always stay ahead of the competition by maintaining 99% uptime for your clients. If you find this article helpful, feel free to check out the Twilio Blog for more articles like this.
David is a technical writer specialising in back-end development, David enjoys simplifying complex ideas for other developers to comprehend. His work has appeared on numerous websites. You can reach out to him through his blog , GitHub, or LinkedIn.
Related Posts
Related Resources
Twilio Docs
From APIs to SDKs to sample apps
API reference documentation, SDKs, helper libraries, quickstarts, and tutorials for your language and platform.
Resource Center
The latest ebooks, industry reports, and webinars
Learn from customer engagement experts to improve your own communication.
Ahoy
Twilio's developer community hub
Best practices, code samples, and inspiration to build communications and digital engagement experiences.
