Hardening Segment’s Front Door: Improving Our Tracking API
Time to read:
At Twilio Segment, a Customer Data Platform (CDP) that helps businesses collect and clean customer data from various sources, building resilient systems is foundational to how we serve customers. Our Tracking API (TAPI) - the front door to our data ingestion platform, must reliably handle millions of requests per second, scale under pressure, and gracefully recover from failures.
In this post, I’ll walk through the architectural limitations we uncovered in TAPI, how we addressed them, and the key improvements that now make it a more robust and cost-efficient system.
Why the Tracking API is critical
The Tracking API is Segment’s primary ingestion interface, responsible for collecting client-side and server-side events that fuel real-time analytics and personalized experiences. It's a vital service for our customers and our platform.
Here’s what makes its reliability so important:
- Core to Business Operations: Customer data collection depends on it—any downtime risks cascading impacts on analytics and automation.
- Massive Throughput: TAPI handles millions of requests per second, globally.
- Strict SLAs: Segment is committed to 99.99% availability for ingestion.
- Downstream Dependency: The Tracking API feeds Kafka and other backend systems that process and deliver insights.
- Complex Environment: TAPI operates across multiple availability zones (AZs), regions, and client environments.
Architecture before the overhaul
Before our overhaul, TAPI had the following characteristics:
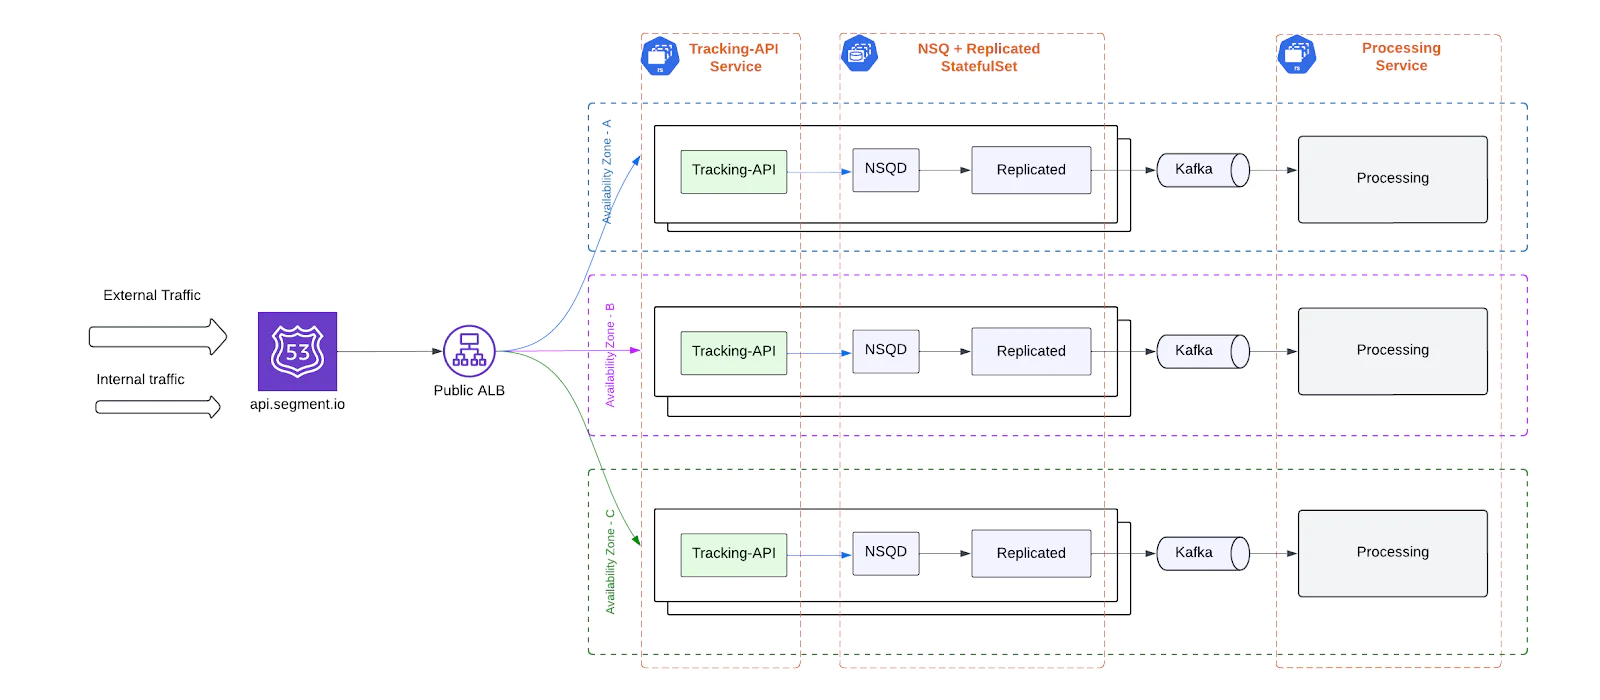

Infrastructure overview
- Single EKS Cluster: All TAPI components ran in a single Amazon EKS cluster, deployed in one AWS region.
- Single Application Load Balancer (ALB): One public ALB routed all external and internal traffic across multiple Availability Zones (AZs). This ALB was a critical choke point.
Service composition
- Tracking-API Service: Deployed as a ReplicaSet, the Tracking API performed lightweight validation for incoming requests and wrote them to an internal buffer queue using NSQ (NSQD). This design helped decouple ingestion from Kafka by:
- Reducing end-to-end latency.
- Allowing temporary buffering during Kafka outages using local disk.
- NSQ + Replicated StatefulSet: Each pod in this StatefulSet ran two containers:
- NSQD: Buffered validated events from the Tracking API.
- Replicated: Pulled messages from the local NSQD and forwarded them to Kafka.
The Replicated service was configured to consume only from the co-located NSQD within the same pod, which ensured high throughput and minimized cross-network latency.
However, this design lacked support for autoscaling, as Tracking API and NSQ + Replicated were deployed separately and required manual coordination to scale together.
- Kafka:Kafka served as the sole backend for ingestion. It consumed events from Replicated and served as the entry point to downstream processing.
- Processing Service:Also deployed as a ReplicaSet, this service consumed events from Kafka and performed additional validations and heavy transformations.
While this architecture worked in most cases, production traffic patterns and edge cases exposed significant reliability, scalability, and maintainability gaps.
Challenges we faced
Single point of failure
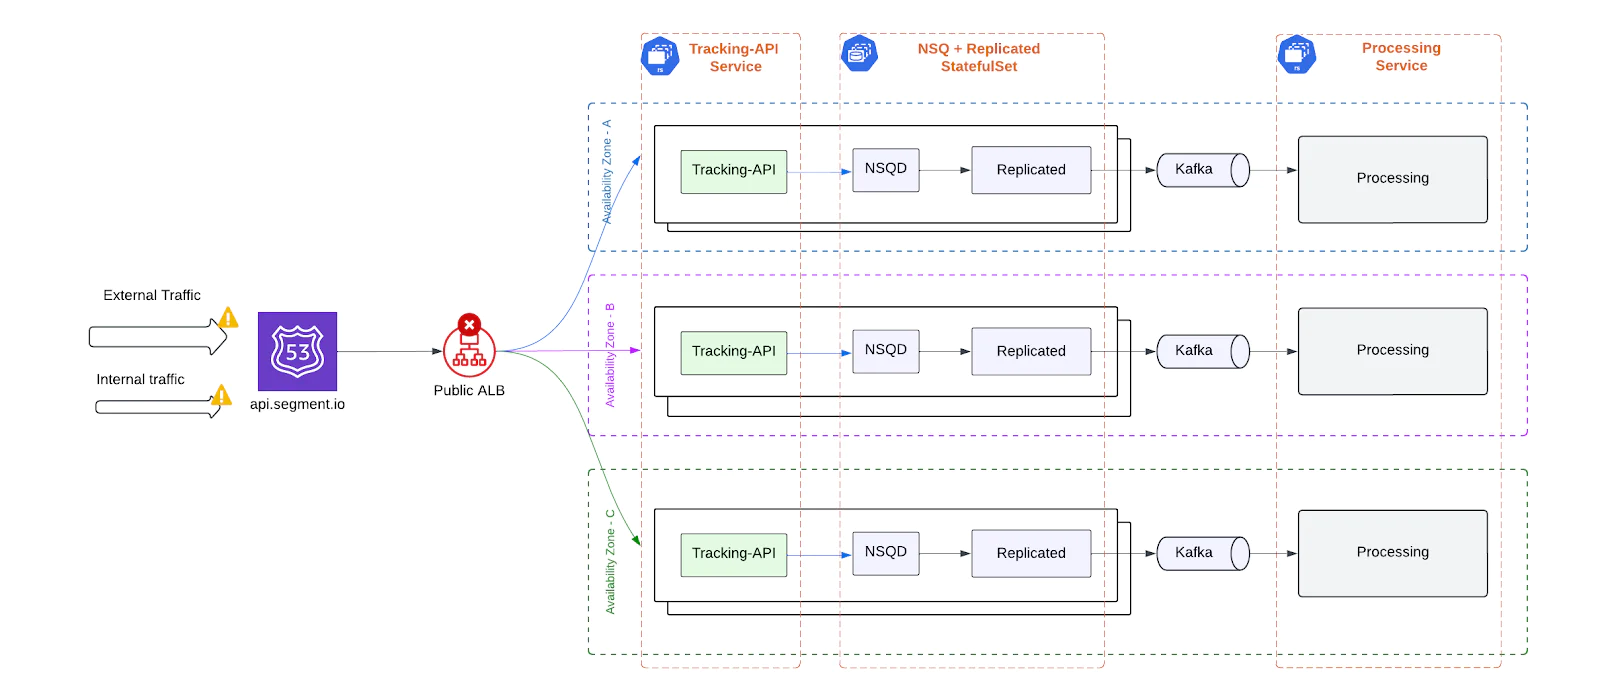
The legacy architecture relied on several centralized components - any of which could single-handedly degrade or disrupt the ingestion pipeline. These included:
Application Load Balancer (ALB)
A single public ALB routed all external client traffic. Despite spanning multiple Availability Zones, this ALB was a critical dependency. DNS misconfigurations, AWS scaling issues, or edge network incidents could take down the entire ingest entry point.

Tracking-API
All traffic was processed by a centralized Tracking-API deployment. A misconfiguration or crash in this layer risked blocking all ingestion.
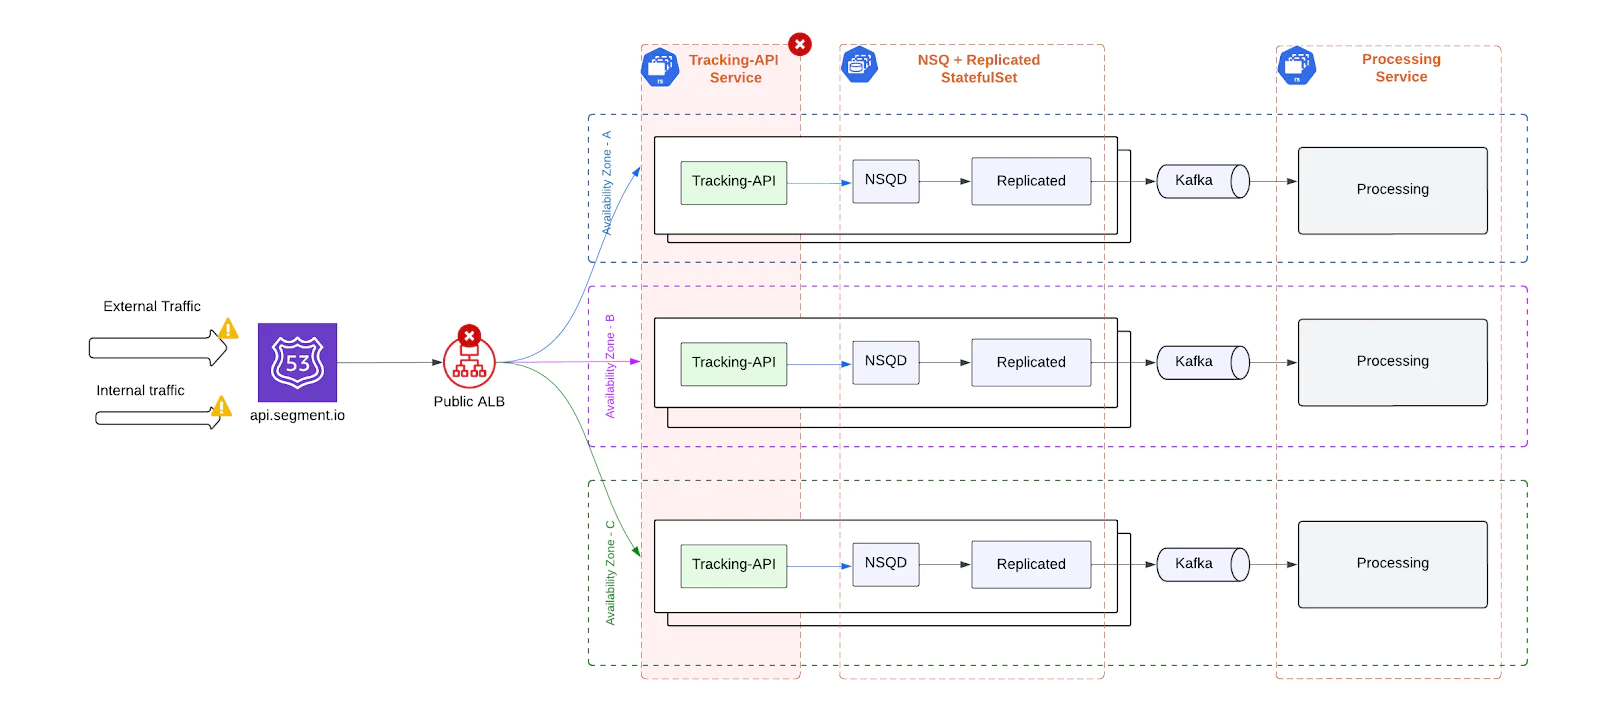

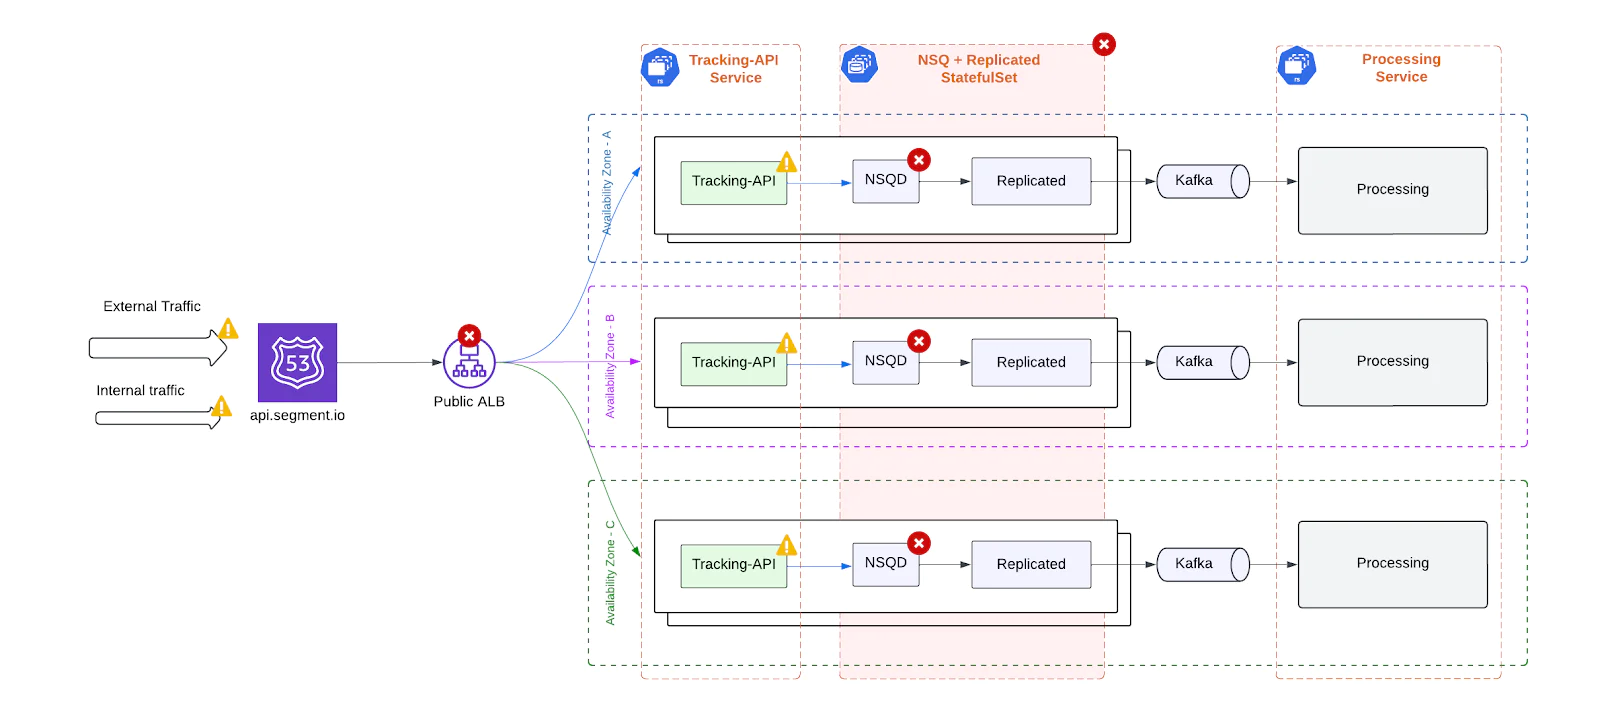
NSQ + Replicated
Each pod ran two tightly coupled containers - NSQD, which buffered events locally, and Replicated, which forwarded them to Kafka. This setup was originally designed to protect against only temporary Kafka outages by enabling short-term local buffering.

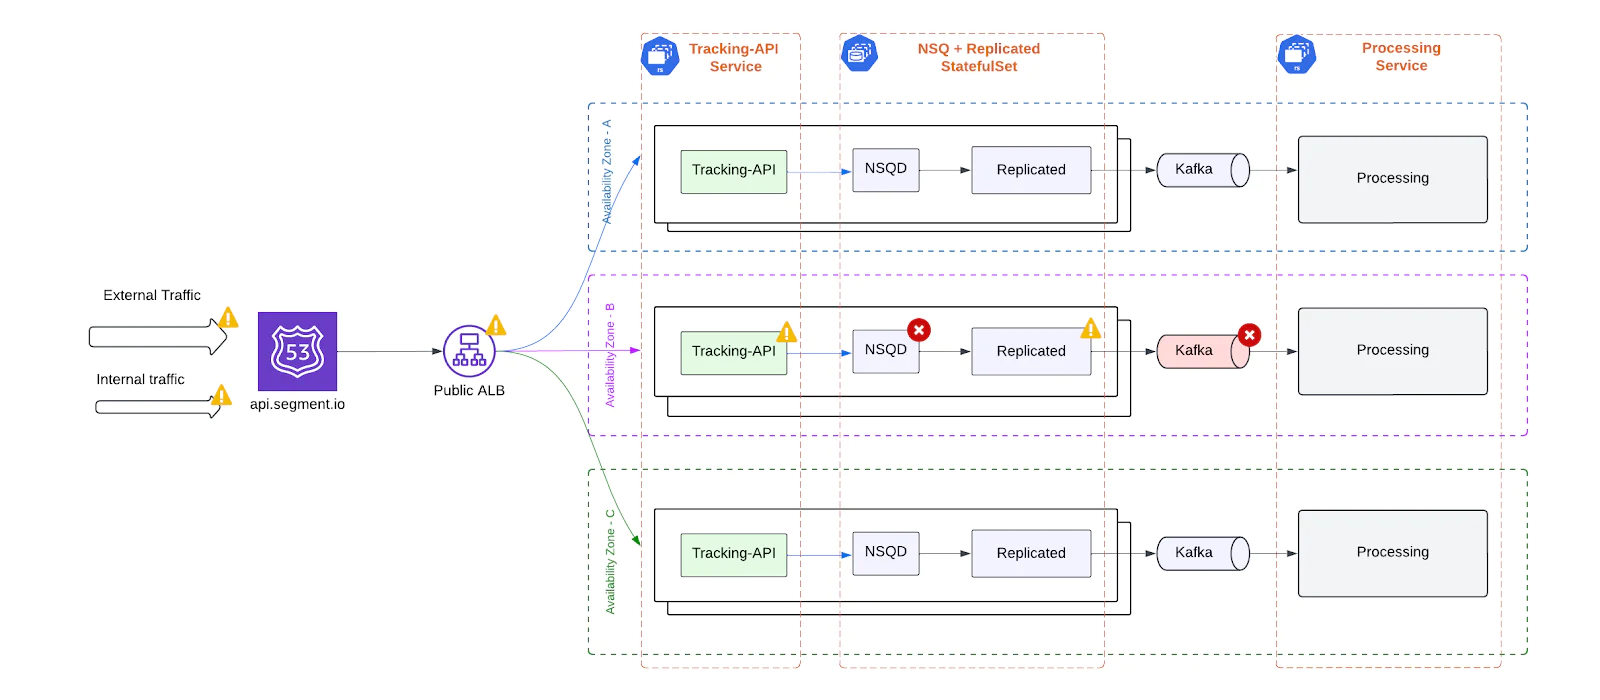
Kafka
Kafka was a single point of coordination downstream. With no automated failover or cross-AZ redundancy, any Kafka outage – whether from broker issues or AZ-level failures – could stall ingestion.

Processing Service
All events flowed through a centralized processing layer. Backlogs or saturation here introduced system-wide ingestion latency or data loss risks.
In short, a failure in any major component – ALB, Tracking-API, NSQ-Replicated, Kafka, or the Processing Service – could trigger cascading outages across the ingestion pipeline. This fragility made the system difficult to operate with high confidence under real-world conditions.
Over-provisioned infrastructure
The Tracking API was designed to handle high traffic volumes, but it lacked dynamic autoscaling due to architectural constraints - particularly its use of NSQ for buffering on each ingest node.
As a result, the system was statically over-provisioned to withstand peak loads, leading to a number of inefficiencies:
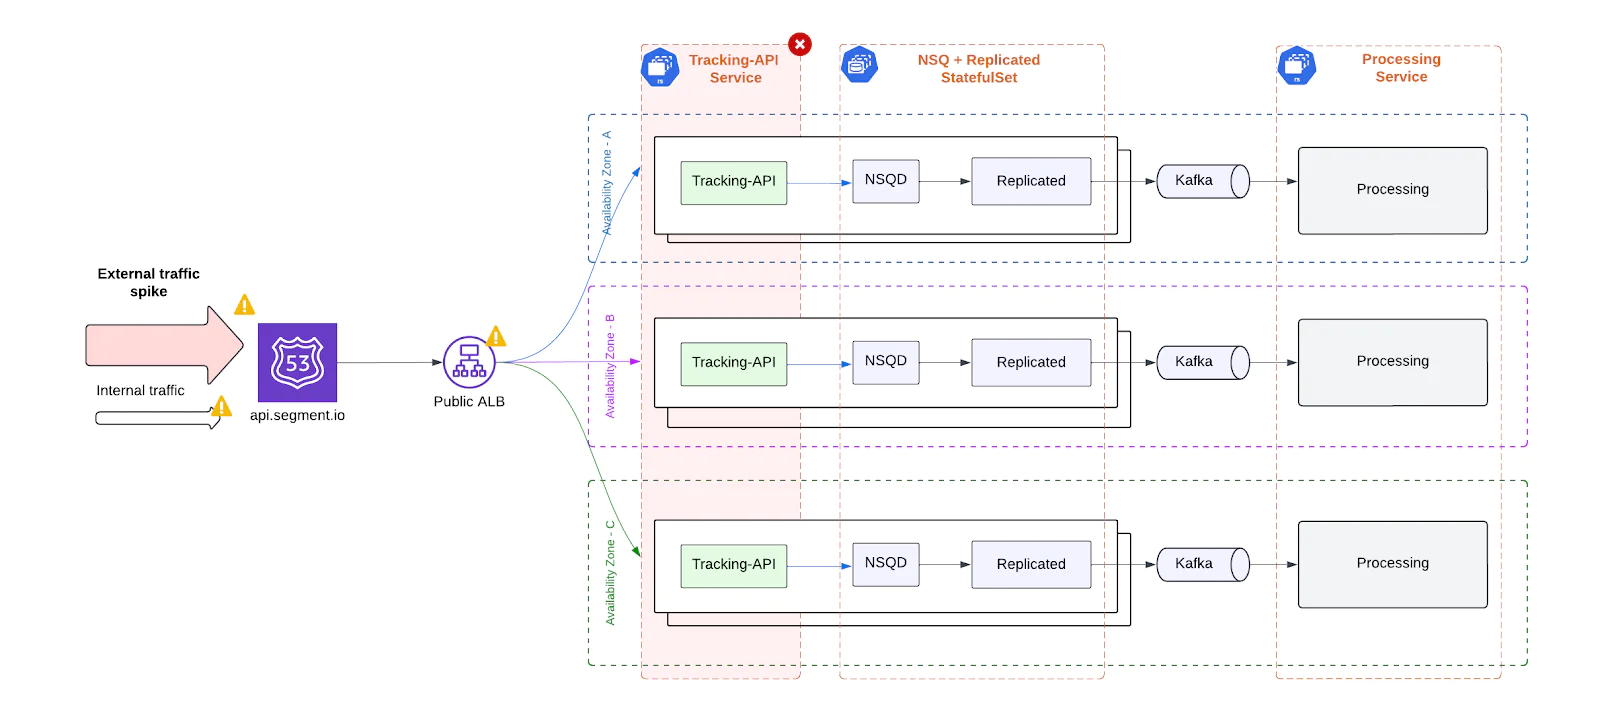

- Static Provisioning: Because NSQ is stateful and node-local, scaling up or down required careful coordination to avoid data loss, which ruled out standard Kubernetes autoscaling techniques.
- Resource Waste: During off-peak periods, large amounts of CPU and memory sat idle, since the infrastructure was always sized for worst-case traffic.
- Scalability Limitations: Spontaneous traffic surges (e.g., a sudden spike from a major event) risked overwhelming the system before humans could scale it manually.
- High Costs: Maintaining a full-capacity fleet 24/7 resulted in significantly higher operational costs.
- Manual Oversight:E ngineers had to coordinate scale-up/down events manually, increasing on-call toil and the risk of error during response.
Without dynamic scaling capabilities, the ingestion system was both operationally rigid and financially inefficient – a key motivation for the architectural overhaul.
No traffic isolation between internal and external events
The legacy architecture handled both external client traffic and internal system-generated trafficthrough the same infrastructure, which created significant reliability and performance risks.
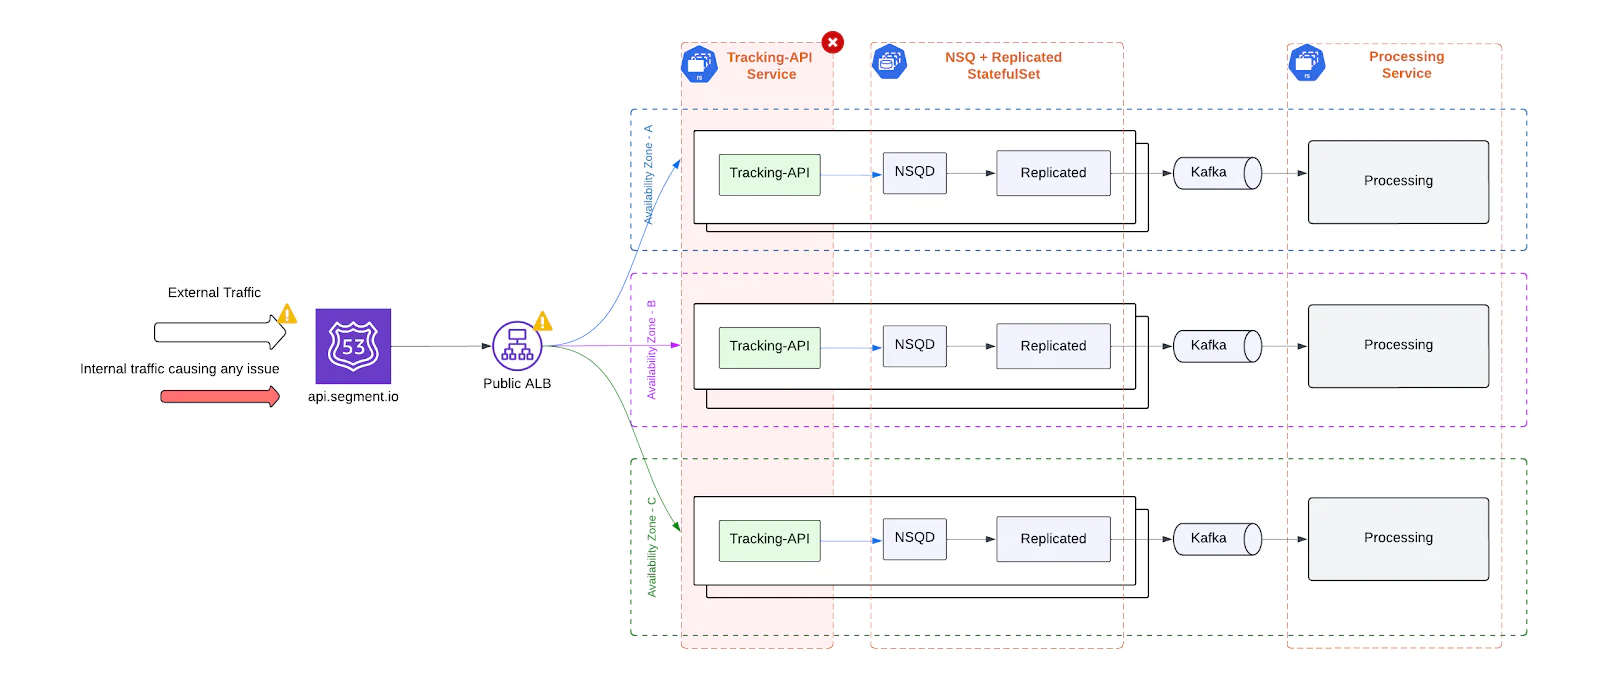

- Coupled Failure Domains: Latency issues or failures in internal services could directly degrade the performance of customer-facing ingestion, even if external traffic was healthy.
- Shared Resource Contention: Internal and external traffic competed for the same compute, memory, and queueing capacity. During periods of high load, this led to unpredictable behavior and degraded throughput across the board.
- Customer Impact from Internal Issues: Even when performance issues originated from within our own systems, end users experienced slower ingestion rates, elevated response times, or outright failures - eroding trust and SLA compliance.
- Downstream Overload and Cascading Failures: Spikes in either traffic type could saturate downstream components (e.g., Kafka, enrichment workers, or data storage systems). With no logical separation or prioritization, these surges could trigger cascading failures or widespread throttling across unrelated workloads.
The absence of traffic segmentation made it impossible to contain problems within a single boundary, turning localized spikes into system-wide reliability risks.
DDoS vulnerability
As the public-facing entry point to Segment’s data pipeline, the Tracking API (TAPI) was an attractive target for Distributed Denial of Service (DDoS) attacks. In its previous form, the system lacked layered defenses to detect, contain, or mitigate malicious traffic – leaving it highly exposed.
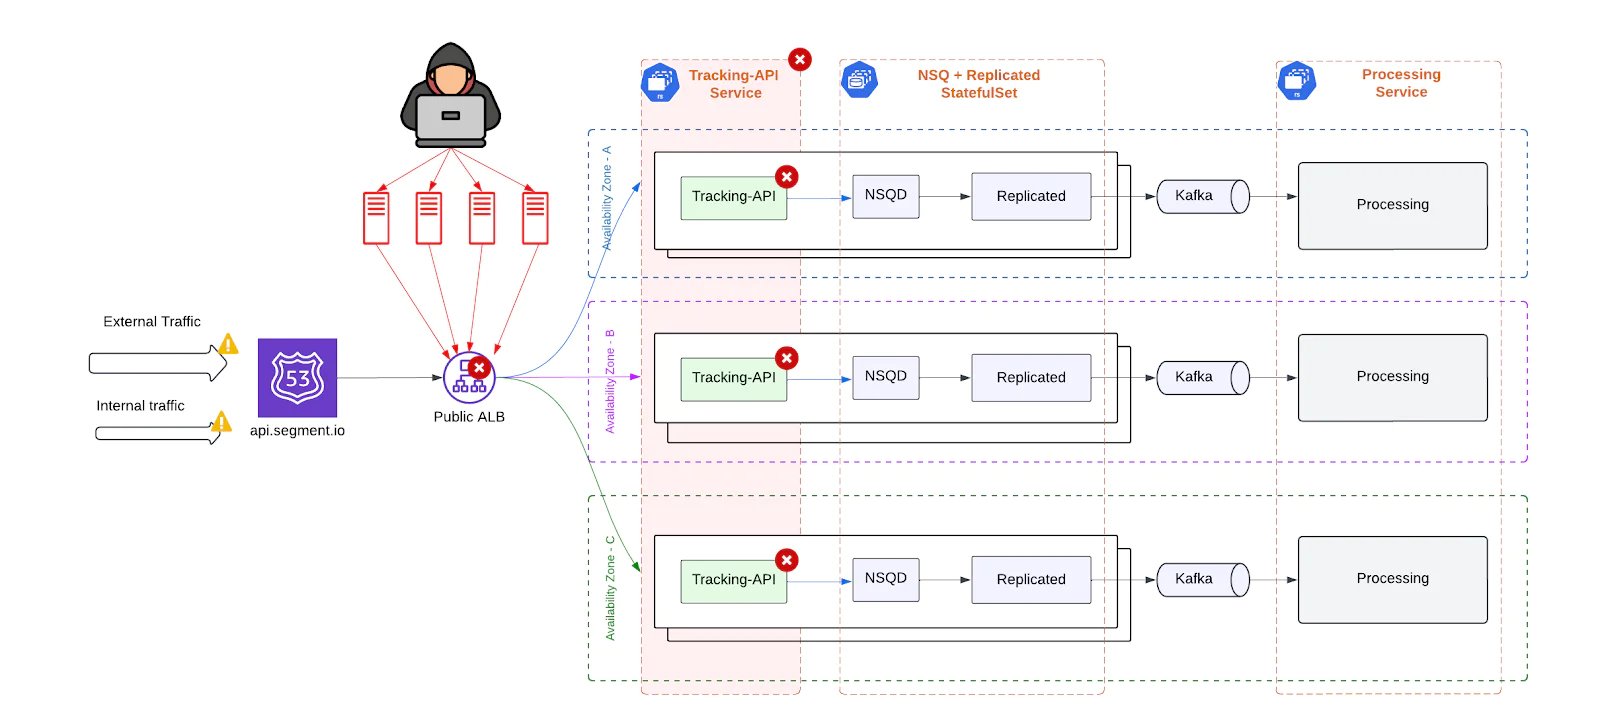

Key risks included:
- Resource Exhaustion: High volumes of spoofed or invalid requests could saturate TAPI’s compute, memory, and network bandwidth, preventing legitimate clients from being served.
- System-Wide Performance Degradation: Even modest attacks could introduce noticeable latency and slowdowns, affecting clients globally due to the centralized nature of the architecture.
- Risk of Full Outages: Large, sustained DDoS events had the potential to bring down the entire ingestion path - especially in the absence of automated mitigation or traffic filtering mechanisms.
- Customer Impact: Without protections in place, client workloads could be severely disrupted during an attack, breaching SLAs and damaging trust.
In short, TAPI’s exposure to volumetric and application-layer attacks posed a serious threat to both the reliability of our platform and the operational stability of our customers.
Operational complexity
Operating the Tracking API on a single, centralized EKS cluster introduced significant operational friction and risk. Even routine changes required extreme caution due to the lack of fault isolation.
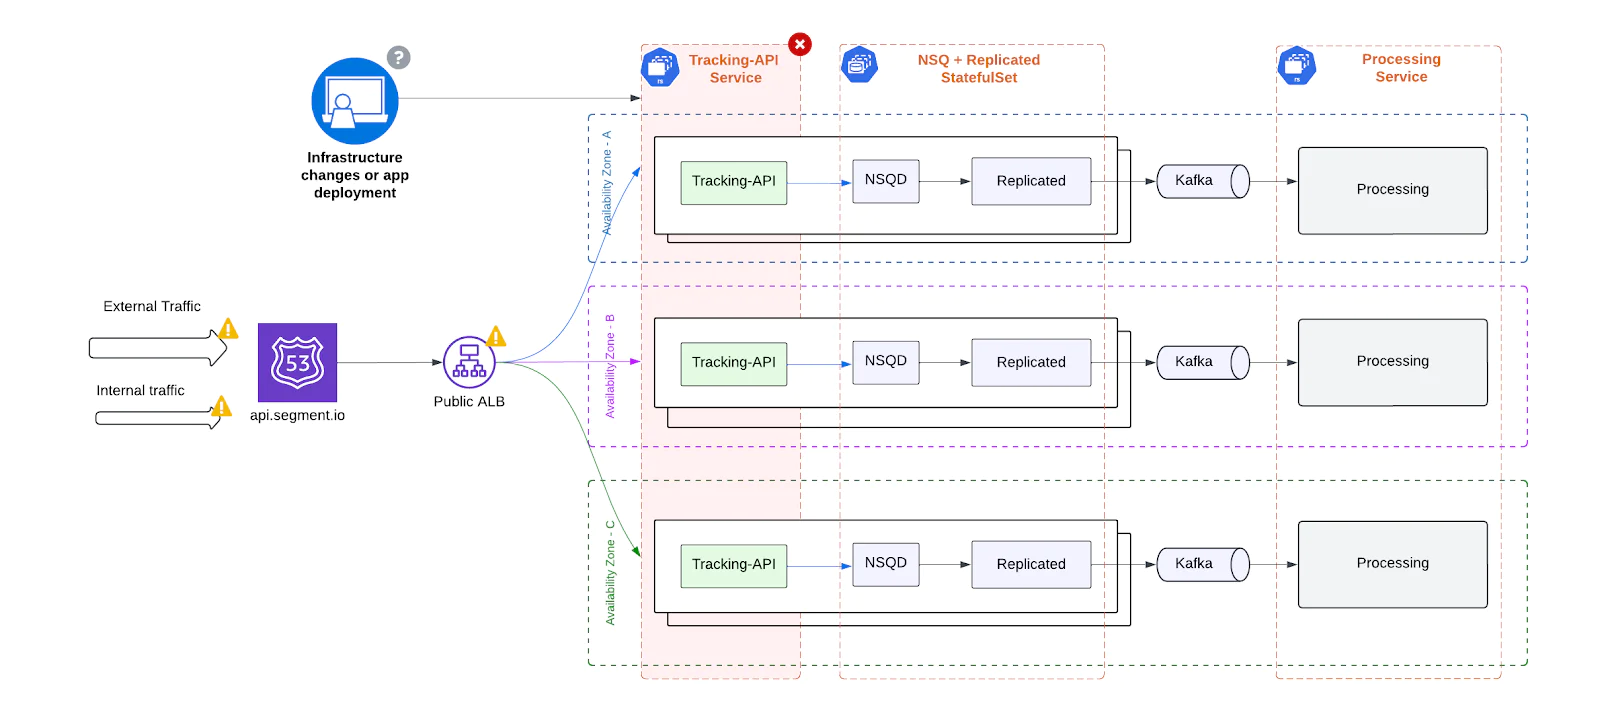

Key challenges included:
- High-Risk Deployments: Any infrastructure change – whether updating compute resources, deploying a new container image, or modifying environment variables – could inadvertently affect the entire ingestion fleet. A simple misconfiguration or failed rollout had the potential to cause a partial or full service outage.
- Lack of Infrastructure Isolation: There was no way to scope or contain changes to a specific segment of traffic or subset of nodes. Every deployment or scaling operation applied cluster-wide, impacting all clients regardless of their workload profile.
- Scaling Bottlenecks: Adding capacity to handle traffic spikes or provisioning new services required manual coordination, pre-scaling, and tight timing. This led to:
- Inefficient resource usage during normal loads
- Delayed responsiveness during peak demand
- Operational Overhead: On-call engineers had to tread carefully, often deploying during maintenance windows or avoiding changes during high-traffic hours, just to minimize the blast radius of routine tasks.
The absence of granular isolation and self-healing primitives made the system operationally fragile and expensive to manage.
Dynamic ALB IPs and DNS caching issues
While AWS Application Load Balancers (ALBs) offered seamless traffic distribution and zone-level redundancy, they came with a critical operational limitation: non-static IP addresses. This created downstream reliability issues for client environments - especially those with rigid or legacy DNS handling.
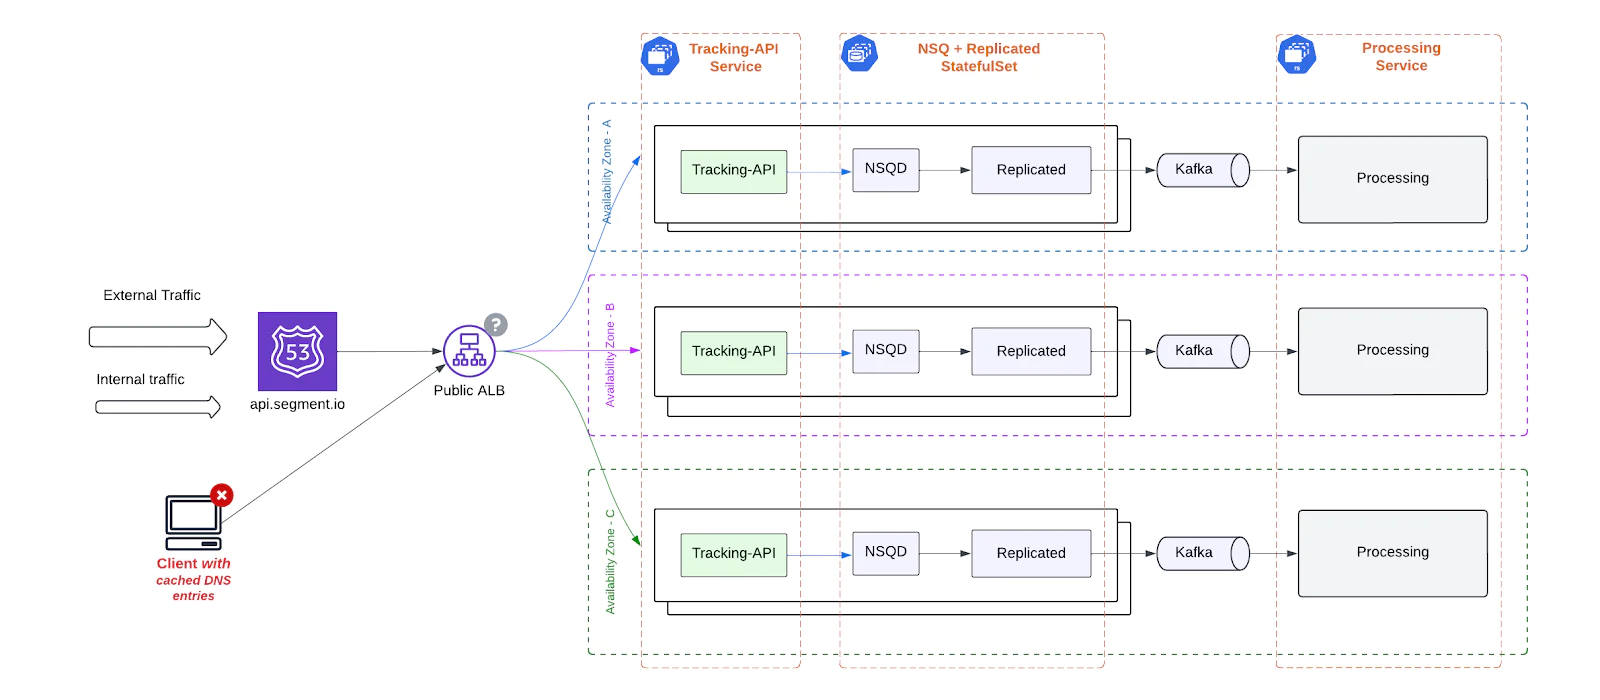

Key problems included:
- DNS Caching and Connection Failures: Many client applications cache DNS entries to reduce lookup overhead. However, when ALB IPs changed ( which happens frequently in AWS), these clients continued to use stale IPs, leading to dropped connections and failed requests until the cache expired and a new DNS resolution occurred.
- Latency and Reconnection Delays: Cached but invalid IPs lead to timeouts or delayed TCP reconnects, introducing unpredictable spikes in end-to-end event delivery latency - especially problematic for time-sensitive analytics and user behavior tracking.
- Legacy System Incompatibility: Clients running on legacy infrastructure, mobile SDKs, or in constrained environments (such as embedded devices or private networks) often had hardcoded DNS TTLs or lacked the ability to honor DNS changes. These clients were disproportionately affected, facing sustained connectivity issues when ALB IPs rotated.
- Reliability Degradation at the Edge: Because this issue occurred at the client-network boundary, it was difficult to detect centrally and often manifested as intermittent failures, making it harder to debug or correlate with backend changes.
In summary, TAPI’s dependency on dynamic ALB IPs introduced a class of network instability that directly impacted ingestion reliability for a subset of clients - particularly those unable to handle DNS churn gracefully.
Solutions: Rebuilding the ingestion stack
To address these shortcomings, we undertook a large-scale re-architecture of TAPI. The focus areas were resilience, modularity, cost-efficiency, and traffic isolation.
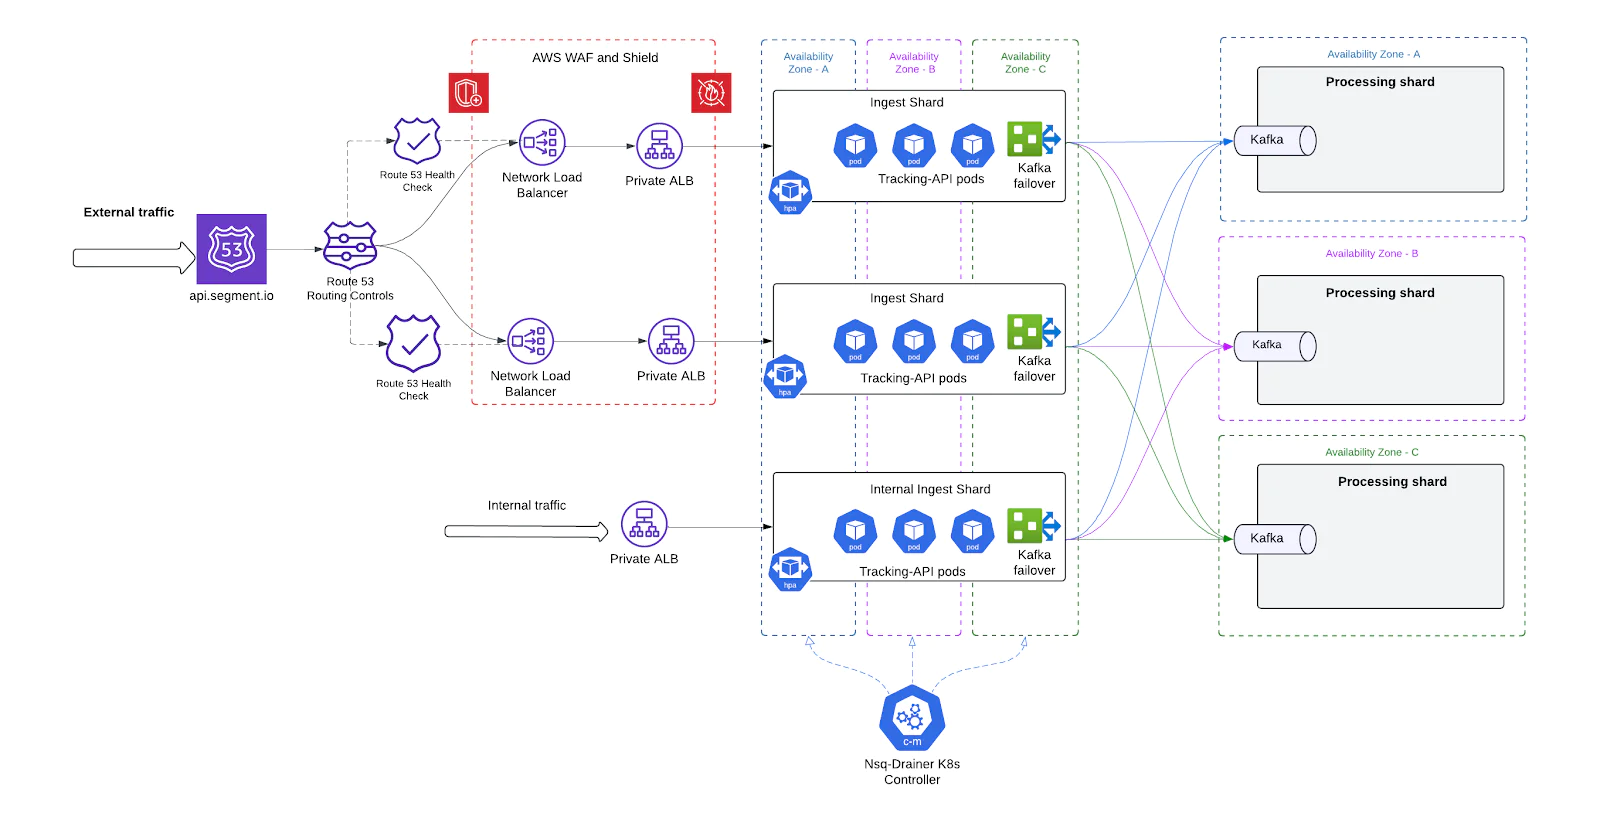

Autoscaling with NSQ and replicated separation
To support dynamic scaling and reduce operational friction, we restructured how NSQ and Replicated are deployed. Instead of running both components in a tightly coupled StatefulSet, we split them into two independent DaemonSets. This decoupling allowed us to scale each component independently and laid the foundation for autoscaling based on real-time demand.
We also developed a custom Kubernetes controller called Nsq-Drainer, which ensures safe draining of in-flight messages during pod termination or scaling events, eliminating the risk of data loss during rolling updates or shard resizes.
How it works
Separate DaemonSets per Role
- NSQD runs as a DaemonSet that buffers events on disk from the Tracking API.
- Replicated runs as a separate DaemonSet that reads messages from the local NSQD and sends them to Kafka.
- This split allows each to scale independently, tuned to its own workload and performance needs.
Autoscaling Support


- Tracking API and Replicated pods now support Kubernetes Horizontal Pod Autoscaling (HPA).
- Pods scale based on CPU, memory, or custom metrics such as queue depth or Kafka publishing latency.
- No manual coordination is needed between the Tracking API and downstream components.
Safe draining with Nsq-Drainer
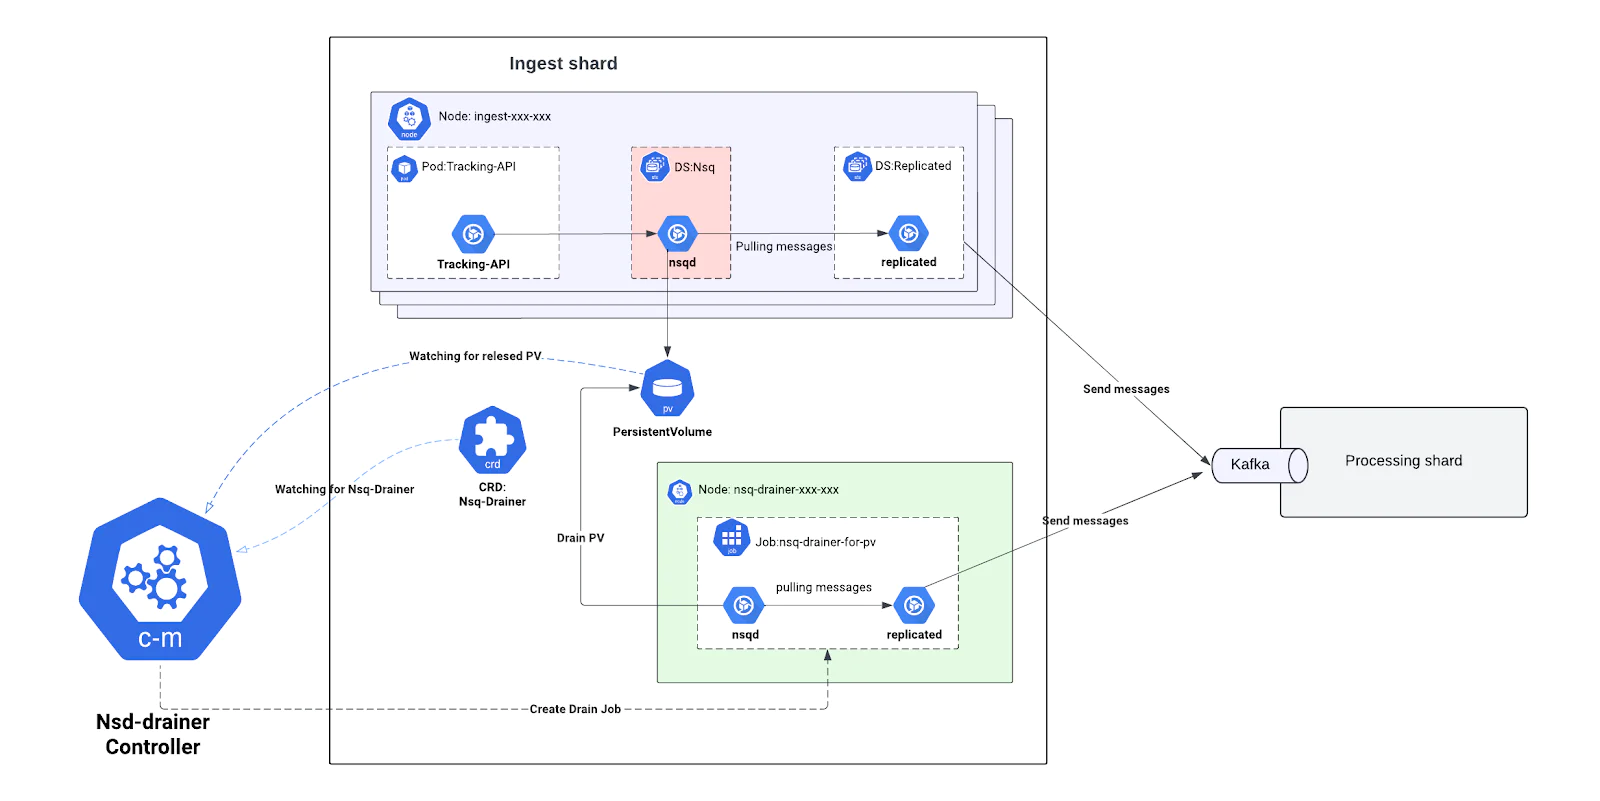

- On pod shutdown (due to scaling or rolling updates), the Nsq-Drainermonitors NSQD Persistent Volume ( PV ) during PV lifecycle events:
- Creates
NSQ-Drainer CRDto block PV termination and re-attachment. - Creates drain Job for released PV
- Waits until all messages are successfully delivered to Kafka.
- Only after all of those steps does it terminate PV, ensuring zero data loss during node churn.
Dynamic Configuration via ConfigMaps
The Replicated now consumes configuration (e.g., routing rules, Kafka topics) from Kubernetes ConfigMaps, enabling:
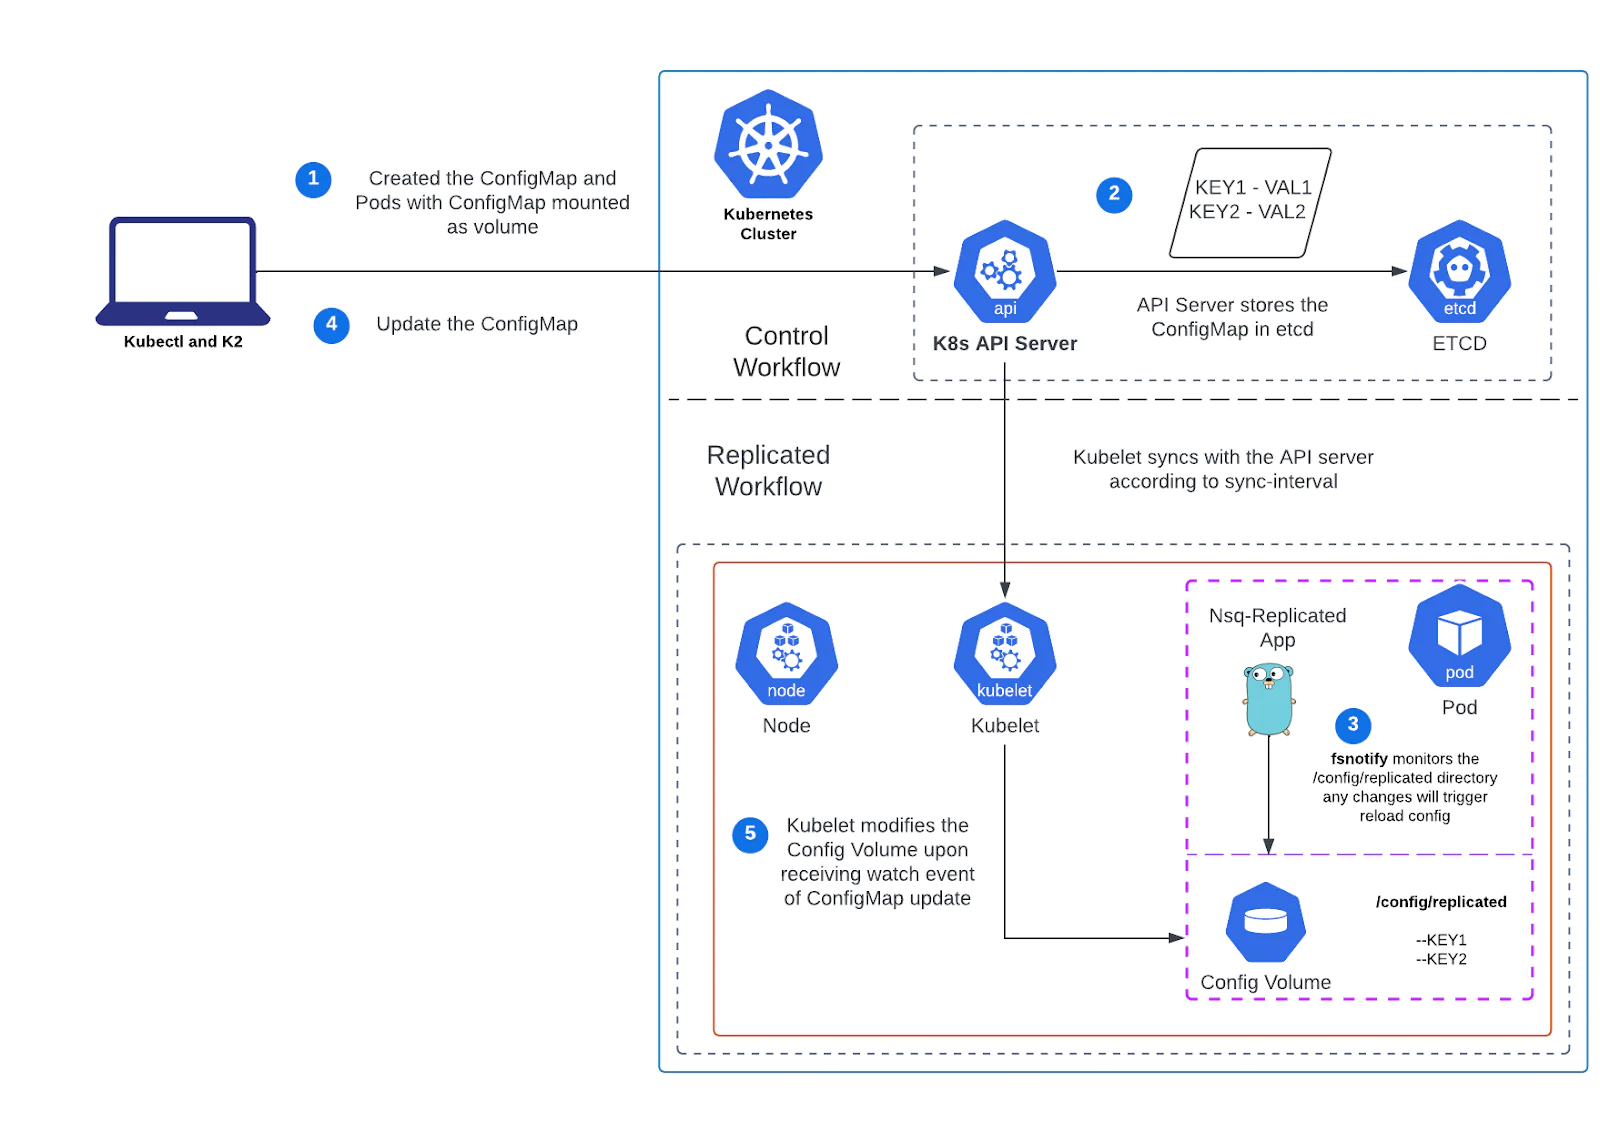

- Live updates to routing logic without redeploying pods.
- Real-time shard rebalancing and Kafka redirection during outages.
These improvements unlocked the ability to autoscale ingestion workloads safely, reduce human intervention, and maintain durability guarantees even during dynamic infrastructure changes.
Shard-Based ingest architecture
A core architectural shift in our overhaul was the move from a single monolithic ingest system to a shard-based ingest architecture. This allowed us to partition traffic, scale independently, and limit the blast radius of failures drastically improving performance and operational flexibility.
Why shard?
Previously, all ingestion traffic regardless of source, priority, or client type - flowed through the same infrastructure. This meant:
- No ability to isolate workloads.
- One misbehaving client could impact everyone.
- System-wide scaling or failure recovery became slow and error-prone.
By introducing shards, we effectively split the ingest infrastructure into multiple self-contained units, each capable of independently handling a portion of the total traffic.
How we implemented it
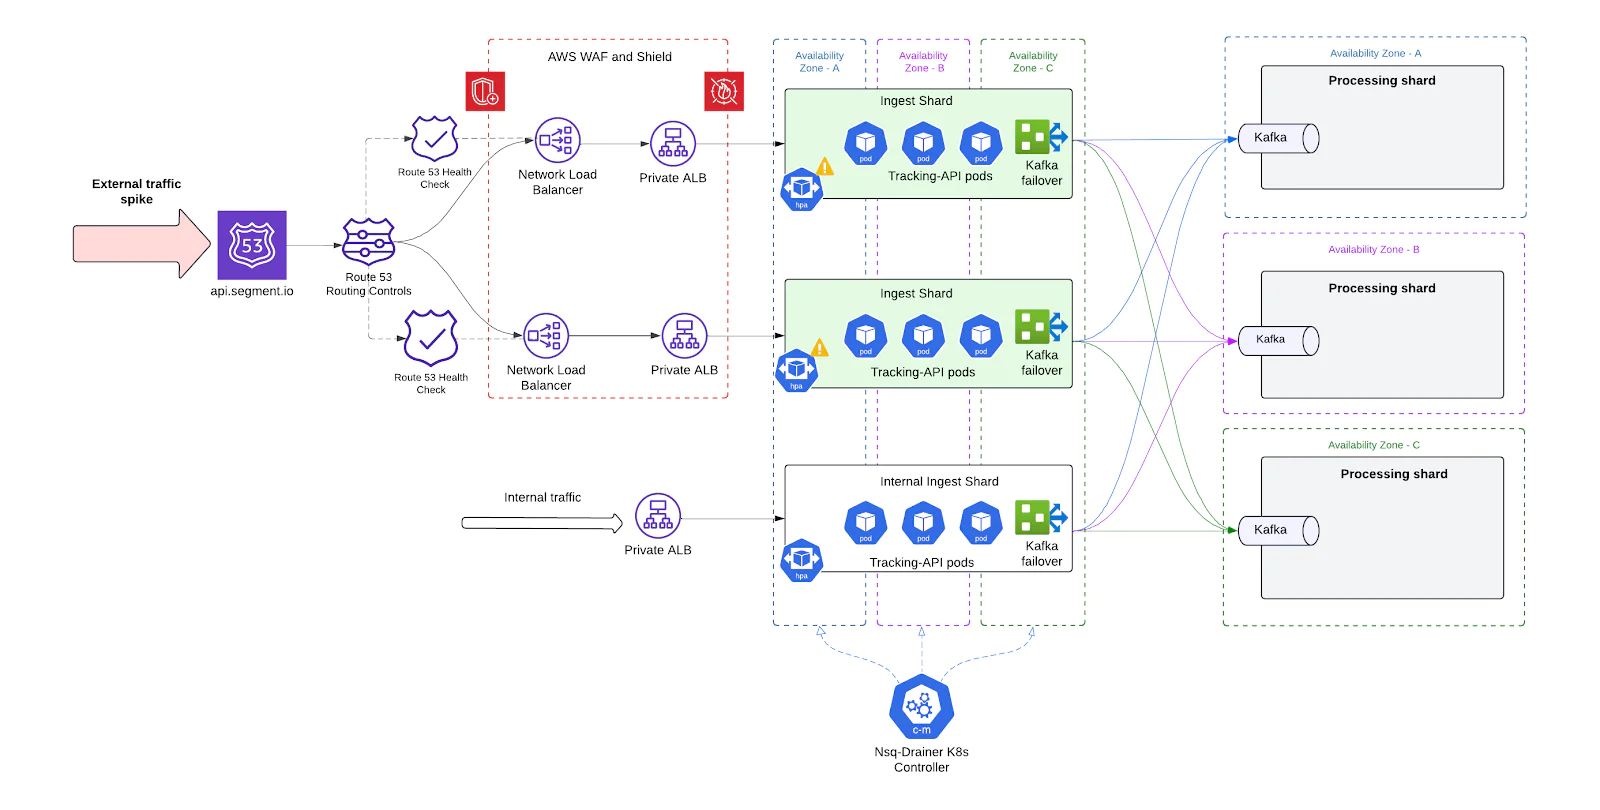

- Each shard is a fully independent pipeline, consisting of:
- A unique ALB fronting that shard
- Its own Tracking-API Deployment
- Co-located NSQD and Replicated DaemonSets
- Separate Kafka cluster routes
- Independent Processing shards
- Shards serve as independent units of scale, each fronted by its own ALB. This design allows the system to scale in two dimensions:
- Horizontally by manually adding new shards, each with its own dedicated infrastructure and ALB. This increases total system throughput and provides additional fault isolation boundaries.
- Vertically by autoscaling resources within each shard based on the load observed through its ALB. Pod-level CPU, memory, drive dynamic tuning of each shard's capacity in real time.
This two-layered model decouples global provisioning from traffic spikes, ensures more predictable scaling behavior, and gives fine-grained control over where and how resources are applied across the ingest fleet.
Reduced blast radius
One of the most critical advantages of this architecture is the reduction in blast radius:
- A failure in a single shard - whether due to pod crashes, Kafka unavailability, or configuration mistakes - does not affect other shards.
- Operational tasks like rolling updates or hotfix deployments can be performed one shard at a time, reducing deployment risk and improving uptime.
- We can quarantine or redirect traffic from unhealthy shards without requiring full system intervention.
This shard-level isolation enables safer experimentation, more predictable incident response, and faster recovery during partial outages.
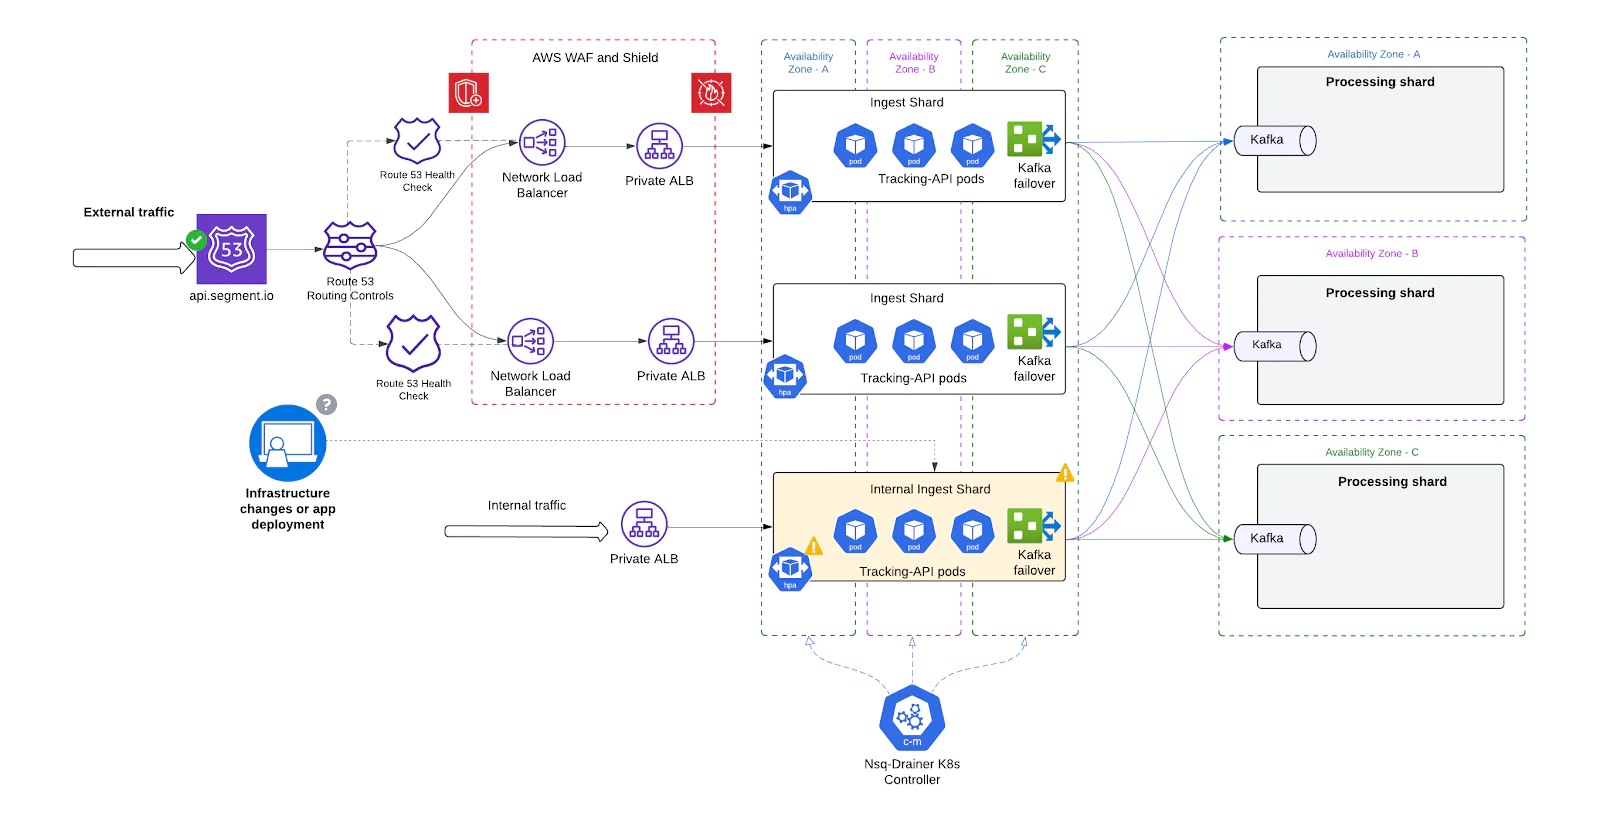

In short, the shard-based model transformed a fragile monolith into a resilient, modular ingest system - laying the foundation for all future scalability and reliability improvements.
Shard-Level failover via DNS
With the introduction of independent ingest shards, we needed a reliable and automated way to detect failures at the shard level and redirect traffic away from unhealthy shards. To achieve this, we implemented DNS-based failover using Amazon Route 53 health checks - providing seamless, zero-touch resilience.
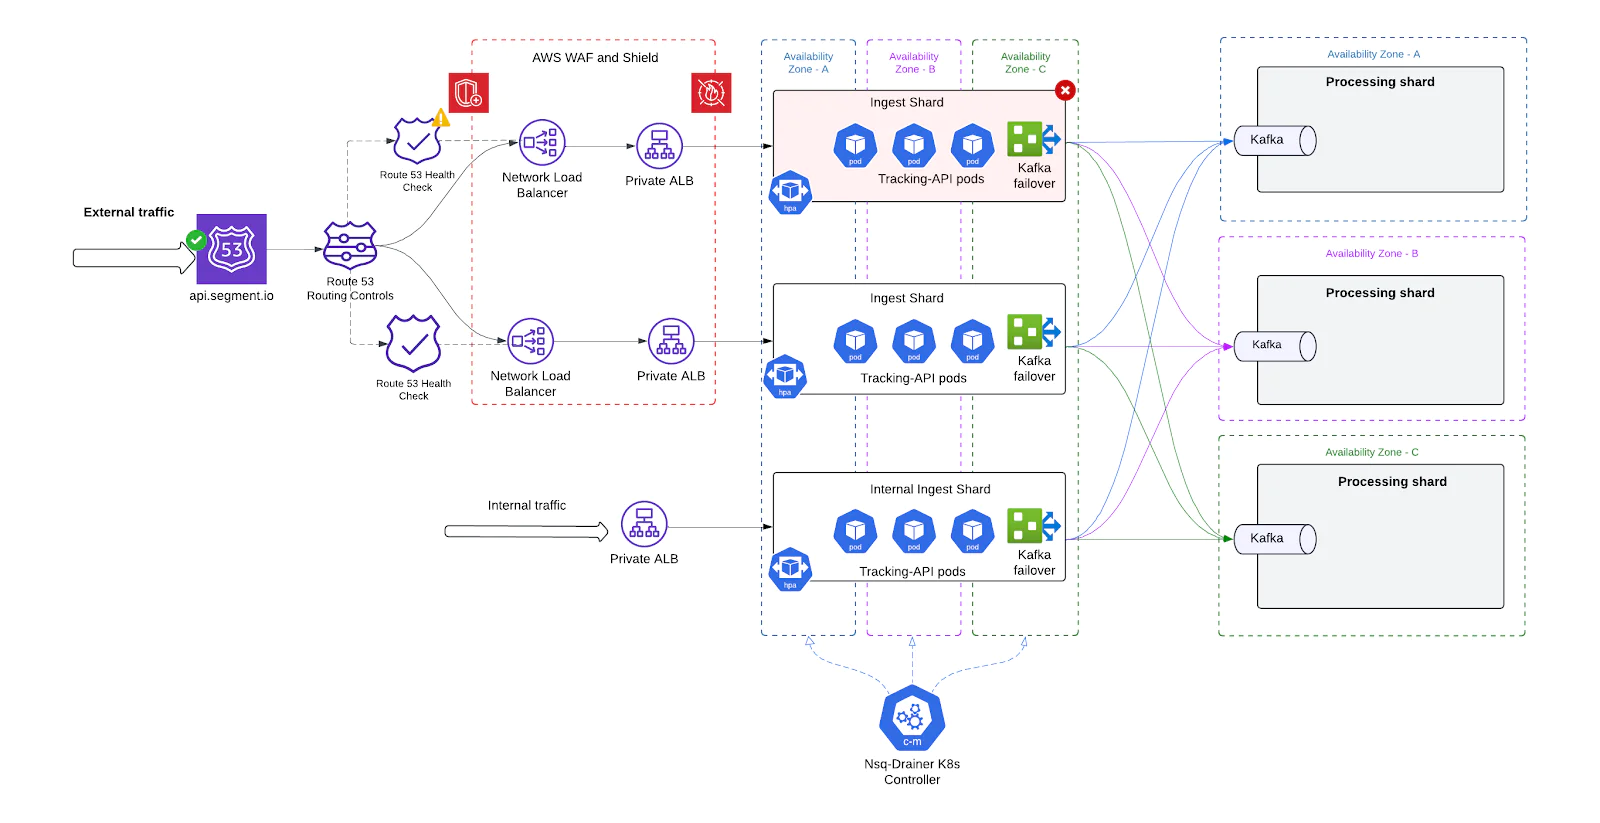

How it works
- One NLB + ALB per shard Each ingest shard is fronted by its own Network Load Balance (NLB) for stable IPs + Application Load Balancer (ALB). This ensures that failures or scaling issues in one shard are isolated at the ingress level.
- Static DNS Records for Shards Every shard NLB is associated with a unique DNS record in Route 53, grouped under a shared domain.
- Route 53 Health Checks For each shard’s DNS record, we define a health check targeting that shard’s ALB endpoint. These checks periodically evaluate the health of the underlying infrastructure by:
- Sending HTTP probes to a healthcheck path
- Verifying status codes and response times
- Checking from multiple global regions to detect partial outages
- Automatic DNS Failover If a shard fails its health checks (e.g., due to a bad deployment, Kafka outage, or ALB degradation), Route 53 automatically:
- Removes that shard’s NLB from DNS rotation
- Redirects traffic to healthy shards still in service
This DNS-level failover happens in real-time and without manual intervention, allowing us to maintain availability even during partial failures or rolling restarts.
Enhanced DDoS protection
As the public-facing entry point to Segment’s infrastructure, the Tracking API (TAPI) is inherently exposed to malicious traffic, volumetric abuse, and misconfigured clients. With our legacy architecture, TAPI lacked layered defenses - making it vulnerable to overloads that could threaten availability for all customers.
To address this, we implemented a multi-tiered DDoS protection strategy, combining AWS-native services with application-level safeguards to detect, throttle, and absorb abusive traffic without degrading service for legitimate users.
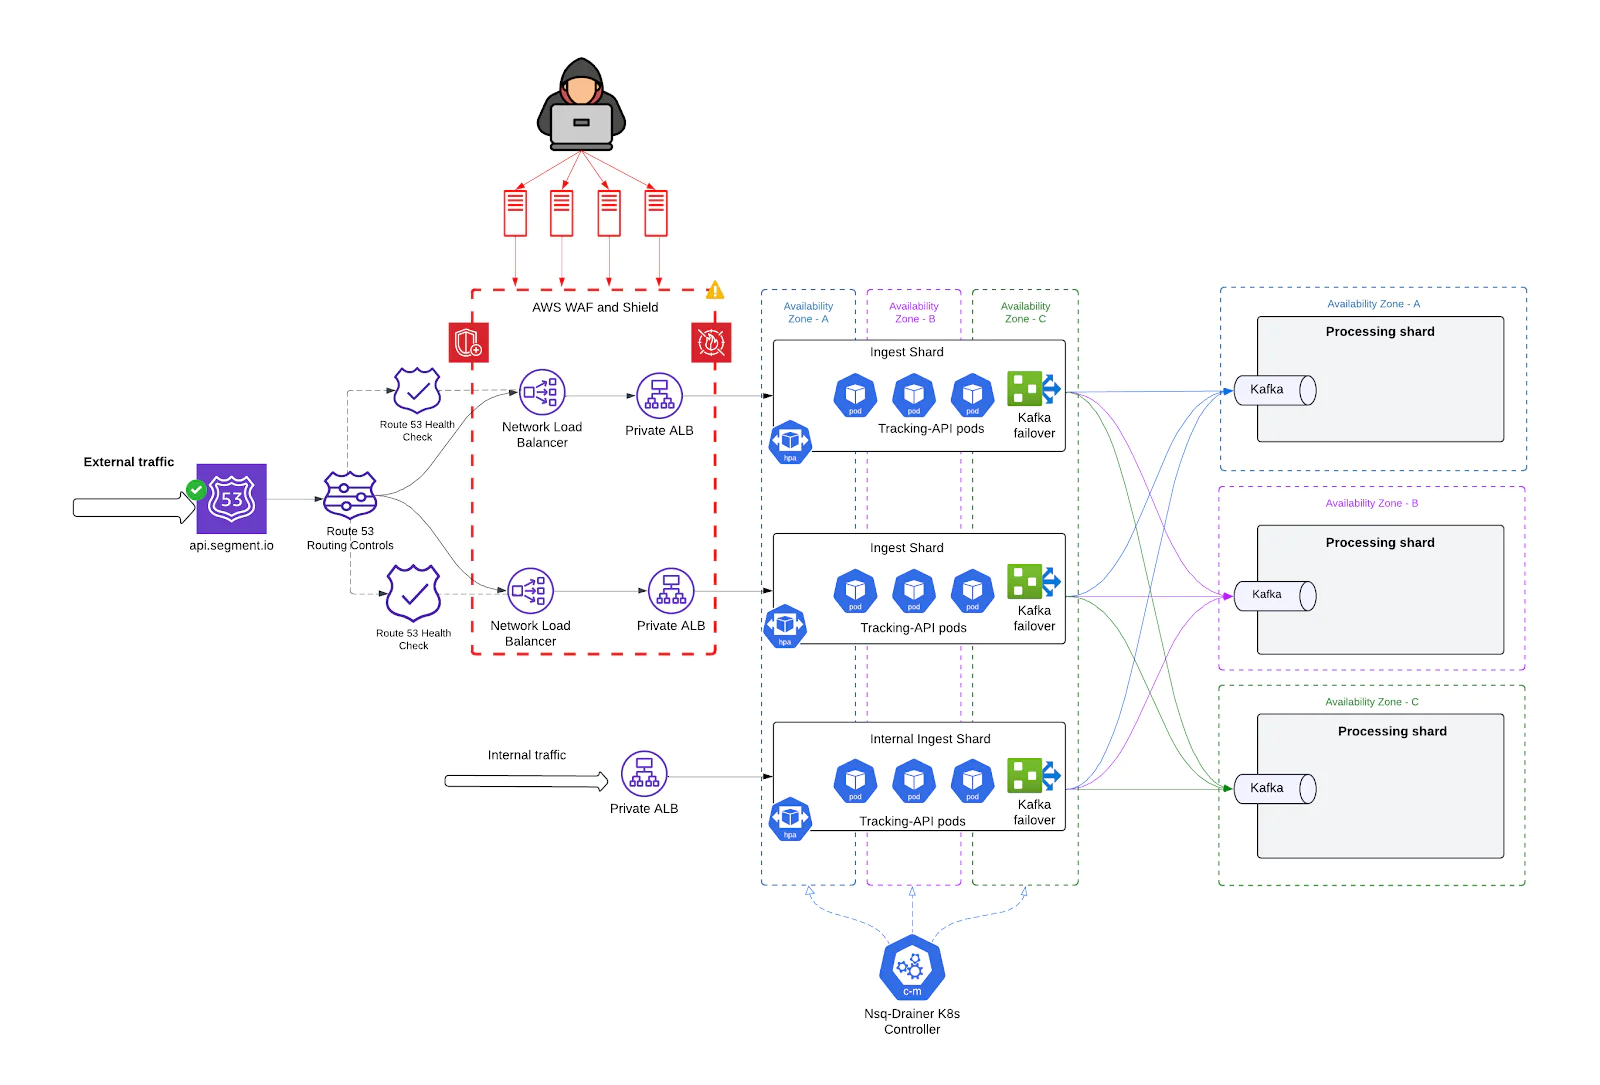

Layer 1: Network and Transport-Level protection
- AWS Shield Advanced Integrated with our public-facing Network Load Balancers (NLBs), AWS Shield Advanced provides automatic detection and mitigation for common network-layer DDoS attacks, such as:
- User Datagram Protocol (UDP) reflection attacks
- TCP SYN flood
- DNS query flood
- HTTP flood/cache-busting (layer 7) attacks
- It monitors for traffic anomalies, blocks known attack vectors at the edge, and gives us detailed forensic reports for incident analysis.
Layer 2: HTTP Request filtering
- AWS Web Application Firewall (WAF) Deployed at the ALB layer, AWS WAF protects against malformed, abusive, or malicious HTTP request patterns:
- We also maintain a set of custom rules to block specific botnets or misbehaving SDK versions, and rate-limit any traffic that appears abnormal.
Layer 3: Application-Level rate limiting
- To protect individual pods from being overwhelmed by sudden traffic bursts—especially during scale-up delays or cold starts—we implemented lightweight, pod-local rate limiting inside the Tracking API application itself.
By combining network-level defense (Shield), edge filtering (WAF), and application-level rate limiting, we built a defense-in-depth posture that has already helped us withstand real-world attacks and large-scale misuse - without sacrificing customer experience or uptime.
Static IP support and improved routing
To address long-standing issues with dynamic ALB IPs and improve compatibility with client environments that rely on IP-based routing or rigid DNS behavior, we introduced a new networking layer combining AWS Network Load Balancers (NLBs) and private ALBs. This design gave us static ingress points, tighter network control, and a cleaner separation of public and internal routing.
What we built
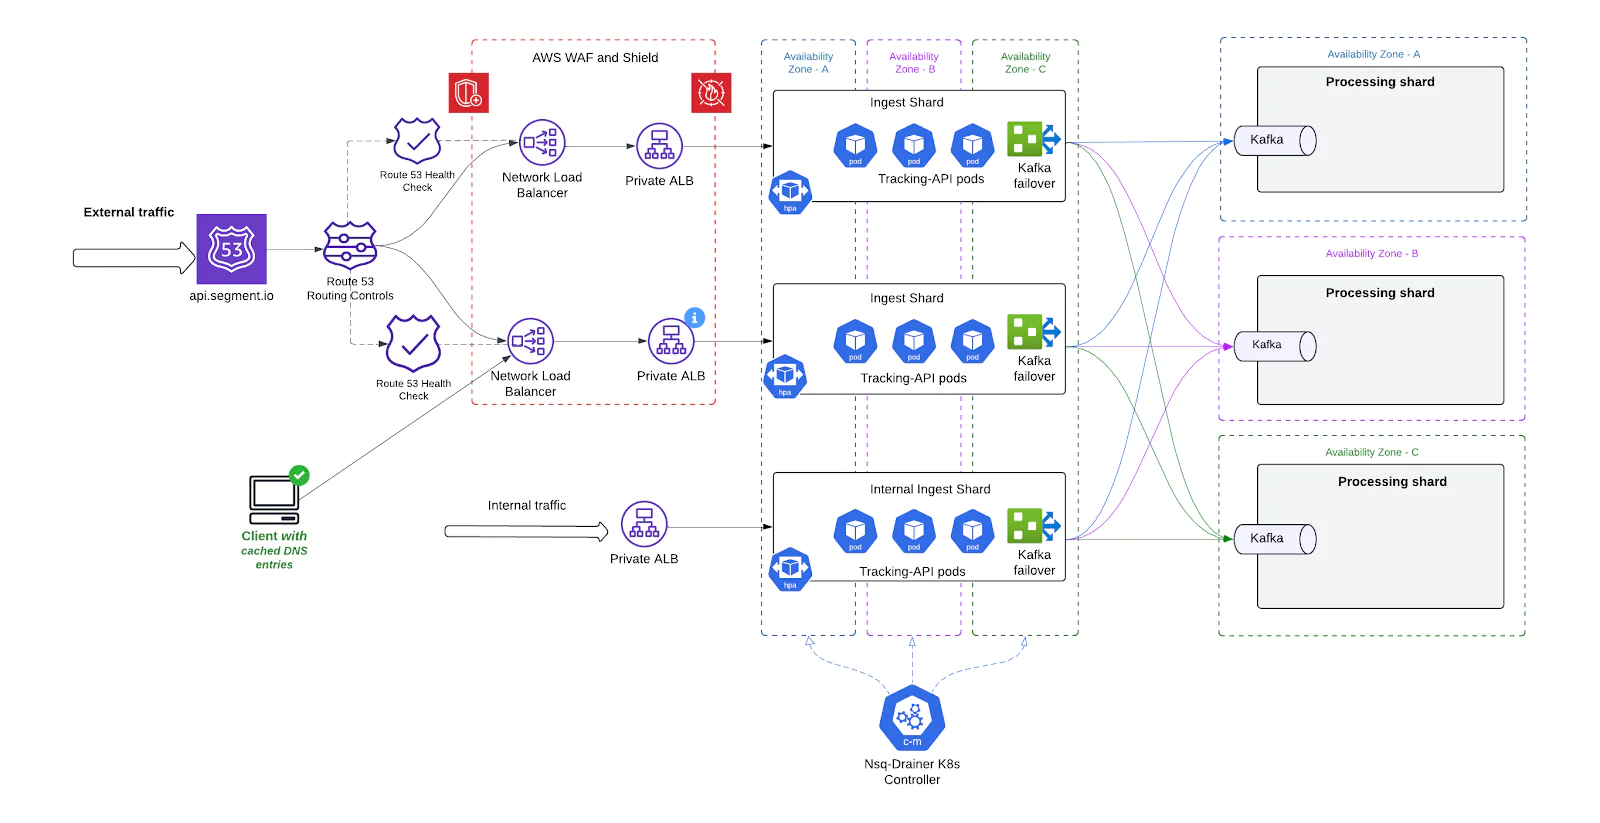

- Public-Facing NLBs with Static IPs We deployed AWS Network Load Balancers (NLBs)in front of each shard's ALB. NLBs:
- Support static IP addresses per AZ
- Provide TCP-level passthrough to backends with minimal latency
- Private ALBs Behind NLBs Each shard’s ALB was converted to private, serving only internal traffic routed from the NLB. This allowed us to:
- Lock down ALB access to only known, secured entry points
- Simplify WAF, Shield, and access control policies
- Prevent accidental or malicious direct access to ALBs
This upgrade resolved a critical source of flakiness for client SDKs, data pipelines, and integrations - especially important in regulated industries or locked-down networks.
Kafka failover support
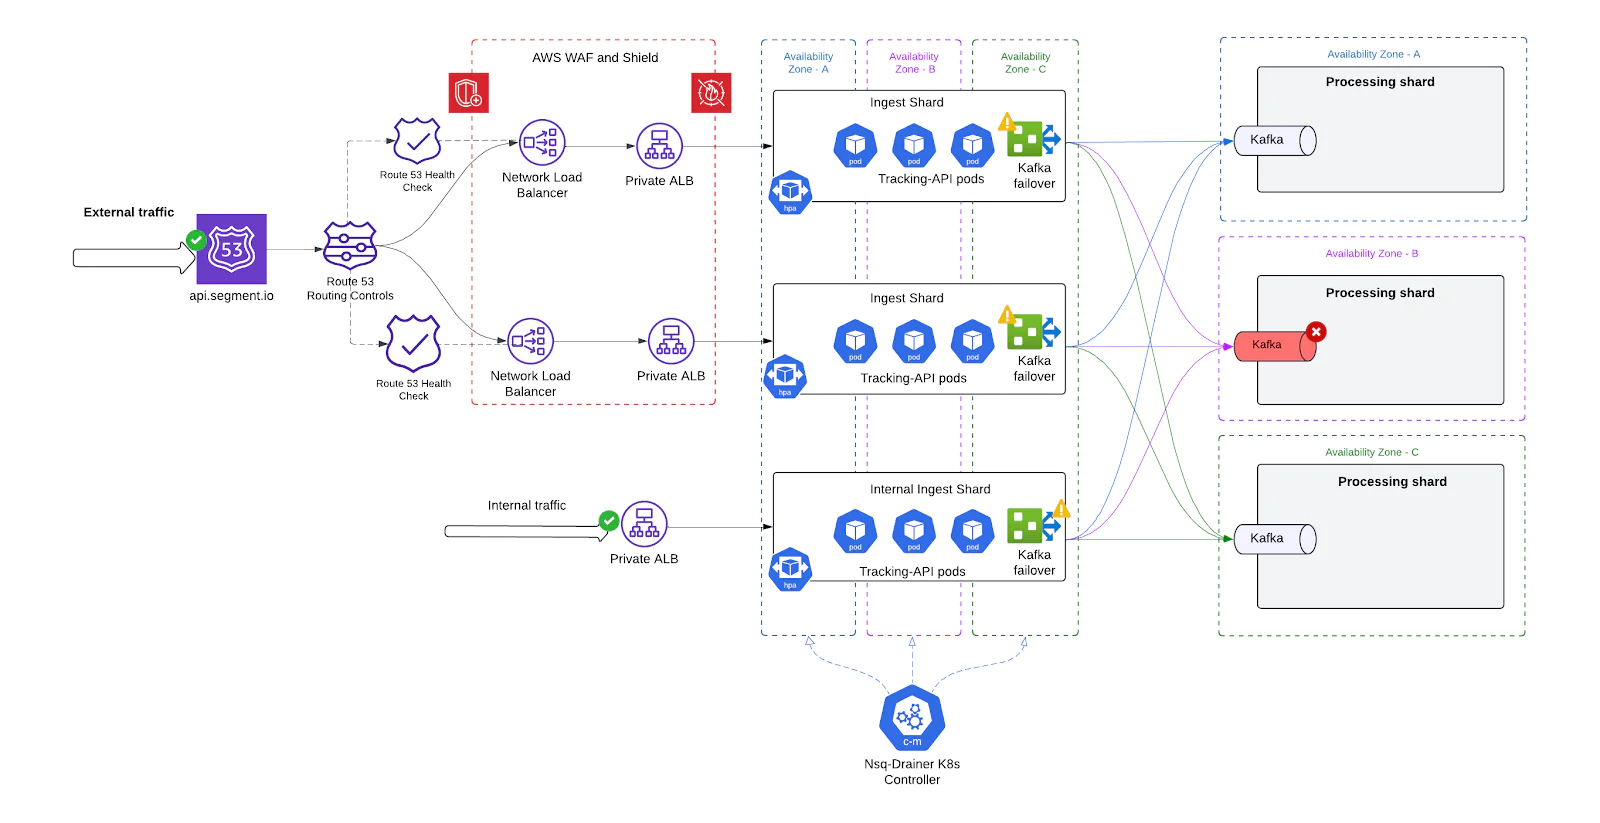
Kafka is a critical component in our event ingestion pipeline, acting as the backbone for buffering, fan-out, and downstream processing. In the original architecture, each Tracking API shard was tightly coupled to a single Kafka cluster, introducing a significant single point of failure. Any outage, whether due to a broker crash, network partition, or AZ-wide issue, could block ingestion, even if TAPI and NSQ remained healthy.
To address this, we introduced multi-tier Kafka failover capabilities, allowing each ingest shard to detect failures and reroute traffic dynamically to alternative Kafka clusters—ensuring end-to-end delivery continuity even during infrastructure disruptions.

How it works
Primary and Secondary Kafka Clusters per Shard.
Each ingest shard is configured with a primary Kafka cluster and one or more fallback clusters within the same or alternate availability zones (AZs). This allows:Local failover during broker unavailability or Zookeeper instability.
Cross-AZ rerouting in the event of a zone-level or networking failure.
Dynamic Kafka Routing in Replicated.
The Replicated service, which consumes from NSQ and publishes to Kafka, was enhanced to:Monitor Kafka broker health via internal metrics.
Switch to a secondary Kafka route in real-time if the primary route degrades beyond configured thresholds.
Revert traffic back to the primary cluster once it recovers-without requiring restarts or deployments.
Health-Aware Configuration via Kubernetes ConfigMaps
Kafka routing logic is now driven by shard-specific ConfigMaps, enabling:Live updates to routing preferences and broker endpoints.
Rollout of new clusters without downtime.
Shard-level overrides for experimentation or blue/green Kafka migrations.
Graceful Failure Detection and Retry Logic
NSQ persists messages on local disk until Replicated confirms successful delivery to Kafka. If the primary Kafka is unreachable:Replicated enters a retry-backoff loop with exponential backoff.
If the failover Kafka is healthy, messages are drained into the backup cluster.
If no Kafka is available, messages remain safely buffered on disk until recovery.
This Kafka failover architecture played a critical role in hardening the ingestion pipeline - ensuring that even during broker outages, service disruption is minimal and event integrity is preserved.
Traffic isolation
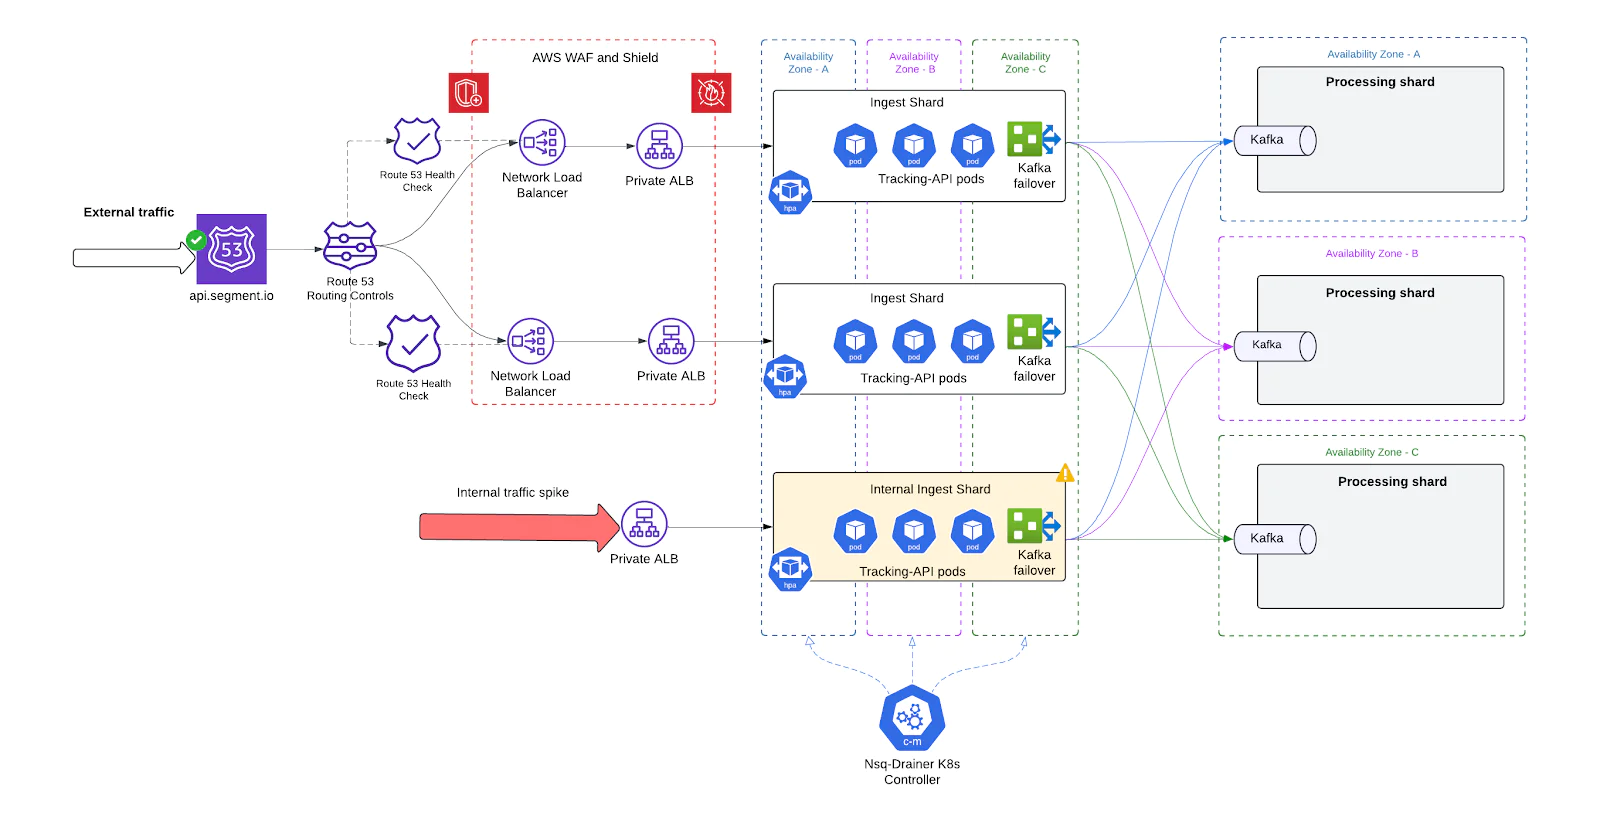
In the legacy architecture, internal and external traffic was processed through the same infrastructure stack. This meant that Segment’s own system-generated eventsshared compute, memory, queues, and Kafka partitions with real-time client ingestion traffic. As a result, noisy internal processes could degrade the experience for paying customers, and external spikes could impair internal workflows.
To address this, we introduced strict traffic isolation at the architectural level—physically and logically separating internal and external ingestion paths into dedicated shards.

How it works
Dedicated Ingest Shards per Traffic Type
We created two independent sets of shards:External shards: Serve real-time ingestion requests from customer-facing APIs and SDKs.
Internal shards: Handle system-originated events, such as replays, enrichments, synthetic data, or ETL flows.
Separate Infrastructure Footprints
Each traffic type has:
Its own Tracking-API deployments
Separate NSQD + Replicated DaemonSets
Distinct ALBs and autoscaling configurations
Per-Shard Scaling Policies
External and internal shards have different traffic patterns and performance requirements. For example:External traffic requires low-latency handling and faster autoscaling.
Internal traffic often involves large batch jobs, can tolerate retries, and benefits from throughput-optimized tuning.
We tune HPA thresholds, pod resource limits, and NSQD buffer sizes independently per shard type.
This change was fundamental in turning ingestion from a shared, fragile system into a multi-tenant, production-grade platform - one where different workloads no longer compete and interfere, and engineering teams can move faster with confidence.
Congestion control in processing
As our ingestion volume scaled, we observed that certain high-volume clients – or bursty traffic patterns – could unintentionally saturate processing resources downstream of Kafka. While rate limiting at the Tracking-API layer helped protect ingestion nodes, it did not guarantee fair usage or stability once events reached the processing layer.
To address this, we introduced congestion control mechanisms at the processing shard level to ensure predictable throughput and prevent system-wide slowdowns caused by overloaded or unbalanced client traffic.
How it works
- Per-Client Throughput Budgeting We assign each client (identified by source or workspace) a default throughput budget, based on contractual limits, historical traffic patterns, or observed behavior. This budget determines the maximum rate at which events are allowed to be processed.
- Soft Throttling with Rate-limited Queues When a client exceeds its processing budget:
- Their events are not dropped immediately.
- Instead, they are routed to a rate-limited queue, where processing continues at a controlled, slow rate.
- This queue is isolated from the main processing pool, preventing contention.


By introducing congestion control at the processing layer, we closed a critical gap in our system’s end-to-end fairness and reliability model. This ensures that the entire event pipeline – from ingestion through delivery – remains robust and responsive, even under pressure.
A hardened and resilient Tracking API
The transformation of Segment’s Tracking API (TAPI) was not just about resolving technical debt – it was about building a modern, resilient ingestion system capable of handling the demands of a fast-growing, global customer base.
By addressing core architectural limitations – such as centralized failure domains, lack of scaling agility, DNS instability, and insufficient workload isolation – we re-engineered TAPI into a modular, shard-based platform that is more elastic, more secure, and more robust under pressure.
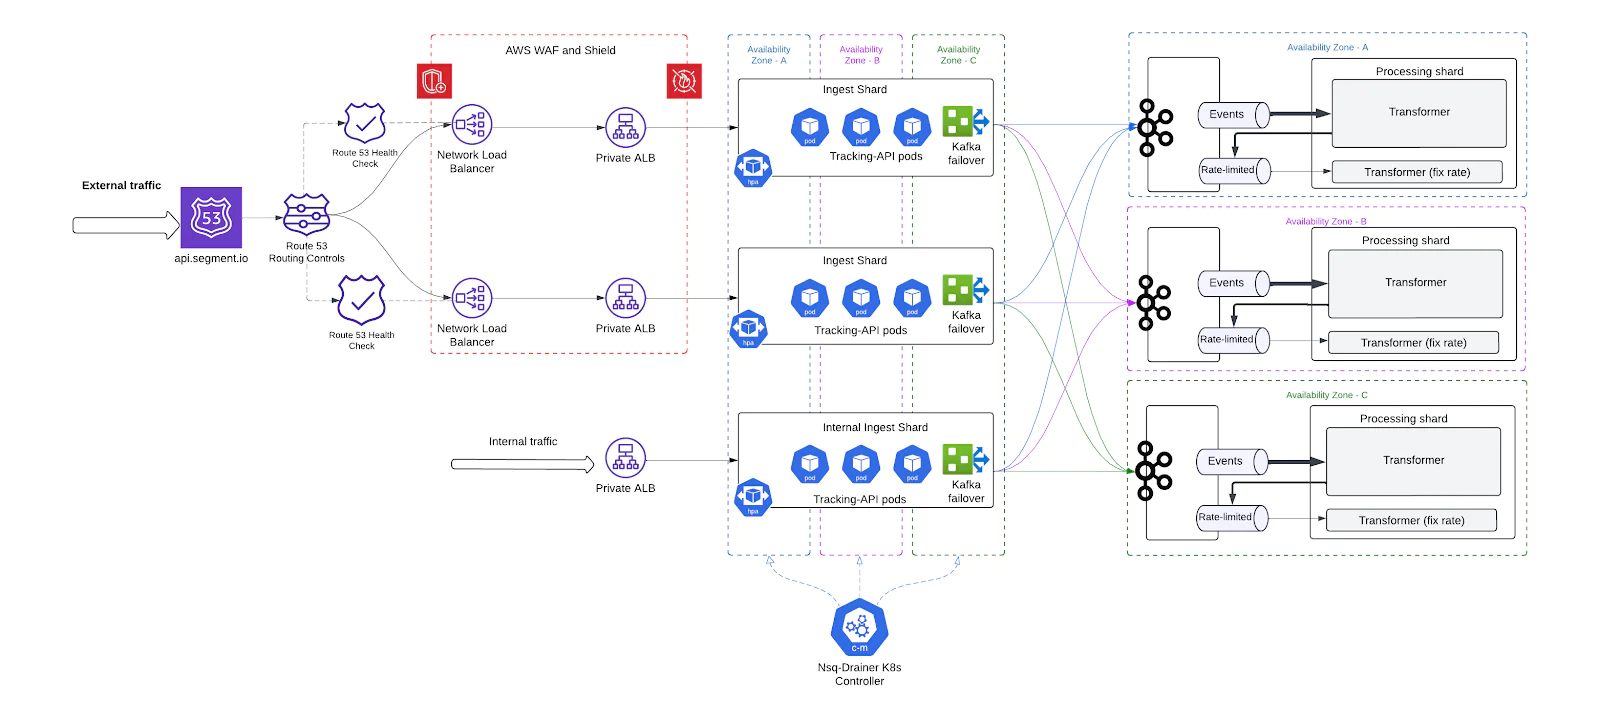

The improvements we made ensure that TAPI can now:
- Handle massive and unpredictable traffic patterns without manual pre-scaling
- Automatically fail over shards or Kafka clusters with minimal impact
- Scale independently per workload and per traffic type
- Defend itself from DDoS threats and application abuse
- Enforce fairness at the processing layer, ensuring better multi-tenant isolation
- Deliver consistently low-latency ingestion, even during adverse conditions
This overhaul dramatically reduced our operational burden, improved customer experience, and strengthened our platform’s foundation for years to come.
Looking ahead
This transformation significantly reduced our operational overhead, improved reliability under load, and laid the groundwork for a more adaptive and resilient platform.
With a modular, shard-based design now in place, the Tracking API has evolved from a single point of failure into a dynamic entry point built to grow with our customers’ needs. And while we’ve come a long way, this is just the beginning. We’ll continue evolving the system, exploring new scaling strategies, and share lessons learned as we push the boundaries of what our data infrastructure can do.
Additional Resources
- Twilio Segment CDP
- Segment Public API Documentation
- Segment Analytics.js Documentaion
- Segment Tracking API Documentation (HTTP API Source)
Additional thanks
Huge thanks to the incredible Edge team whose work made these improvements possible: Amit Singla, Aaron Klish, Atit Shah, Rishav Gupta, Srikanth Mohan, Stan George, Valerii Batanov, and Wally Tung.
Special thanks to Aaron Klish, Rishav Gupta, Paul Kamp, and Lisa Zavetz for reviewing early drafts and providing thoughtful feedback that helped shape this article.
Valerii Batanov is a Software Engineer at Twilio, where he focuses on building scalable, resilient systems for high-throughput data ingestion. He’s passionate about distributed systems, pragmatic infrastructure design, and making hard problems operationally simple. Outside of work, he enjoys biking and hiking the trails around British Columbia. You can find him on LinkedIn or reach out at vbatanov@twilio.com
Related Posts
Related Resources
Twilio Docs
From APIs to SDKs to sample apps
API reference documentation, SDKs, helper libraries, quickstarts, and tutorials for your language and platform.
Resource Center
The latest ebooks, industry reports, and webinars
Learn from customer engagement experts to improve your own communication.
Ahoy
Twilio's developer community hub
Best practices, code samples, and inspiration to build communications and digital engagement experiences.

