How to Monitor Application Health with Spring Boot Actuator and WhatsApp
Time to read:
October 19, 2023
Written by
Reviewed by

Monitoring and sending health reports of your application is essential, as it helps to figure out or detect when and where there is an issue with your application quite early. It is very useful in detecting potential health problems, allowing developers to take necessary action before a situation becomes critical. This can be instrumental in reducing application downtime.
This article teaches you how to use the Twilio WhatsApp API to monitor and send application health status reports with the help of Spring Boot Actuator. In this tutorial, you will build a Spring Boot application, use Spring Boot Actuator to monitor the health status of your Java application, and use the Twilio WhatsApp API to send reports in real-time via WhatsApp.
Prerequisites
You will need the following to follow along with this tutorial fully:
- A Twilio account. If you do not have a Twilio account, sign up for one here: Try Twilio Free.
- A Twilio phone number with WhatsApp capabilities (learn how to buy a Twilio phone number here).
- Java Development Kit(JDK 17).
- A basic understanding of Java and Spring Boot.
- A text editor (e.g. IntelliJ or Eclipse) installed.
Initialize the Spring Boot project
If you are not using an IDE that does not have an inbuilt extension to create a Spring Boot project, you can use the Spring Initializer to set up your project.
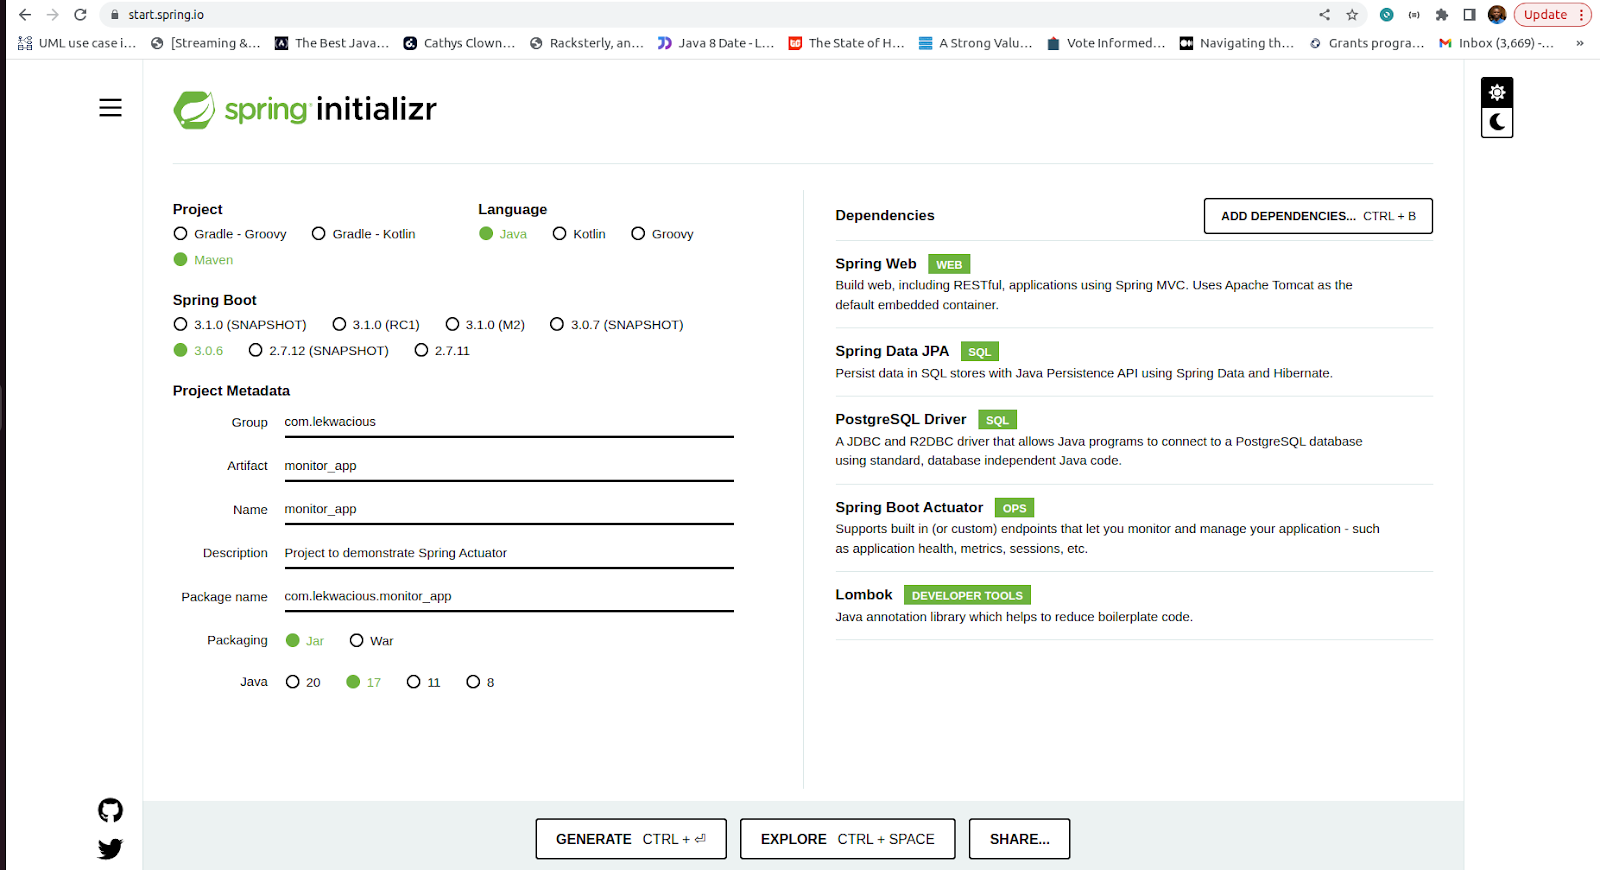
Head to the Spring initializer page, follow these instructions to set up the project:
- Select Maven as the project type.
- The language will be Java.
- Select the Spring Boot version of your choice or leave it at the default version. In this article, we are using Spring Boot version 3.06.
- Let the group name be "com.lekwacious". You are free to use a different name.
- The artifact will be called "monitor_app".
- Give the project a name. Let’s call it "Monitor_app".
- Select the JDK 17
- Provide a description of your project.
- You will package your Java code as a JAR file.
- Select the Java version of your choice or leave it at the default version.
- Add the following dependencies: Spring Web, Spring Data JPA, PostgresSQLDriver, Spring Boot Actuator, Lombok.
Next, click on the generate button to download the zip file. Unzip it and open it in your text editor and resolve the Maven dependencies.
Understand the Spring Boot Actuator
The Spring Boot Actuator project provides several capabilities that allows developers to trace when things go wrong on their application. Some of these capabilities include:
- Health Check: It provides an endpoint to monitor the application’s health status. This gives real-time updates if the application is running or not.
- Metrics: As a developer, you can use Spring Boot Actuator to monitor key metrics such as the response time and number of requests.
- Logging: This is useful in debugging, the logging endpoint retrieves log files.
- Auditing: The Spring Boot Actuator can be used to track users' actions using the auditing endpoint.
Enable the Spring Boot Actuator endpoint over HTTP
The Spring Boot Actuator dependency is included in the pom.xml file from the Spring initializer.
If you are using Gradle as the build tool, you need to add the dependency as shown below:
The Spring Boot Actuator Endpoints could be enabled or disabled in the application.properties. To enable the endpoints to be remotely accessible an endpoint also has to be exposed via JMX or HTTP. For HTTP, you need to configure the Spring Boot Actuator in the application.properties file with the following text:
The above enables Spring Boot Actuator endpoints over HTTP. The "*" is used to expose all endpoints. You can use a comma-separated list to expose only the ones you chose.
Enable Spring Boot Actuator Endpoint over JMX
For JMX, you need to configure the Spring Boot Actuator in the application.properties file with the following text:
Configure Postgres, JPA, and Hibernate
In the resources folder within the src/main folder, open the application.properties file and write the properties below:
Spring Boot uses the spring.datasource.url along with the credentials. Here, the Postgres database is configured with port 5432, and the database name as time_manager_db to establish a database connection to our Postgres database.
Don't forget to change the spring.datasource.username and spring.datasource.password properties to your own.
The Springboot.jpa.properties.hibernate.dialect makes Hibernate generate better SQL for the chosen database. You will set the DDL, or data definition language, to update. For example, the update operation will attempt to add new columns, constraints, etc., but will never remove a column or constraint that may have existed previously but is no longer part of the object model.
Use the Spring Boot Actuator endpoint to monitor the application
By default, Spring Boot Actuator provides several endpoints that can be exposed via HTTP or JMX to allow you to monitor your application.
To demonstrate this, run your application to start on the default port 8080 with the command:
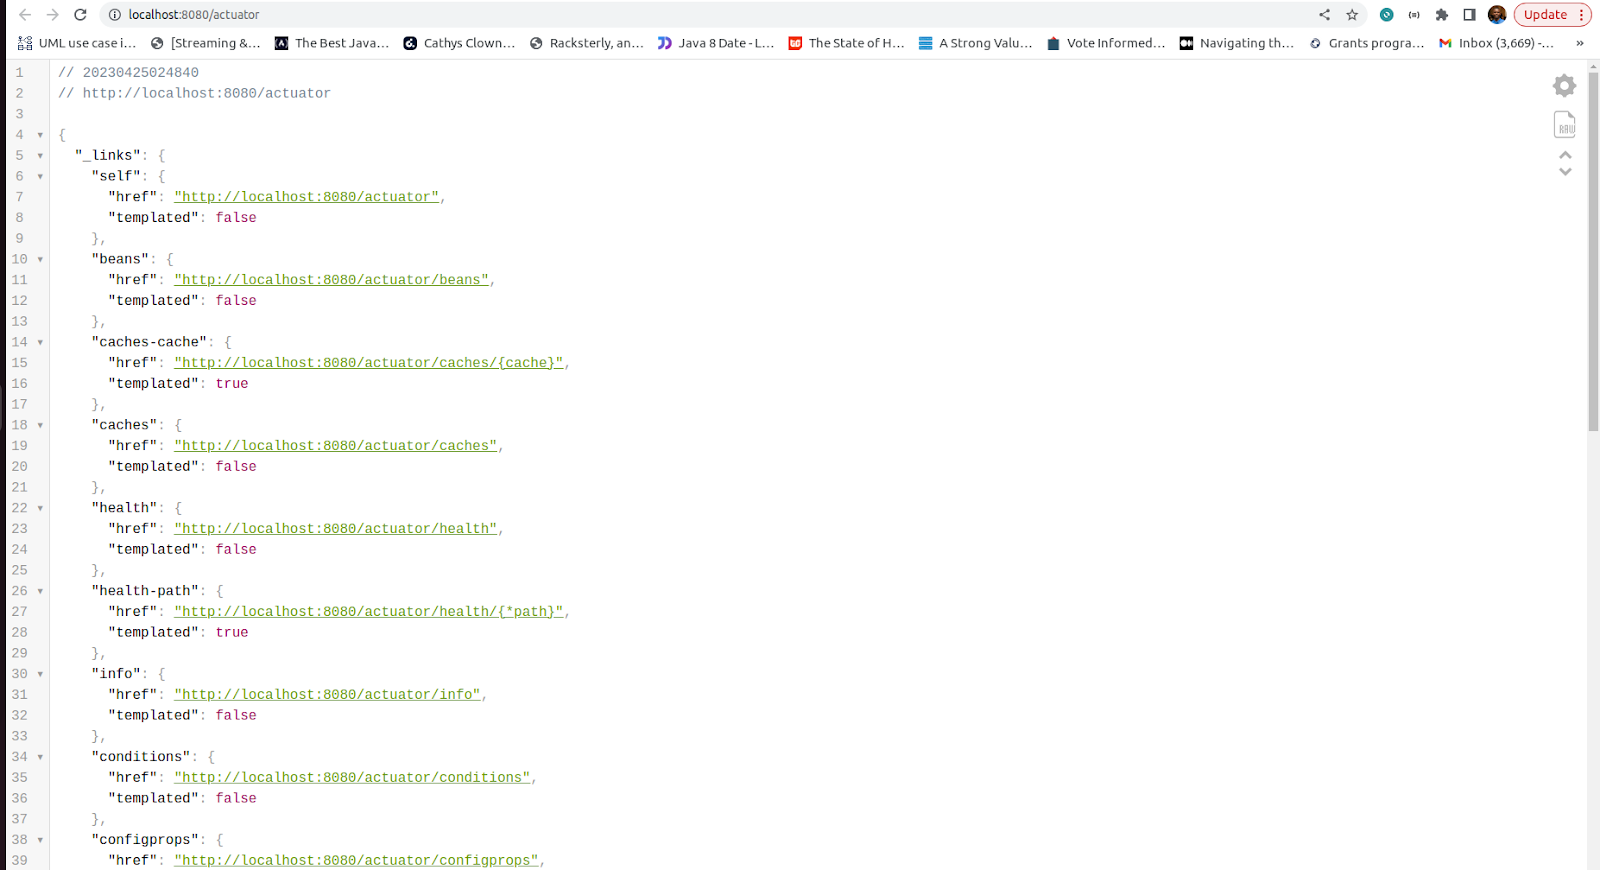
Now, you can see the list of all the Spring Boot Actuator endpoints exposed over HTTP from this URL http://localhost:8080/actuator.
To check the health status of your application, click the
http://localhost:8080/actuator/health URL. This should display the following:
Understand the DiskSpaceHealthIndicator Class
The Spring Boot Actuator enables you to show more details on the application’s health. This can be enabled by adding this to your application.properties as seen here:
Once you do that, the health endpoint will display more details including information from the DiskSpaceHealthIndicator class:
The "DiskSpaceHealthIndicator", which is run as part of the health checkup process, is now included in the health endpoint.
If your application contains a database such as PostgreSQL, the health endpoint will also report its status as shown above.
Receive a Spring Boot Actuator response within your application
You can get your Spring Boot Actuator response by calling the health web endpoint and parsing the output to where you need it either using the RestTemplate or HttpClient. While this works, it requires a lot of boilerplate code and it’s error-prone.
The best way to approach this is to consume the response using the beans provided by the Spring Boot Actuator. The bean returns "UP" when the health status of the application is fine and running and returns "DOWN" when the health status of the application is not running.
Get the aggregated health status of your Spring Boot application
Create class "HealthStatusProvider" in the repository package and add the following code:
To get the aggregated health status, create a bean, with a property of type HealthEndpoint. Create a constructor to initialize it and a getStatus method that returns the status of the healthEndpoint.
Get the component level health status
In the same repository subdirectory, create the class "MyComponentHealthStatusProvider" and annotate it with @Component to make it a bean. This class will have a list of HealthIndicator objects as fields instantiated through the constructor.
Copy and paste the following code below to your newly created class:
The getHealthStatus function returns the details for the health indicators in JSON format.
Integrate Twilio to the Spring Boot health monitoring app
Add the Twilio dependency to your pom.xml file if you are using Maven, then sync your project to download the dependency.
Make sure to specify the latest version of Twilio in the pom.xml file.
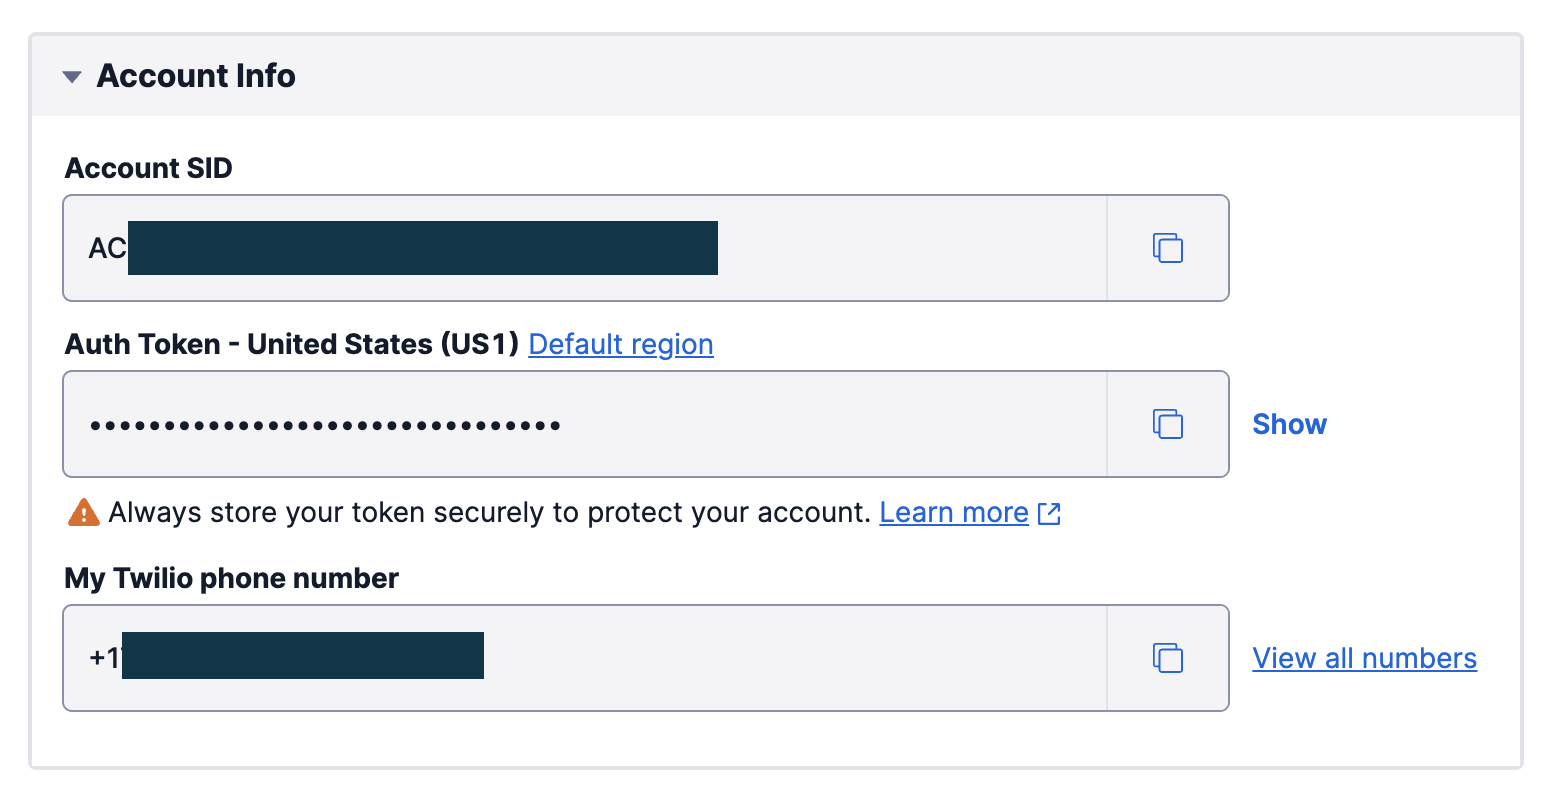
You will need to get your Twilio credentials to make requests to the Twilio API. To do this, log in to the Twilio Console. Your Account SID, Auth Token, and Twilio phone number can be found on the dashboard.
Add your Account SID and Auth Token to your application.properties as shown below:
Create a "config" package within the src/main/java/com/lekwacious/monitor_app subdirectory. Create a "TwilioProperties" class to configure your Twilio properties as shown below:
Create the domain class
Create a model package and an Activity class inside of it with the following code:
The @Entity annotation tells Spring that the Activity class is simply a Plain Old Java Object that should be persisted on a database, @Id annotations make the activityId field a primary key. The @GeneratedValue is used to specify the primary generation strategy, in this case, the values are automatically generated.
Handle Exceptions
To handle exceptions, create a new package named exception. Make a new ResourceNotFoundException class that extends the RunTimeException. Add the following code:
The Repository
In the repository folder, create an ActivityRepository class and add the following code:
The @Repository annotation makes the interface a bean and is treated identically to the @Component annotation. By extending the JpaRepository interface we inherit the save, findAll, findById methods.
The Payloads
Inside the same project subdirectory, create a package named Payload with two more subfolders named "requestPayload" and "responsePayload".
The payload contains your DTOs (data transfer objects). DTOs let you transfer only the data you need to share with the user interface and not the entire model object that you have persisted in the database. The payloads folder contains two subfolders to keep your code more organized and neat.
The requestPayload will contain only DTOs that will be sent from the frontend as request body during a network call, while the responsePayload will contain DTOs that will be returned to the users after a successful network call.
The Request Payload
In the requestPayload folder create an ActivityRequest class and add the following code:
The @Data annotation generates setters and getters for this class.
The Response Payload
In the responsePayload folder create a BaseResponsePayload class and add the following code:
In the responsePayload folder create an ActivityBaseResponse class that extends the BaseResponsePayload class and add the following code:
The Service
Create a service folder under the monitor_app package. This folder will contain the business logic of the app. To ensure separation of concerns, you will divide the service into two parts:
- an interface where the methods of the business logic will be declared.
- a concrete class that implements the interface.
Create an interface with the name "ActivityService" with the following code:
@Component annotation is a shorthand for the @Bean annotation. It registers the ActivityService interface as a bean in the application context and makes it accessible during classpath scanning.
Create a class named "ActivityServiceImpl" in your service package and autowire the TwilioProperties, MyComponentHealthStatusProvider, and HealthStatusProvider classes you created earlier. The ActivityServiceImpl class implements the ActivityService interface as shown below:
Declare a method to send the WhatsApp message. This method uses the Twilio client to create a new message, passing in the recipient's WhatsApp number, the message body, and the Twilio WhatsApp phone number. The Twilio WhatsApp number can be found in the Console’s WhatsApp Sandbox
You created the method logActivity to create an activity. This invoked the sendWhatsAppMessagemethod, gethealthStatus, and getMetricsEndpoints methods respectively.
The Controller
Create a package named "controller" and a class within it called "ActivityController" with the following code:
The @RestController marks the ActivityController as a HTTP request handler and allows Spring to recognize it as a RESTful service.
The @RequestMapping("api/v1/timeManager") annotation sets the base path to the resource endpoints in the controller as /api/v1/timeManager.
The @PostMapping("/log") is a shortcut for @RequestMapping(method=RequestMethod.GET), and is used to map HTTP POST requests to the mapped controller methods. It returns ActivityBaseReponse which is a class that contains an activity, HttpStatus code etc.
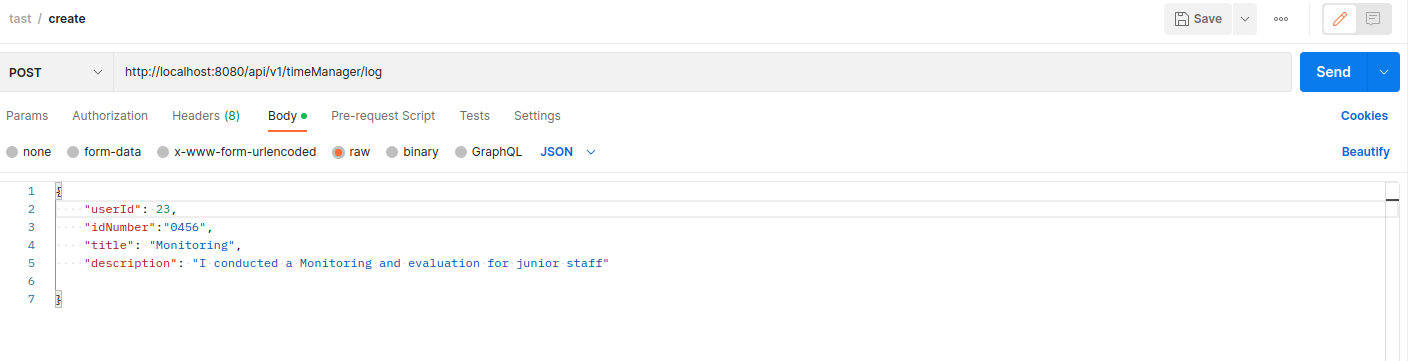
Test the Application with Postman
The entire code base can be found in this GitHub repository. To test the application run the command in the terminal:
Launch your Postman and log an activity by making a POST request to "http://localhost:8080/api/v1/timeManager/log"
In the process of logging this activity, Spring Boot Actuator will get the HealthStatus of the application and invoke the sendWhatsAppMessage method Twilio WhatsApp API to send the health status report. The result of this is sent to the WhatsApp number as the screenshot shows below:
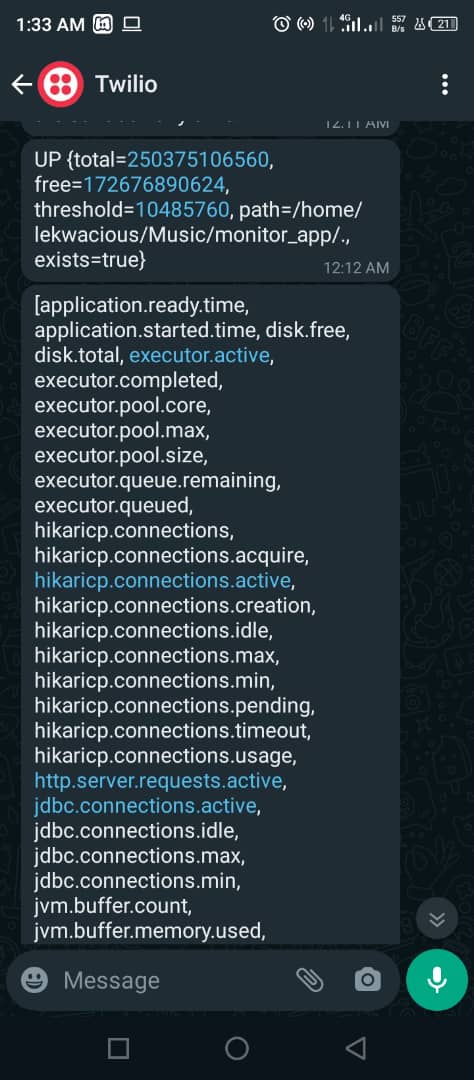
The result above shows the status of the application. The application is “UP”, meaning it is working as expected. If it returns “DOWN” it means the component or the application is not working.
It also showed the report of the Disk Space Health Indicator. The total disk space your application has and the free and available space left, with this you can know when you are running out of space and act accordingly by scaling your application disk space. The status of your JDBC is reported as active, which shows that your application is connected to a database.
What's next for monitoring applications with the WhatsApp API?
You have learned how to monitor and send application health status reports to your WhatsApp number with the help of Spring Boot Actuator and the Twilio WhatsApp API. If you want to expand on this project, you can consider adding the following enhancements and additional features:
- Custom health checks: Expand the health checks to include custom health indicators specific to the application. For example, you could add checks for specific database tables or external services that the application relies on.
- Scheduled health reports: Create a scheduler that periodically sends health reports to WhatsApp, rather than only sending reports when an activity is logged.
- Create a dashboard to visualize the historical health data and trends, making it easier to analyze and diagnose problems.
Eme Anya Lekwa is a Software Engineer. He is passionate about how technology can be employed to ensure good governance and citizen political engagement. He is a mobile and web developer and a technical writer. He can be reached on LinkedIn or Twitter.


Related Resources
Twilio Docs
From APIs to SDKs to sample apps
API reference documentation, SDKs, helper libraries, quickstarts, and tutorials for your language and platform.
Resource Center
The latest ebooks, industry reports, and webinars
Learn from customer engagement experts to improve your own communication.
Ahoy
Twilio's developer community hub
Best practices, code samples, and inspiration to build communications and digital engagement experiences.