Separate Data in Flex Insights
Time to read:
January 04, 2022
Written by
Reviewed by

Flex Insights and Flex are not designed by default to support multi-tenancy to separate data per team, market, or any organization unit. While in Flex you can use plugins to hide, filter, or remove components and values, in Flex Insights we need to follow a different approach, so that your Supervisors can only see data they should see.
In this blog post, I will demonstrate multiple ways to configure your Flex Insights instance based on your organization unit structure. There is an important statement to be shared before you consider one of the options:
Decision criteria
Your chosen solution should be evaluated against the number of organization units that need to see only their own data.
Organization unit examples:
- team
- department
- market
- country
- queue
My recommendation is the following:
- at max 2 units - use the dashboard permission solution
- more than 2 teams and no development - use the variables solution
- more than 2 teams with development - use the embedded dashboard solution
I recommend reading all solutions below, as you can combine certain steps and create your own solution that fits your specific requirements.
Ready? Let's start with the detailed guides.
Dashboard Permissions
Our fake company Acme Corporation has two teams – one is responsible for Anvils, and the second for Tennis Balls 🙂. We know that 2 is our final number, and none of the teams should see each other's data. We have configured separate queues per team. Therefore we have all the necessary data in Flex Insights already.
Supervisor roles & Agent team attributes
First of all, we need to make sure that Supervisors will not be able to generate their own reports and dashboards. Let's look at the roles we can assign:
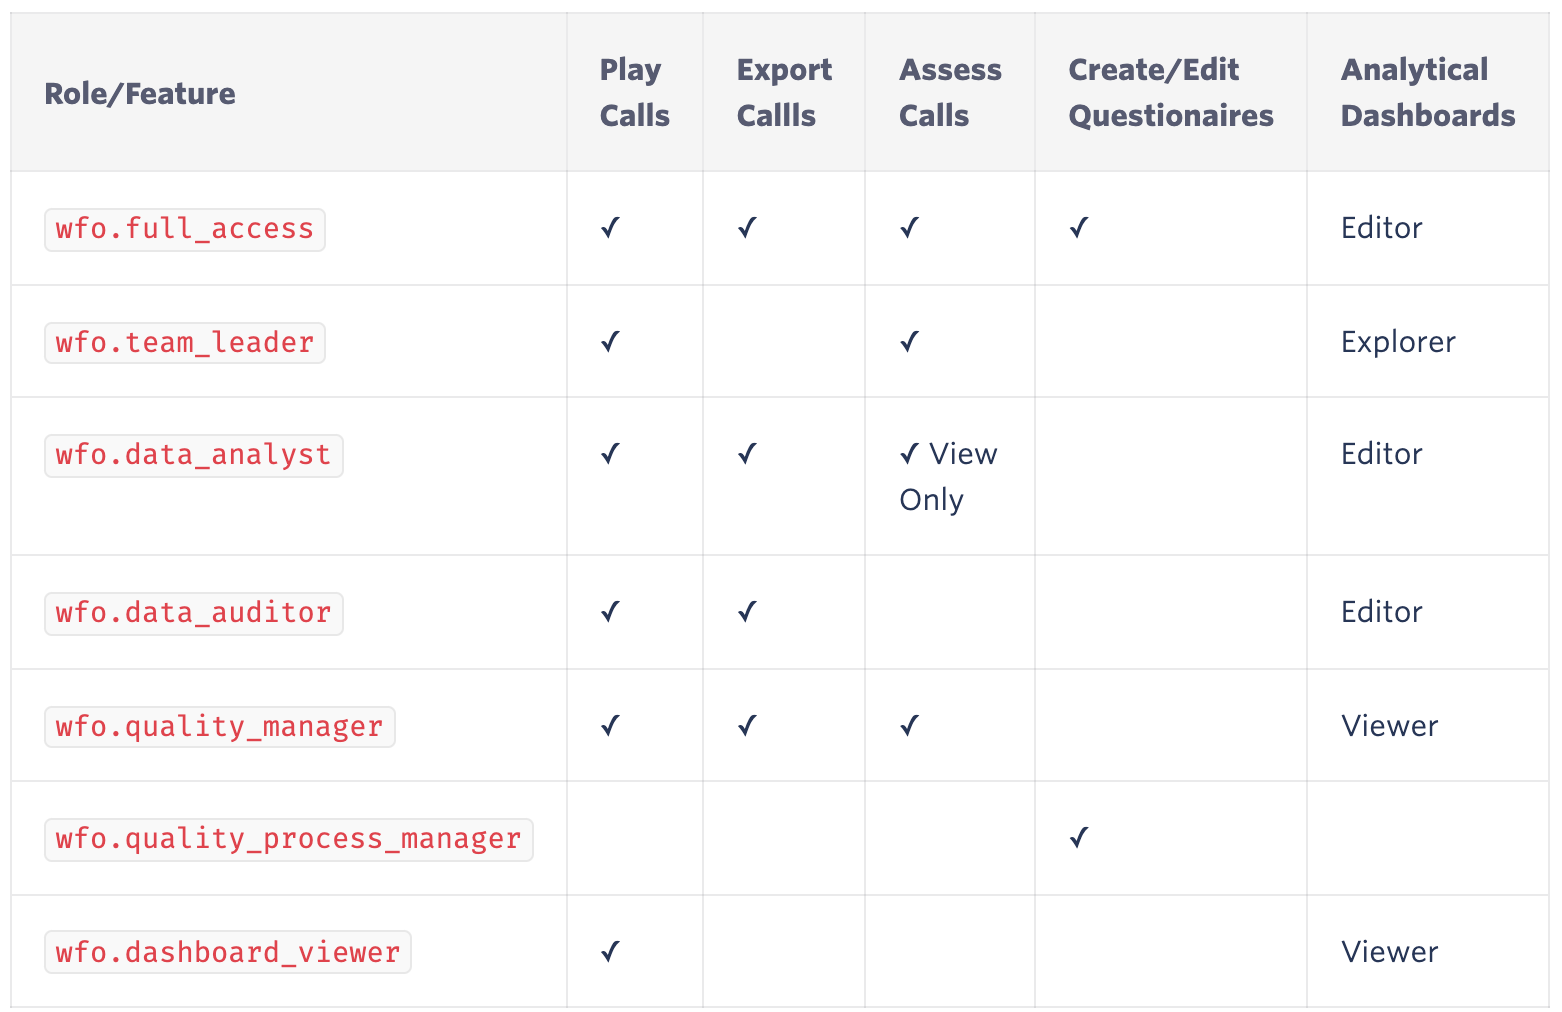
The ideal role to start with is wfo.dashboard_viewer (together with Supervisor, of course). With this role, the Supervisor will only be able to see the dashboards that you allow them to see, and play back the recordings that they are able to see. They won't be able to generate their own reports with the other team data.
Second, we need to assign a team membership to the Agents/taskrouter workers by using team and team_id attributes. So, for example, if agentX is a member of Anvils team then their attributes will contain:
{..."team_id":"Anvils","team":"Anvils"...}
Make sure that you use team_id to prevent duplicate teams as shown in the Flex Insights documentation.
Hide default dashboards in Flex Insights
You can see two default dashboards after logging into Flex Insights (in January 2022): Control Center & Pilot Dashboards. To hide them from all Supervisors, we need to follow the guide in Twilio's documentation: sharing & permissions.
- Open the analytics portal (analytics.ytica.com)
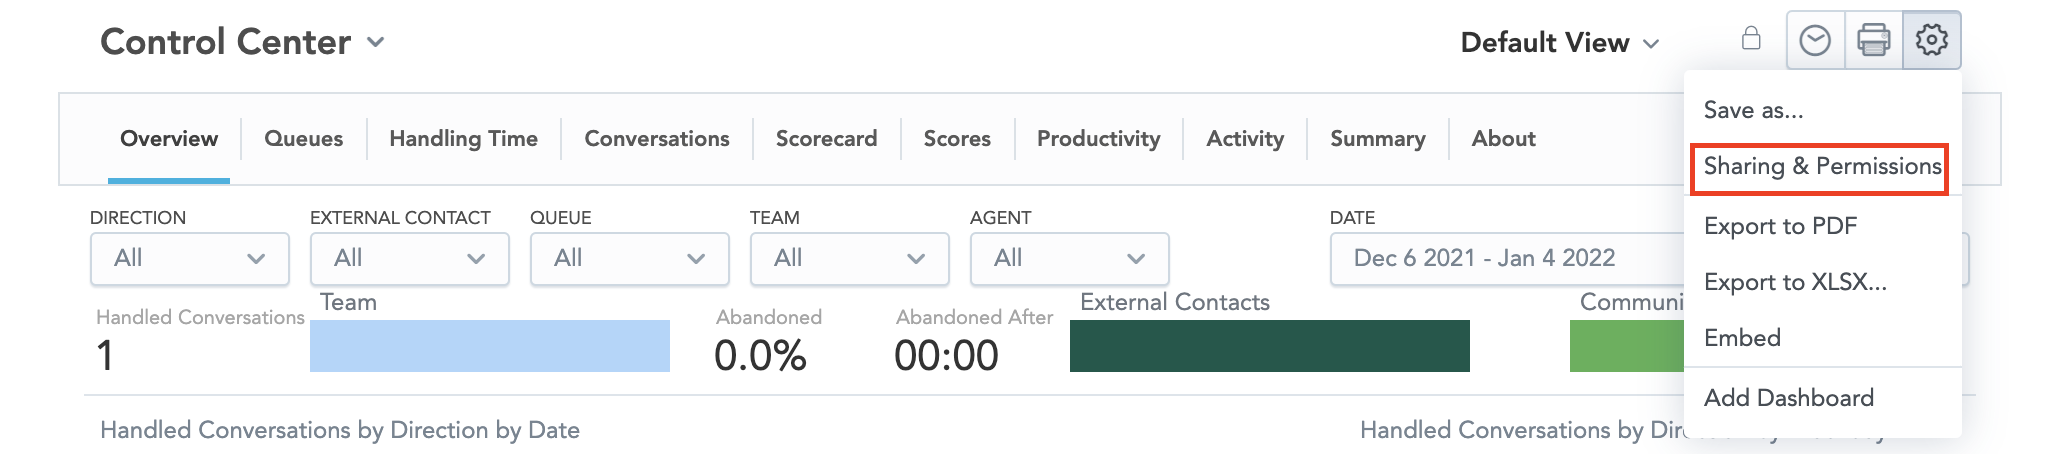
- Select options for the Control Center dashboard, and hit Sharing & Permissions:
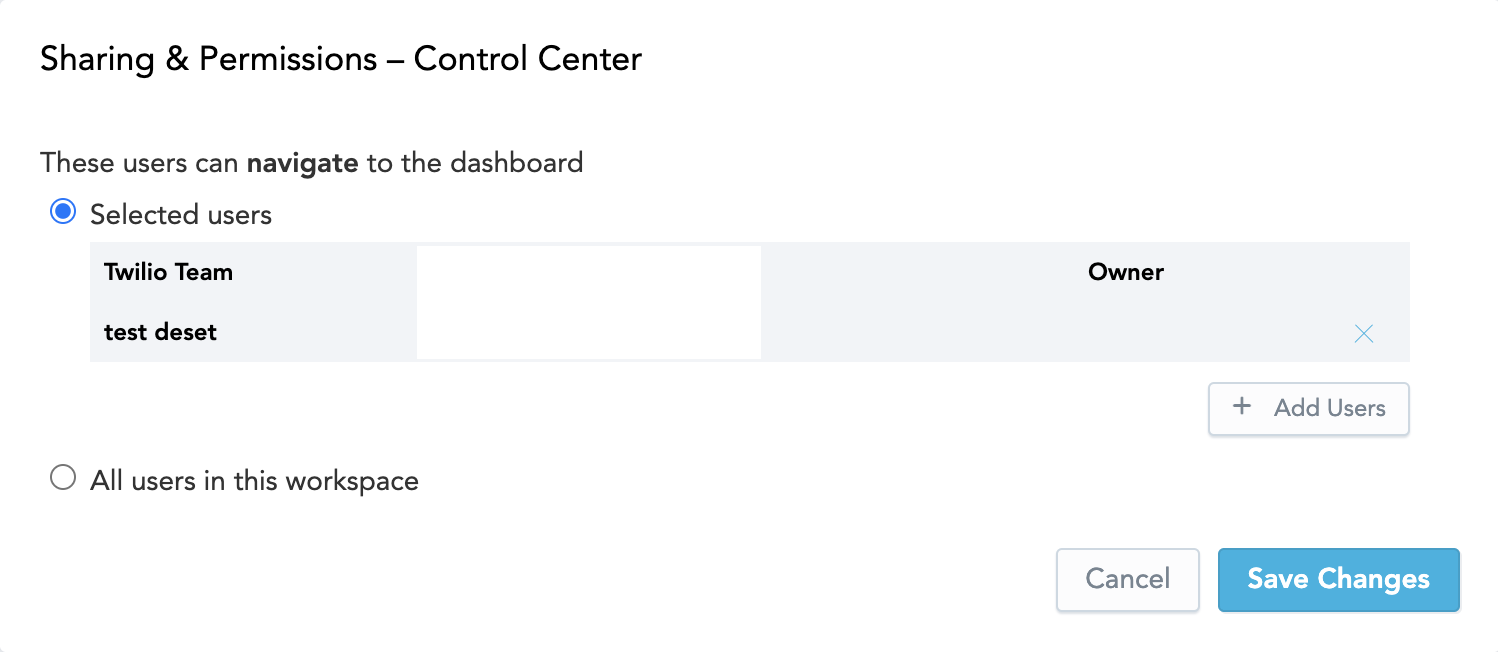
- Choosethe Selected users option (make sure your name is in the list)
- Repeat the same steps for the second Pilot Dashboards dashboard
Use queue filter in conversation reports
At the moment, your Supervisors should not see any dashboards in their Flex Insights – let's create some content for them.
Each team will get one dashboard with team specific reports. Let's look at how to use report filters to filter by queue, as we know that each team has a dedicated queue. We will reuse the predefined report for the conversation list, but we adjust the filter.
- Navigate to Flex Insights Analytics Portal > Reports > search & open Segments - List
- We do not have permission to modify this predefined report, but we can save it to get full ownership. In the right top corner click Options > Save As
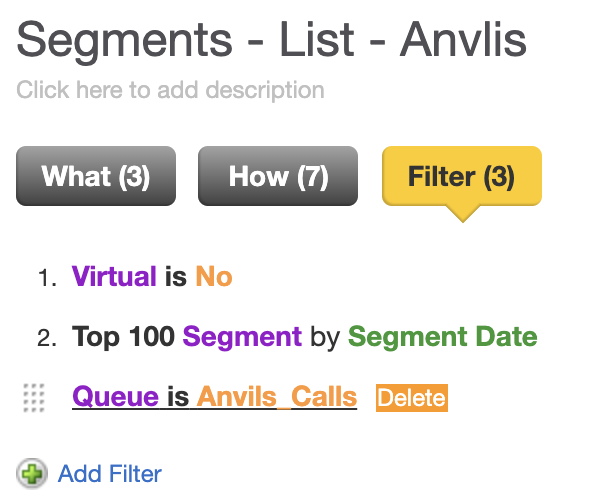
- Name the report e.g. Segment - List - Anvils
- Click on Filter > Add Filter > Select from list of values > Queue = Anvils_Calls
- Repeat the same process for the second team
- Create as many reports as you wish following the steps above
At this moment, we can see the most significant disadvantage of this solution – you need to create and manage all reports and dashboards twice per team. It's doable for just two units but annoying for anything more...
Use agent team filter in activity reports
As you might know, the segments for agents' activities do not have any queue, as there is no connection between agent activity (Lunch, Available, Offline) and queue in Flex.
For reports related to agent activities, we use the 'Agent team' field that is coming from Taskrouter worker attributes. Maybe you are asking, "Why don't we use the team attributes for conversations, too?". Good question!
We shouldn't forget about abandoned calls that do not have any Agent assigned, so the only attribute we can split them on is 'Queue'.
Let's use the same approach as above and reuse some of the existing reports:
- Navigate to Flex Insights Analytics Portal > Reports > search & open Activity - List
- We do not have permission to modify this predefined report, but we can save it to get full ownership. In the right top corner click Options > Save As
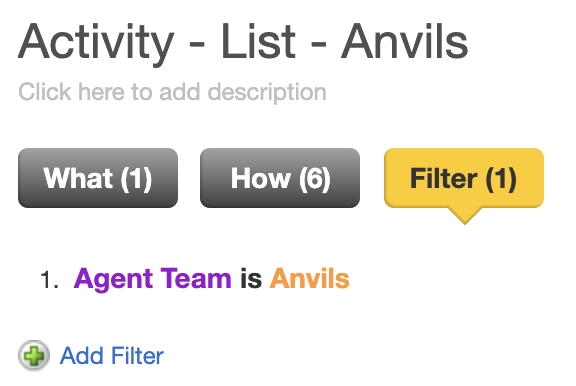
- Name the report e.g. Activity - List - Anvils
- Click on Filter > Add Filter > Select from list of values > Agent Team = Anvils
- Repeat the same process for the second team
- Create as many reports as you wish following the steps above
Create a dashboard for each team
We have our per-team reports now, so we can go ahead and create one dashboard for each team where you would place all team-related reports.
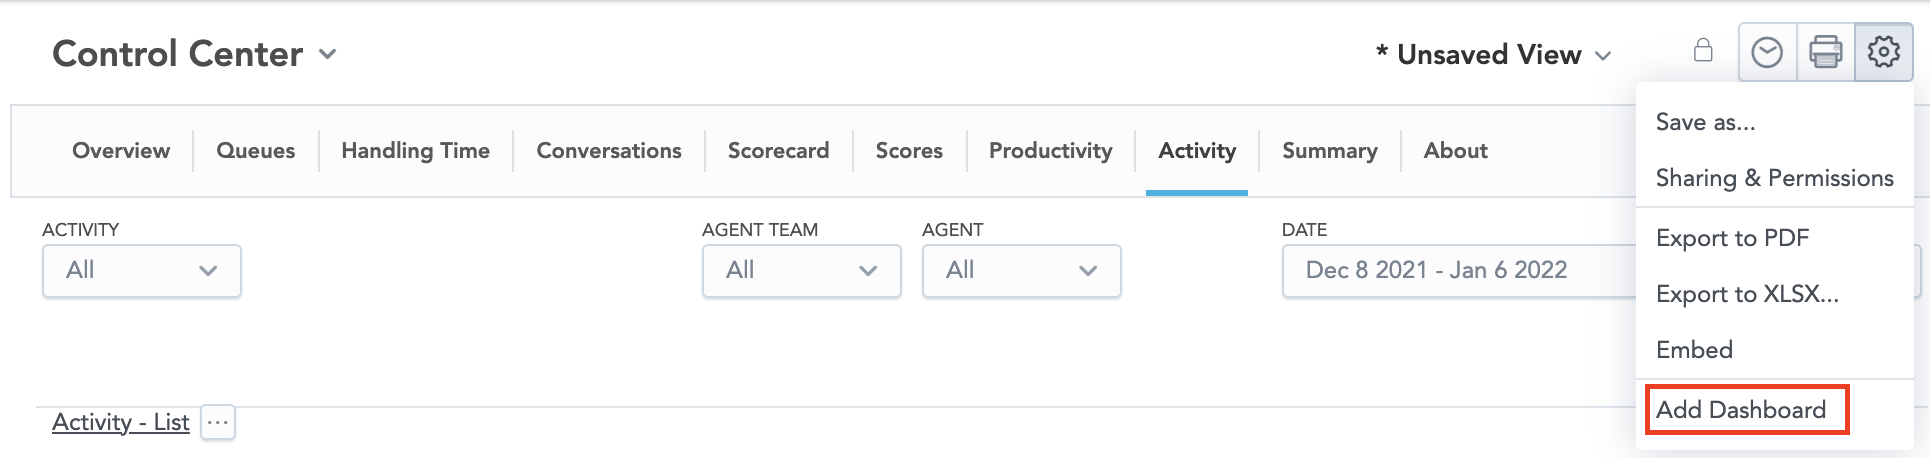
- Open the analytics portal (analytics.ytica.com) and open the Control Center dashboard > settings icon (right top) > Add Dashboard
- Name it e.g., Anvils Dashboard
- Use the Reports menu on top to add all "Anvils" reports to the dashboard > place & size them as you wish
- Use Filters menu on top to add filters > Do NOT add queue and agent teams filter, as dashboard filters have priority over report filters
- After you design your new dashboard – click Save > click the settings icon > Sharing & Permissions > add all Supervisors that should be able to see the selected dashboard
Conclusion
Great job! You should now have two dashboards, both of them accessible to relevant Supervisors based on sharing & permissions settings. In each dashboard they can see only the data relevant to their team based on queue or agent team.
Variables Filters
The second approach we are about to discuss can be used for more (2+) organization units, and it's recommended if you'd prefer to manage just one dashboard. There is some manual management involved with this approach as well, but we do not have to edit reports for each unit individually. Instead, we will manage a variable to assign each user one or more teams.
Acme Corporation has four departments in this scenario - Anvils, Tennis Balls, Onions, and Candles. Again, Supervisors of respective departments must only see their department's data.
Prerequisite: Get Access to Flex Insights Variables
As a first step, you need to get access to variables in Flex Insights Analytics Portal.
To get the access, please open a support ticket in your Console. Our support engineers set a special role for the given user, and they can add the proper flag to your account.
Supervisor roles & Agent team attributes
First of all, we need to make sure that Supervisors will not be able to generate their own reports/dashboards. Let's have a look at the roles we can assign:
The ideal role to start with is wfo.dashboard_viewer (together with Supervisor, of course). With this role, the Supervisor will be able to see only those dashboards that you allow them to see, and play back only those recordings they can see. They won't be able to generate their own reports with another's team data.
Second, we need to assign team membership to the Agents/taskrouter workers using department and department_id attributes. So, for example, if agentX is a member of the Candles department, then their attributes will contain:
{..."department_id":"Candles","department":"Candles"...}
Make sure to use department_id.
Flag department into a Taskrouter task
To make sure once again that we can see the abandoned calls (no Agent during the call), we need to bring a department into the tasks with the task creation. To do so, you can use a function plugin, but the easiest way is to use Studio.
We can use any empty Flex Insights attribute. In this scenario we are using conversation_attribute_1.
- Open Twilio Console > Studio > Flow that you are using
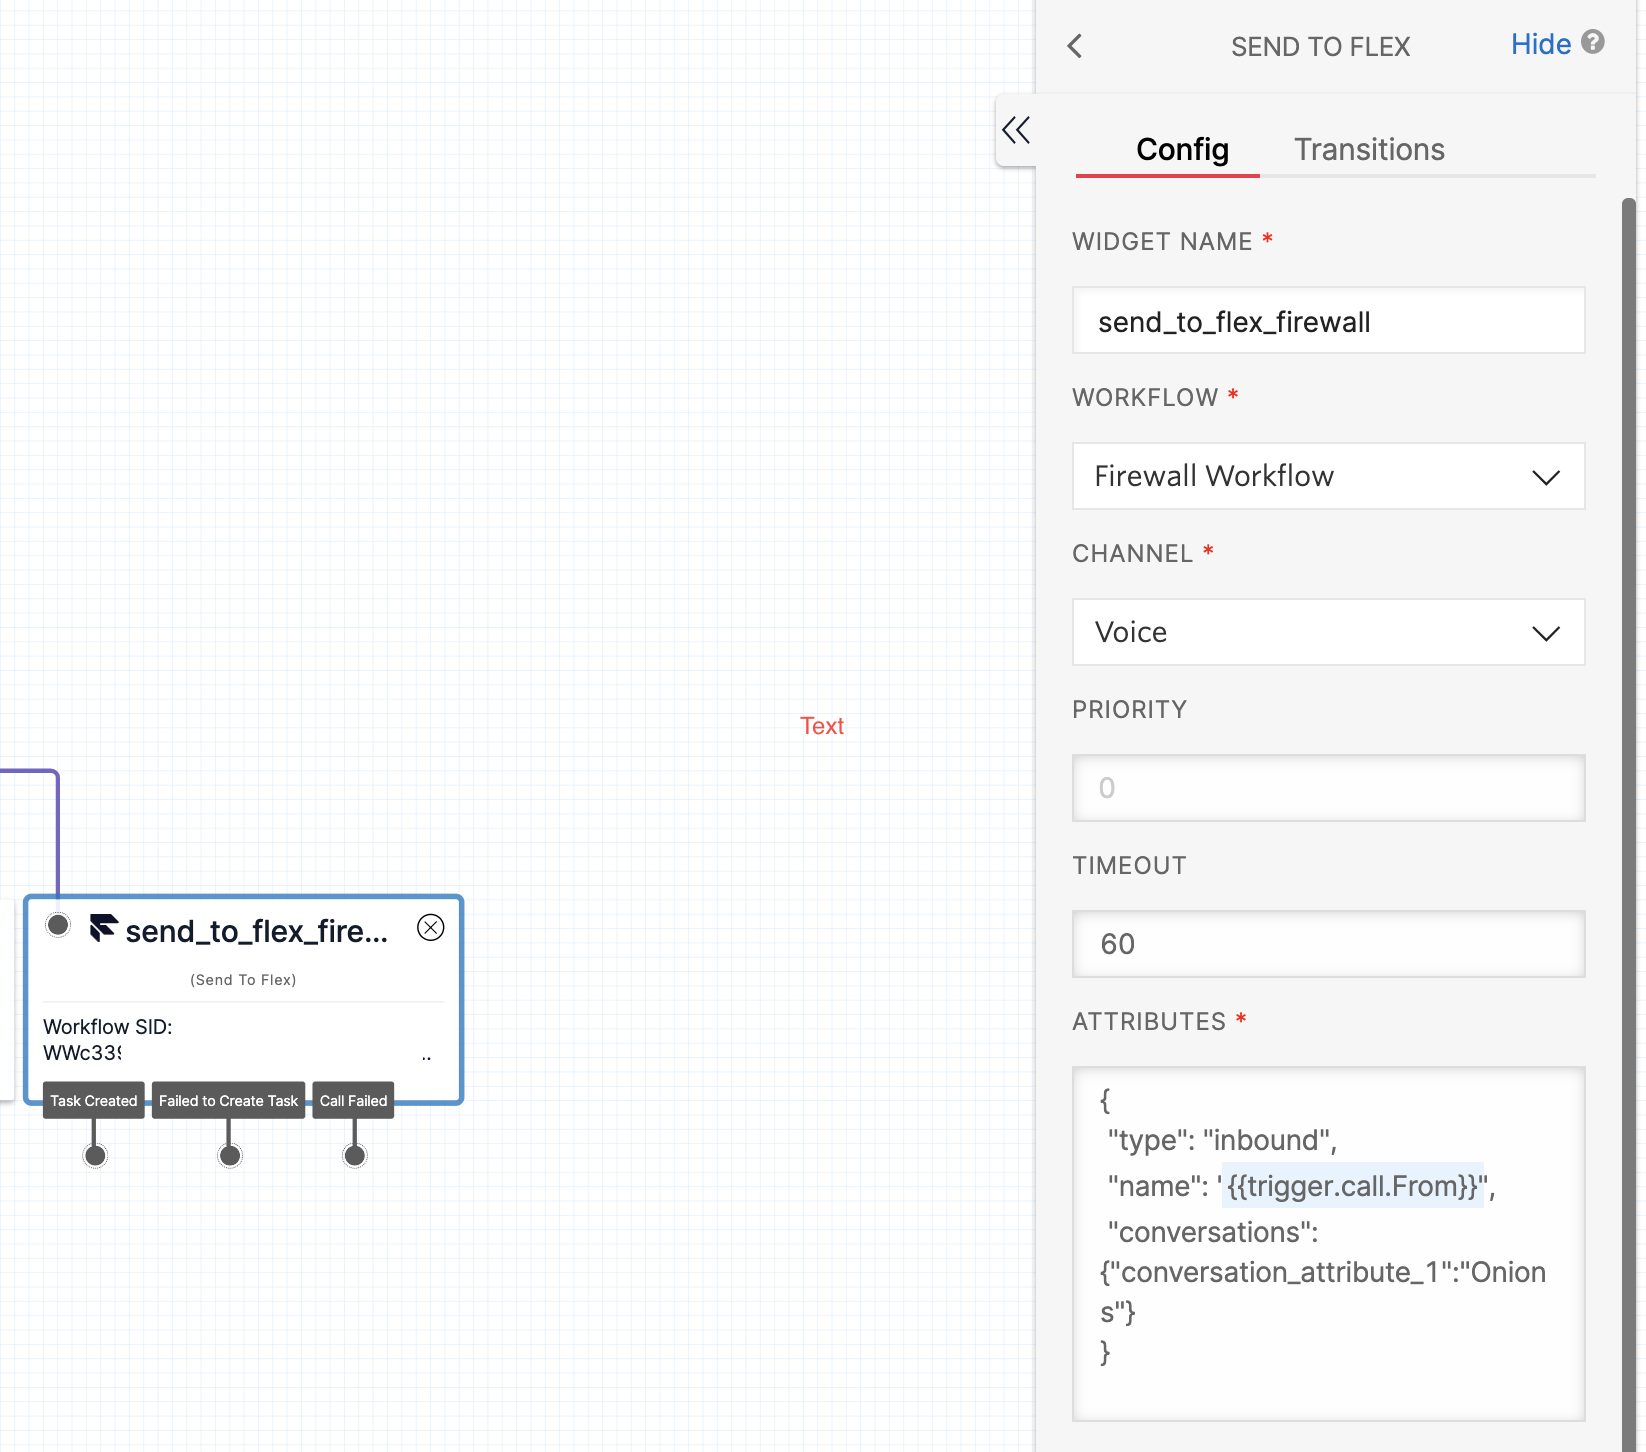
- In each flow, there should be multiple 'Send to Flex' widgets, depending on an IVR choice or any logic you use
- Based on the caller's IVR choice we know the department to which the call is being routed
- Click on 'Send to Flex' widget and add
{..."conversations":{"conversation_attribute_1":"<department_value>"}...}into attributes
Now we have all conversations and Agents assigned to some department. Let's start creating reports and dashboards.
Hide the default dashboards in Flex Insights
You can see two default dashboards after logging into Flex Insights (in January 2022): Control Center & Pilot Dashboards. To hide them from all Supervisors, we need to follow the Twilio documentation: sharing & permissions.
- Open the analytics portal (analytics.ytica.com)
- Select options for the Control Center dashboard and hit Sharing & Permissions:
- Choose Selected users option (make sure your name is in the list)
- Repeat the same steps for the second Pilot Dashboards dashboard
Creating Variables & Assigning Values
We need to create two variables in Flex Insights: first for Agent Team and second for Conversation Attribute 1. Agent team will be used for reports related to agent activities (available, lunch, offline...), and Conversation Attribute 1, where we have stored department for all conversations, will be used for all interactions (including abandoned).
- Navigate to Analytics Portal > Manage > Variables > Create Variable
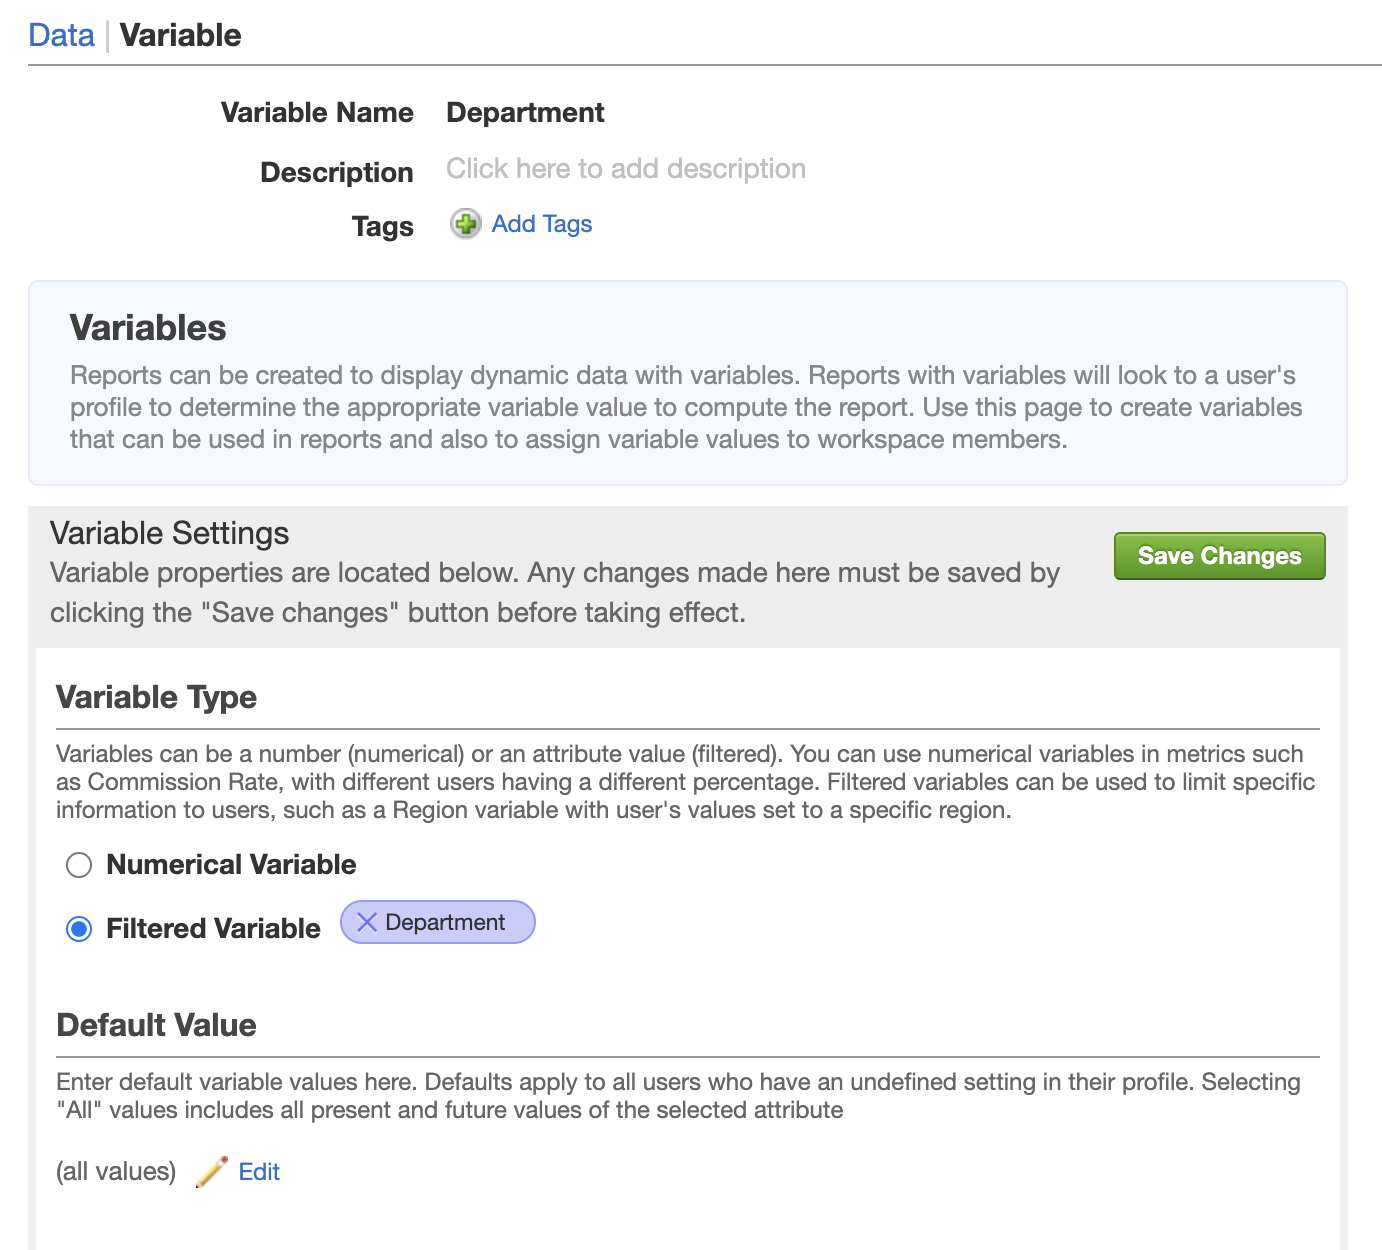
- Create the first variable called e.g., Department
- Variable Type select "Filtered Variable" > attribute: Department > Save
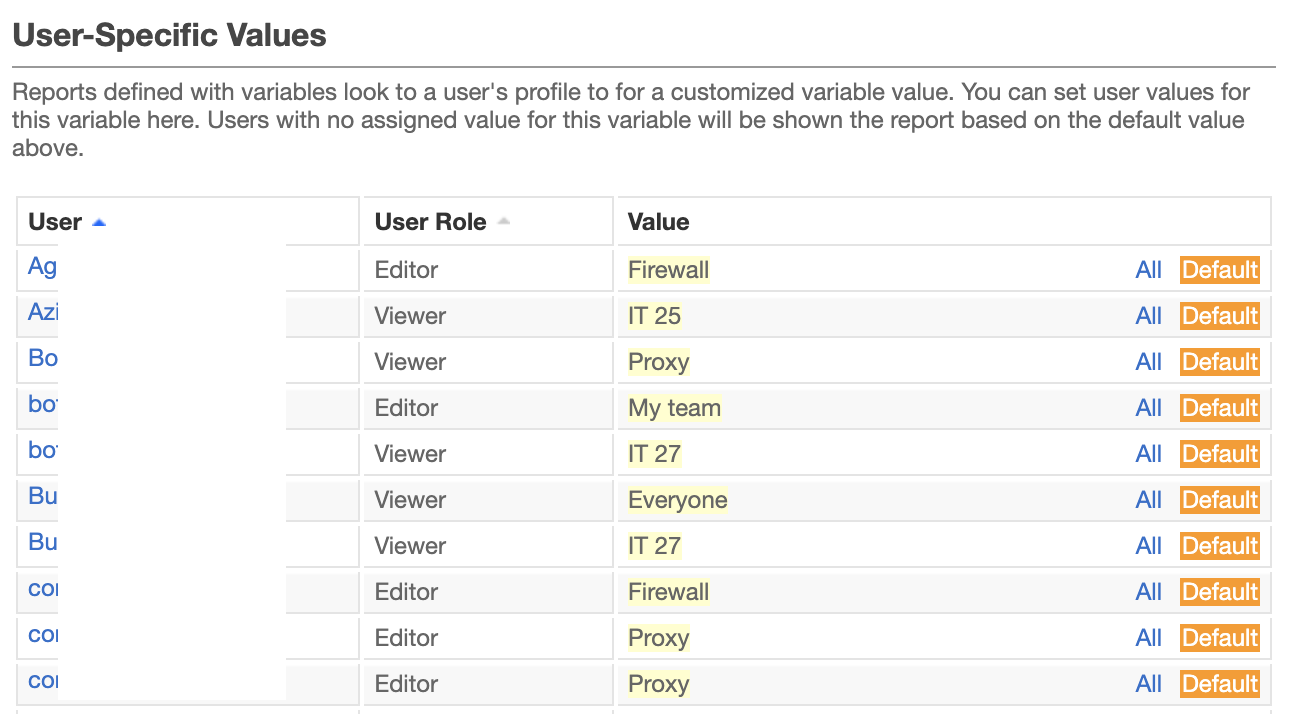
- Scroll to the section "User-Specific Values" where you can see all your Supervisors (not Agents, but users that have access to Flex Insights)
- Set a value for each Supervisor of the department that they should see
- Save
Repeat the same steps for the second variable with Conversation Attribute 1 (you can name it e.g., Conversation Department).
Create Reports and one Dashboard
It does not matter how many team and departments there are. We will create just one report, and each user will see a different data set as we will use a filter variable. This is a huge advantage for this solution, as all you need to do is create reports and place it into one dashboard.
Let's reuse some existing reports for conversations and agent statuses:
- Navigate to Flex Insights Analytics Portal > Reports > search & open Segments - List
- We do not have permission to modify this predefined report, but we can save it to get full ownership. In the right top corner click Options > Save As
- Name the report e.g., Segments - List - Variable
- Click on Filter > Add Filter > Variable > Conversation Department
- Repeat the same process for the Activity - List report (filter with the variable for Department)
- Create as many reports as you wish following the steps above
- Navigate to Dashboards > Control Center dashboard > settings icon (right top) > Add Dashboard
- Name it e.g., Our Only Dashboard
- Use the Reports menu on top to add all reports with the variable filter to the dashboard > place & size them as you wish
- Use Filters menu on top to add filters > Do NOT add department & conversation-attribute-1 filters as dashboard filters have priority over report filters
That's it!
Conclusion
As you can see, we have just one dashboard, but each Supervisor can see different data. Everything is managed by a filter variable that you have in all reports. You can simply manage all Supervisors via the two variables and give access to one, more, or all of the departments.
Embedded dashboards
The last approach requires some development. However, this solution is the only one that does not require any manual steps (i.e., managing variables). The filters for organization unit data will be directly deployed into the embedded dashboard link, but we need to develop a simple plugin.
Our fake company Acme Corporation is now huge and present in 25 countries. Each country is one market, and they have Agents in each one of them. Supervisors should only see their own country's data, and should not have access anywhere else. Let's begin!
We are going to use the same approach described in the first two solutions, where we mark each task with a country code (see Studio section & conversation_attribute_1 assignment above). All Agents and Supervisors will have agent_team & market attribute in worker's attributes -{..."team_id":"CZ","team":"CZ", "market":["CZ"]...} .
As a next step we will create two dashboards in Flex Insights. One specific to conversations (chat, calls, ASA, AHT...) and other specific to agent activities (tables & charts about agent statuses - Available, Offline, Lunch, Break ... ). Creating a dashboard is described in the previous solutions – you can either create your reports and dashboard, or re-use predefined ones. You do not create any specific market or team filters in the reports' definition as we are going to filter data via embedded URI.
Embedded Dashboards URIs
We now have two dashboards in the Flex Insights analytics portal. Let's have a look how to create the URI.
- Navigate to Flex Insights and open the dashboard for conversations
- Click the Settings icon (right top) > select Embed
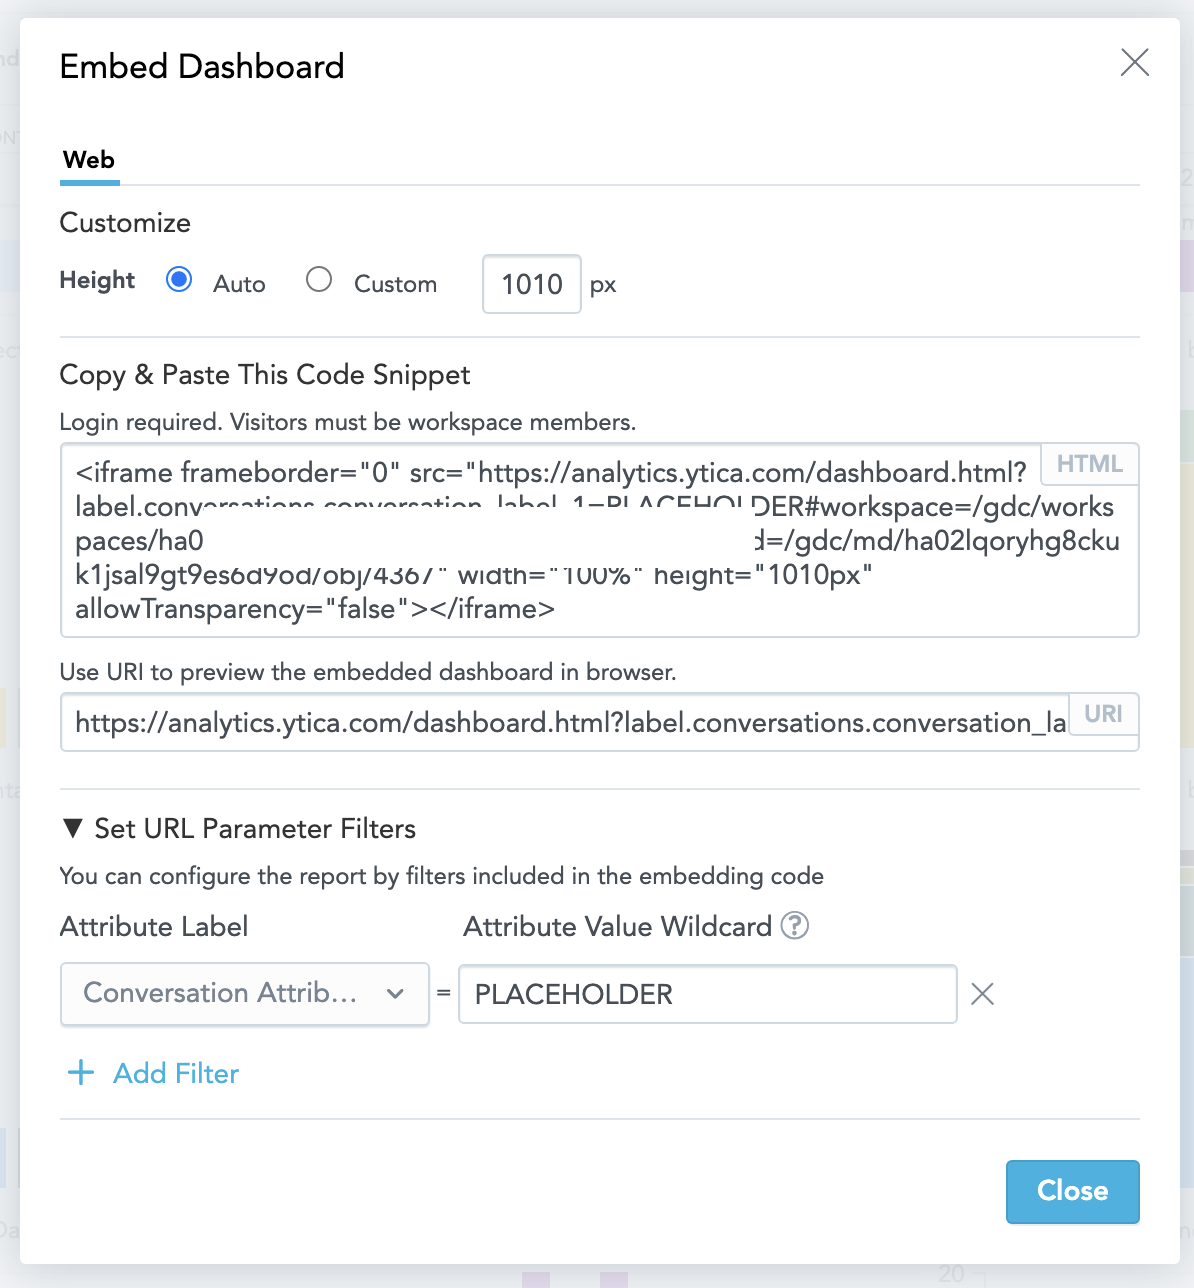
- In the window, open the section Set URL Parameter Filters and add a filter for conversation_attribute_1 (coming from Studio) > the value can be anything at the moment – it's a placeholder
- Copy the URI from "Use URI to preview the embedded dashboard in browser" > it should look something like
https://analytics.ytica.com/dashboard.html?label.conversations.conversation_label_1=PLACEHOLDER#workspace=/gdc/workspaces/<redacted>
&dashboard=/gdc/md/<redacted>/obj/<obj_id> - Save the link to notepad
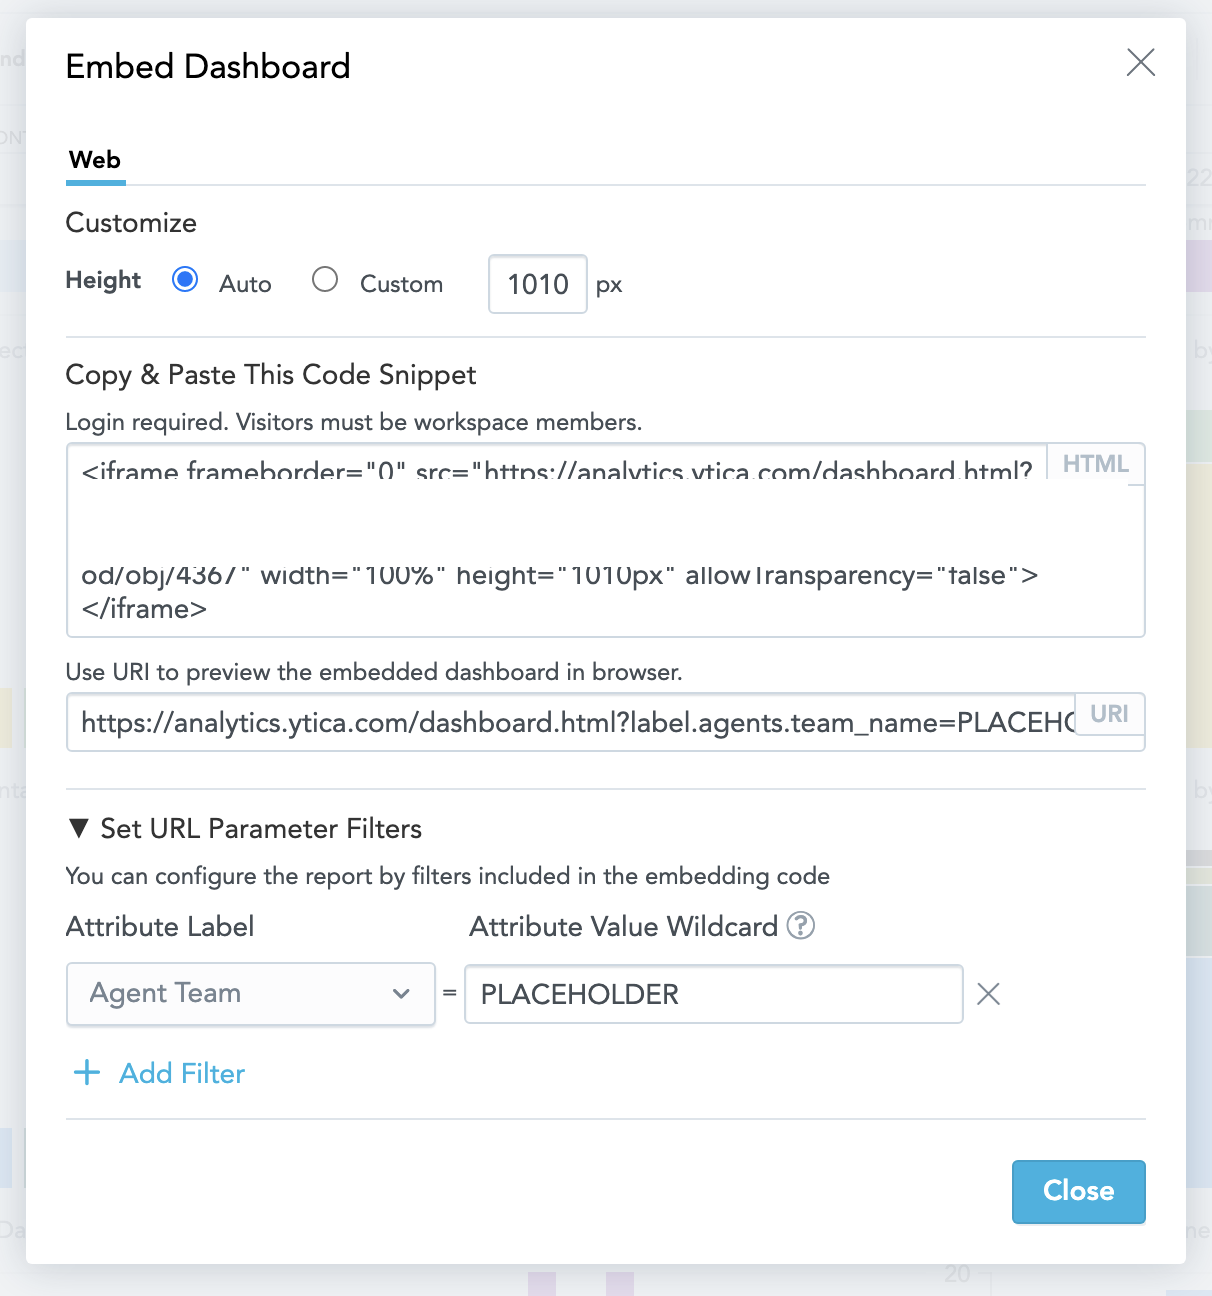
- Do the same for the second dashboard for activity, but now we need to use agent team in the filter
- The second link should look something like
https://analytics.ytica.com/dashboard.html?label.agents.team_name=PLACEHOLDER#workspace=/gdc/workspaces/<redacted>
&dashboard=/gdc/md/<redacted>/obj/<obj_id> - Again, store the link to notepad
Supervisor Plugin with Embedded Dashboards
We have the links to our two dashboards now, so let's create a simple plugin for Supervisors. We cannot forget that even if our Supervisors have only the wfo.dashboard_viewer role, they will still be able to view the default dashboards with all markets' data. We can either hide the default dashboards (explained in the above solutions), or hide the Dashboards menu item in Flex.
We are going to use the second approach (hiding) in this plugin.
-
To create a new plugin, please first follow the first three steps in the following guide: Creating Plugins for Twilio
-
The first part of the code removes all Flex Insights default menu items so that the Supervisors have access just to the custom dashboard:
const removeDefaultDashboard = ["dashboards", "analyze", "questionnaires"]; removeDefaultDashboard.forEach(key => { flex.SideNav.Content.remove(key); flex.ViewCollection.Content.remove(key); }); -
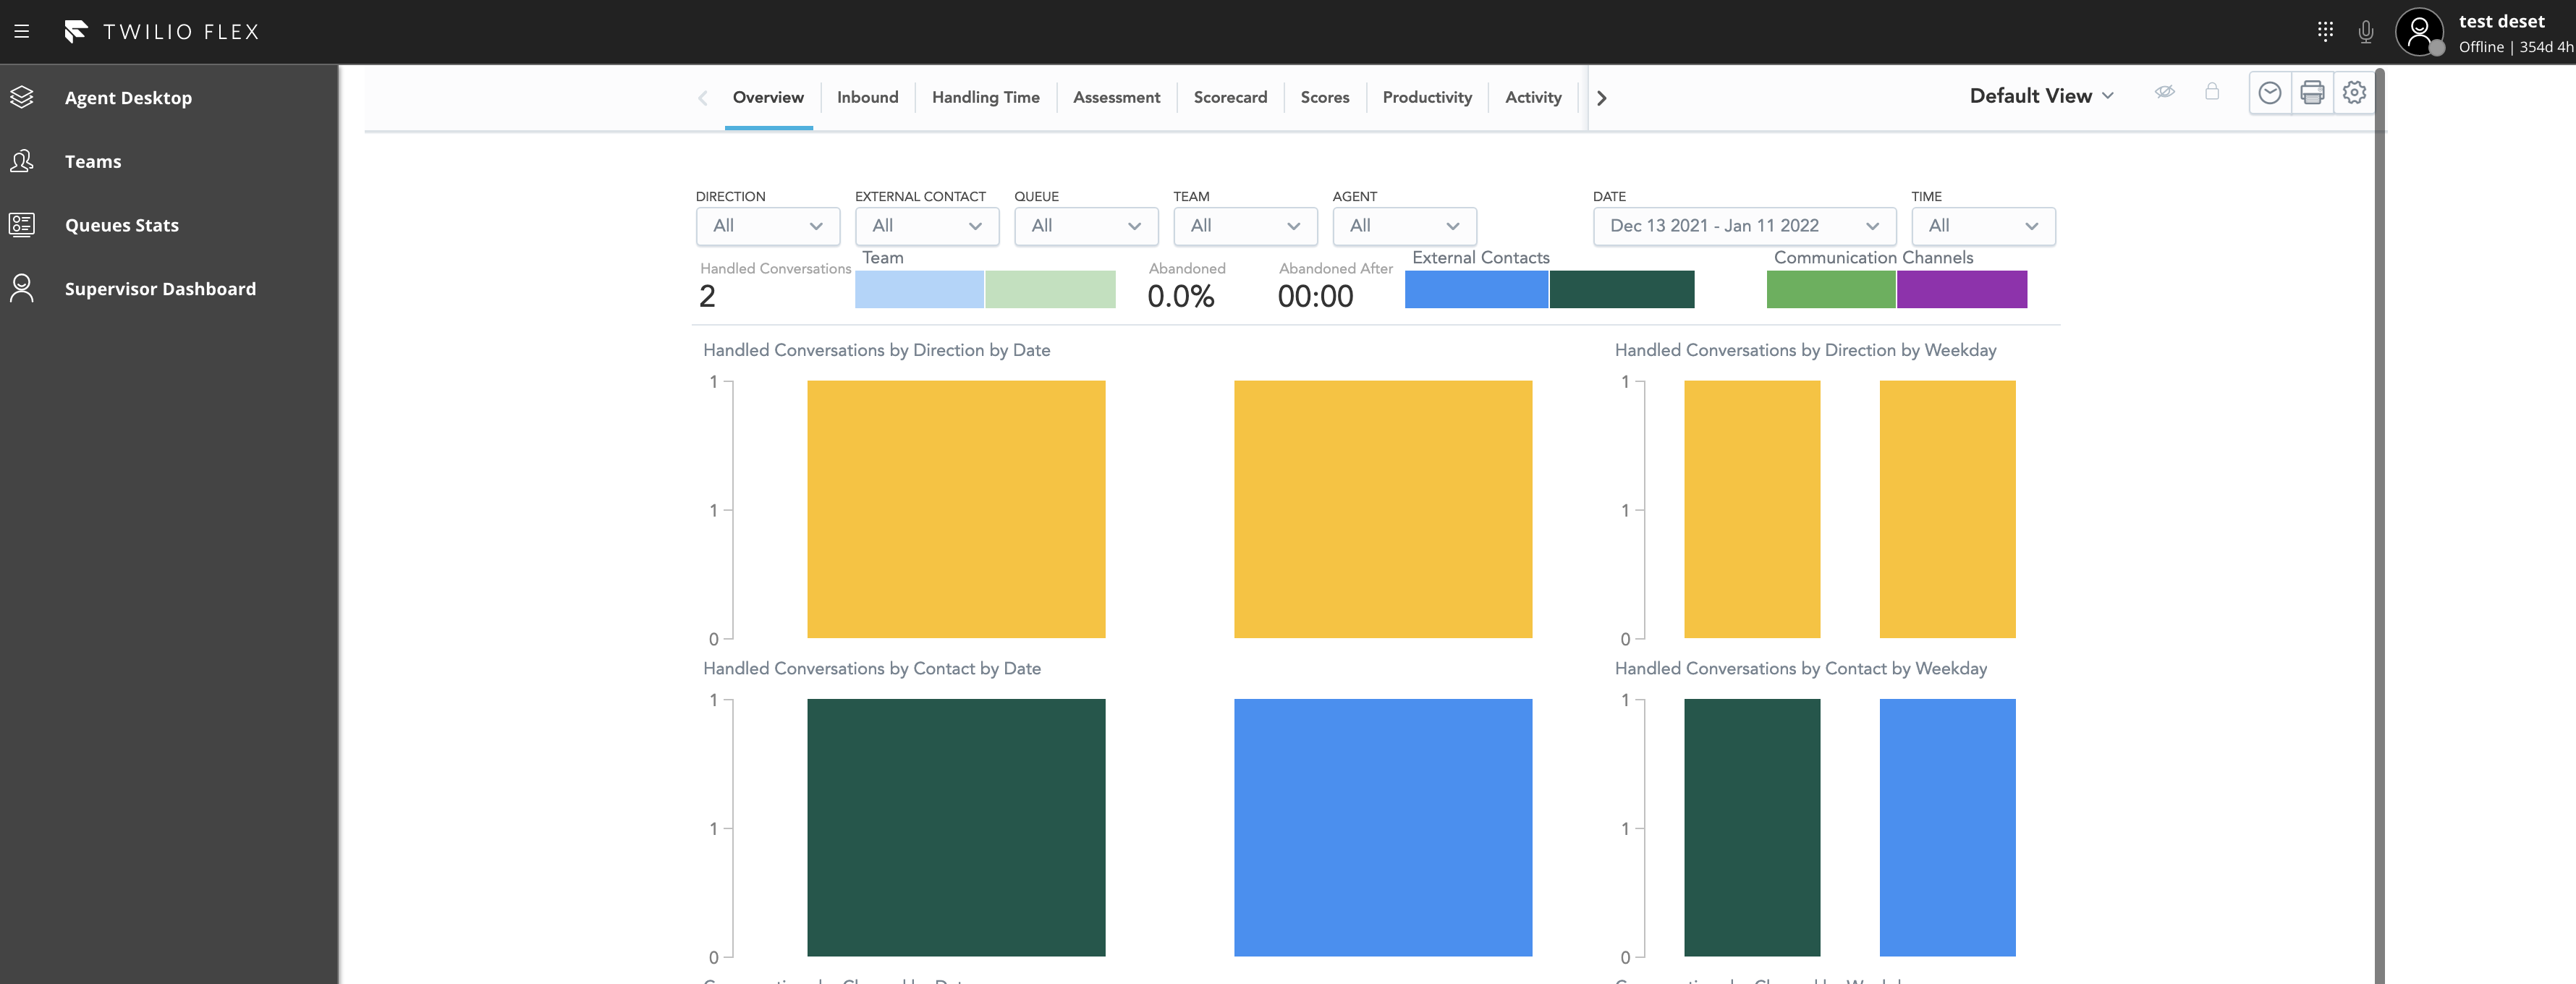
The second part of the code is for adding a new menu with iframed URI to the conversation dashboard.
 Flex.SideNav.Content.add(
    <Flex.SideLink
    showLabel={true}
    icon="DefaultAvatar"
    onClick={() =>
    Flex.Actions.invokeAction("NavigateToView", {
    viewName: "supervisor-dashboard"
    })}
    key="SupervisorDashboard"
    >
    Supervisor Dashboard
    </Flex.SideLink>
 );

 const options = { sortOrder: -1 };
 const market = manager.store.getState().flex.worker.attributes['market'];

 Flex.ViewCollection.Content.add(
    <Flex.View name="supervisor-dashboard" key="supervisor-dashboard-view" >
    <div>
    <iframe
    src="https://analytics.ytica.com/dashboard.html?label.conversations.conversation_attribute_1=${market}#workspace=/gdc/workspaces/<REDACTED>
    &dashboard=/gdc/md/<REDACTED>/obj/<OBJ_ID>"
    title="supervisor-dashboard"
    style={{ height: "100%", width: "80%", position: "absolute", left: "215px", top: "0px", bottom: "0px" }}
    key={Math.random()}
    ></iframe>
    </div>
    </Flex.View>,
    options
 );
As you can see, we replaced the PLACEHOLDER in URI with market that is taken from worker's attributes.
-
You can add the second dashboard for activities the same way or create a custom menu within the page for both dashboards. The second dashboard URI will have the PLACEHOLDER string replaced by market as well: label.agents.team_name={market}
And that's it! I did skip many steps around editing, running, and deploying plugins as it would add many repeated lines of explanation. I'd expect that if you want to create a Flex Plugin, that you have some experience with the process. This code is just a short demonstration of how to use embedded dashboards with filtering values automatically filled from Taskrouter worker attributes. With this approach, you don't have to perform any manual steps to manage multiple dashboards or users' permissions.
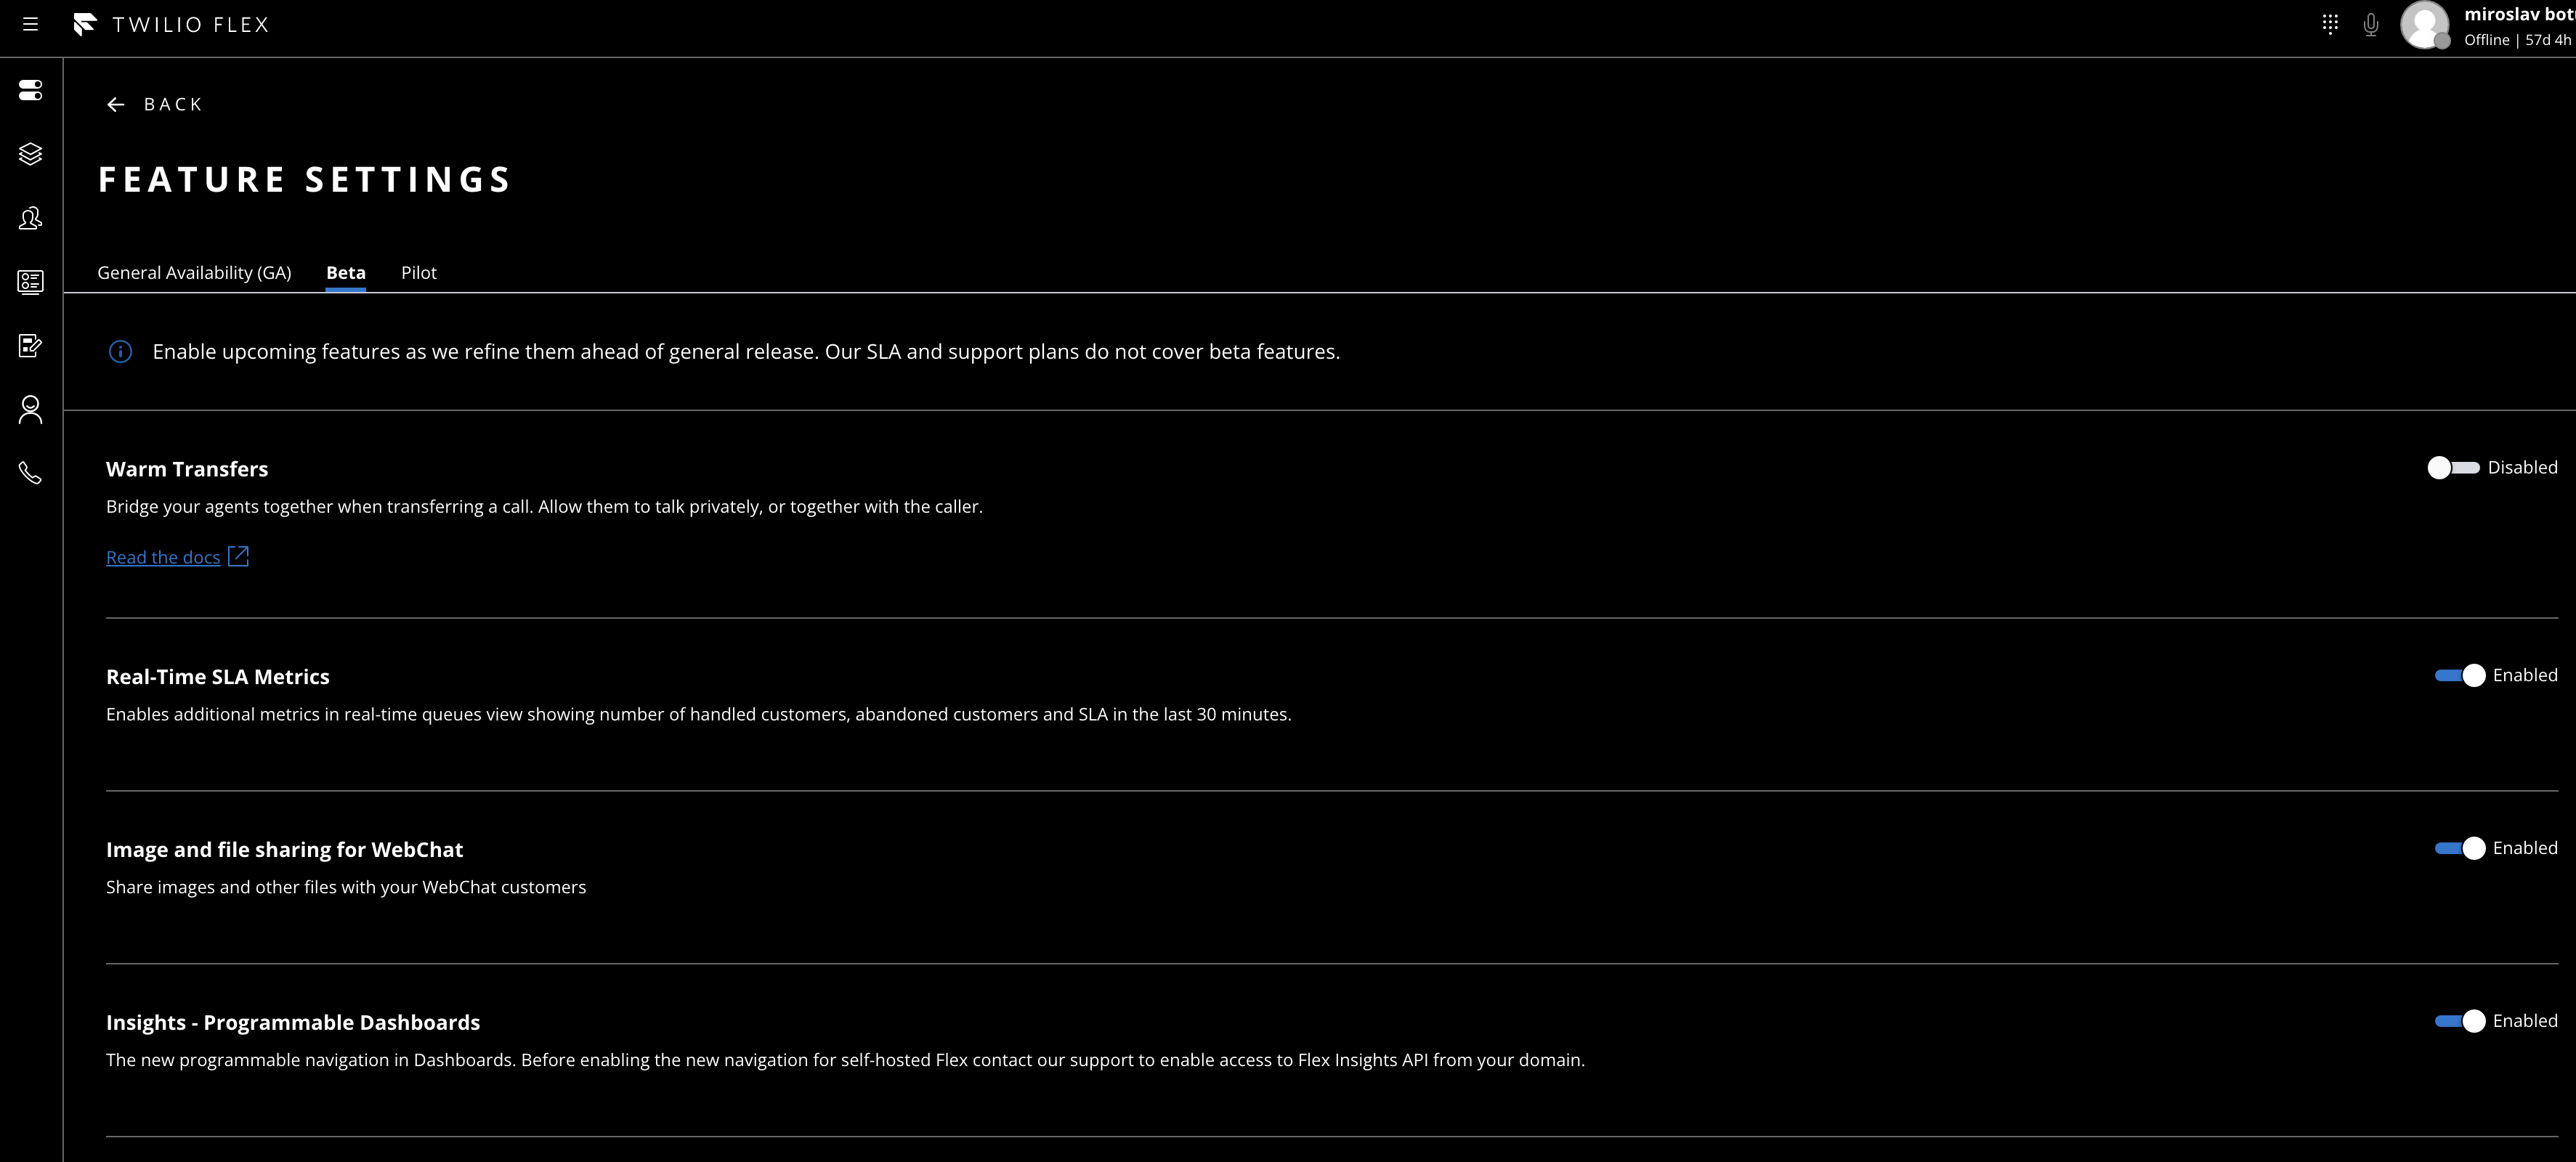
Please note that if there is a login screen instead of dashboards in the iframe, then try to enable the following feature in Flex > Admin > Feature Settings > Beta > Insights - Programmable Dashboards. This feature makes sure that all Flex users with the right permissions (e.g. Supervisor + wfo.dashboard_viewer) get authenticated immediately after their login to Flex.
Great Job!
Awesome! Now you've seen several options for how to display just the required set of data to your Supervisors. The main goal of this blog post was to describe several options to hide data, but each organization has its own unique structure, and it's really up to you to pick the right one (or even mix them up) to get the best view for your Supervisors with the least manual work possible. Our support and professional services will be more than happy to help in case of any questions or challenges.
Now that you can separate Flex Insights data, see our guide on how to build on Flex Insights.
Miroslav Botur is the Solution Architect of Twilio Professional Services. He is focused mainly on Flex Insights and enhancing analytics data by using Flex plugins, Functions and advanced Studio flows. He can be reached at mbotur [at] twilio.com

Related Resources
Twilio Docs
From APIs to SDKs to sample apps
API reference documentation, SDKs, helper libraries, quickstarts, and tutorials for your language and platform.
Resource Center
The latest ebooks, industry reports, and webinars
Learn from customer engagement experts to improve your own communication.
Ahoy
Twilio's developer community hub
Best practices, code samples, and inspiration to build communications and digital engagement experiences.